. 2015 Oct 14;35(41):14042-56.
doi: 10.1523/JNEUROSCI.2781-15.2015.

Reducing Ribosomal Protein S6 Kinase 1 Expression Improves Spatial Memory and Synaptic Plasticity in a Mouse Model of Alzheimer's Disease

Affiliations

Reducing Ribosomal Protein S6 Kinase 1 Expression Improves Spatial Memory and Synaptic Plasticity in a Mouse Model of Alzheimer's Disease

Antonella Caccamo et al. J Neurosci. .

Abstract

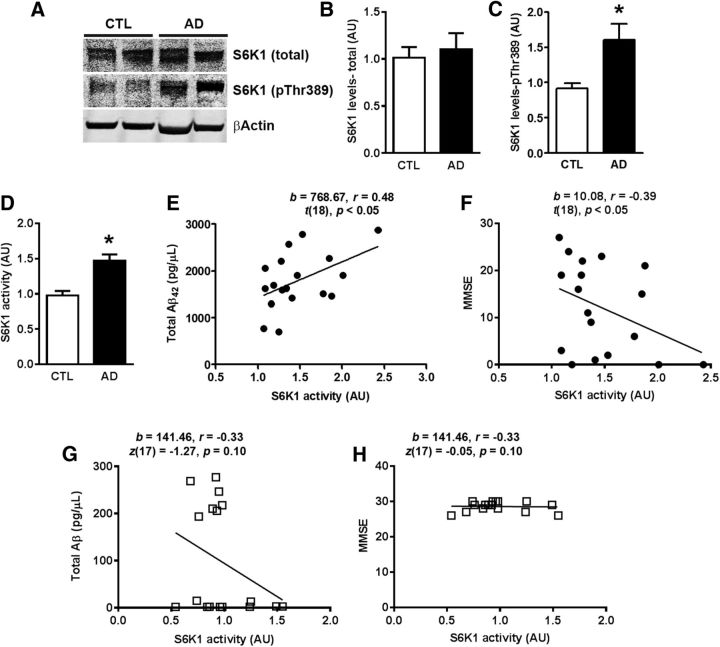
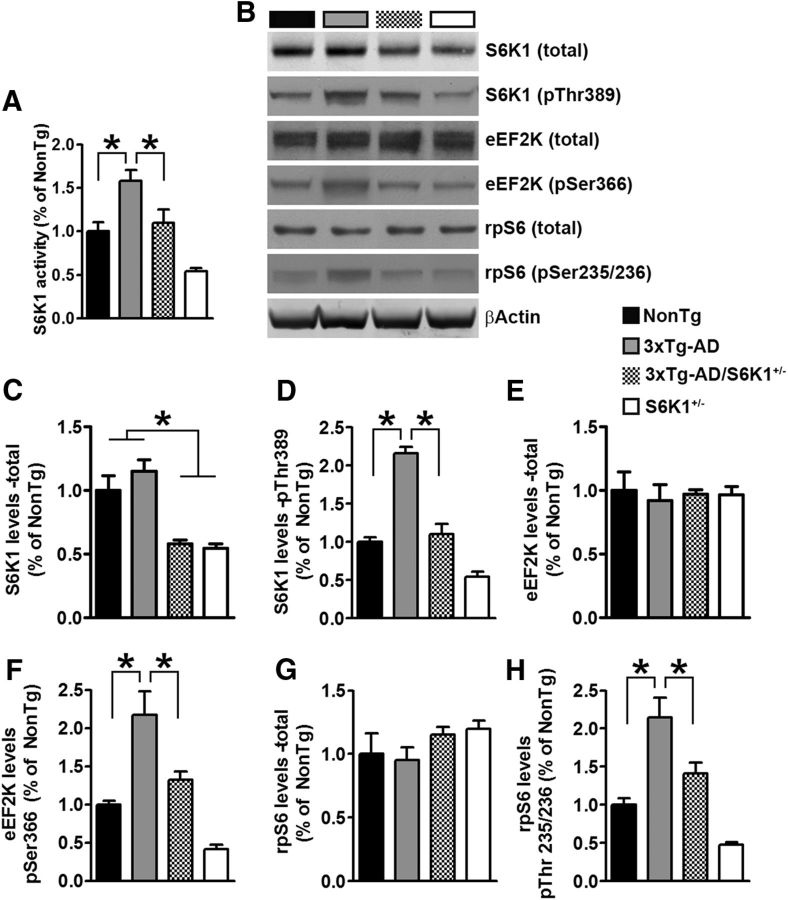
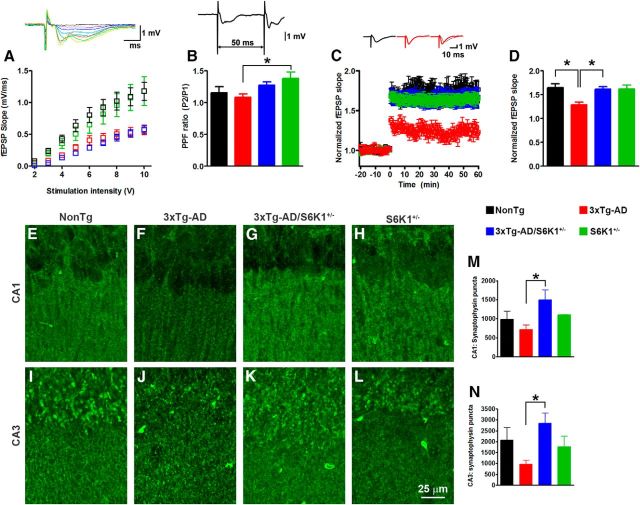
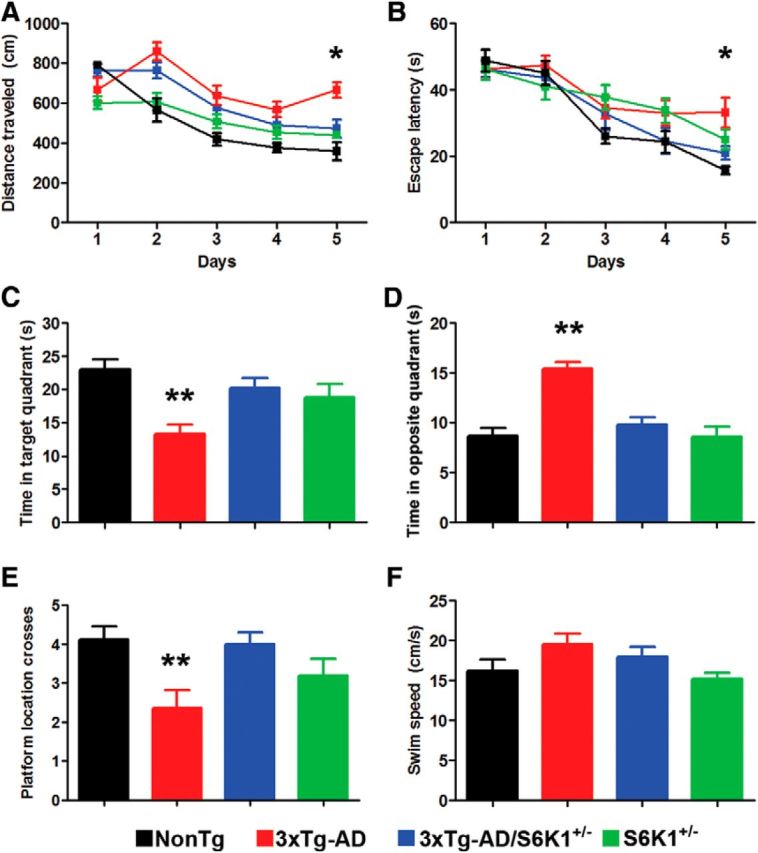
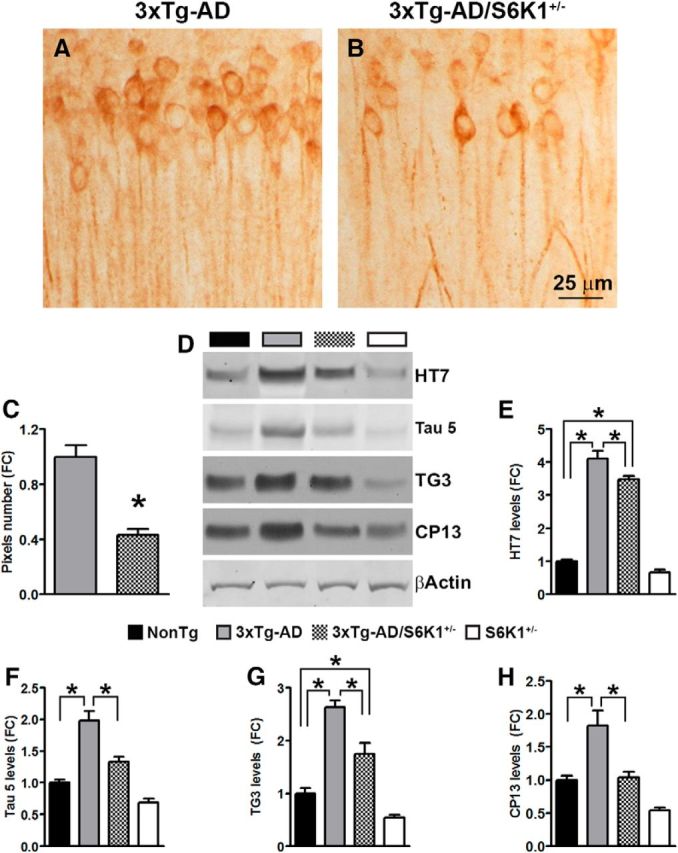
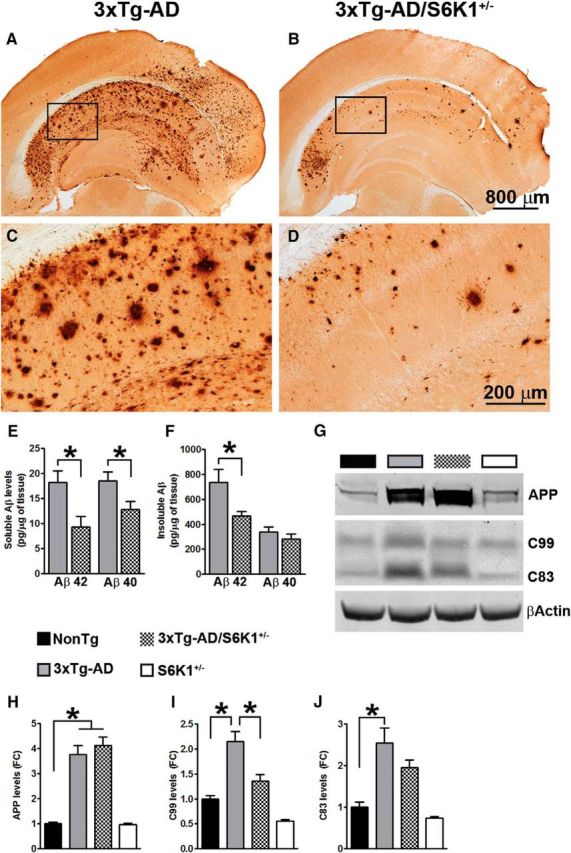
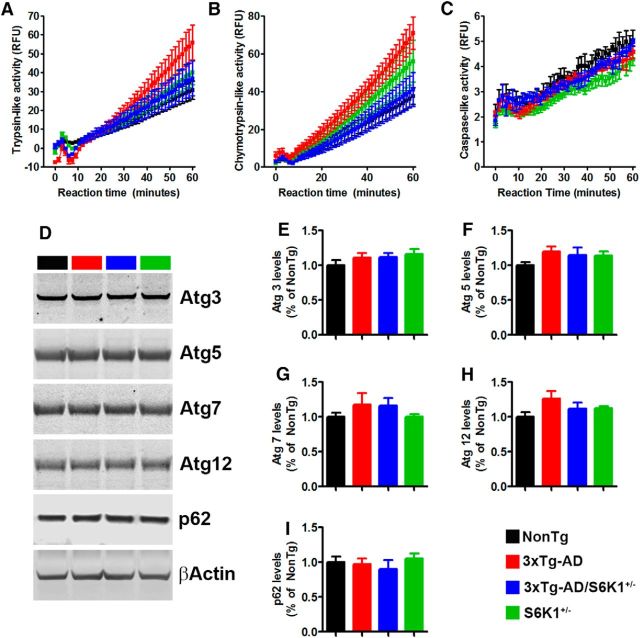
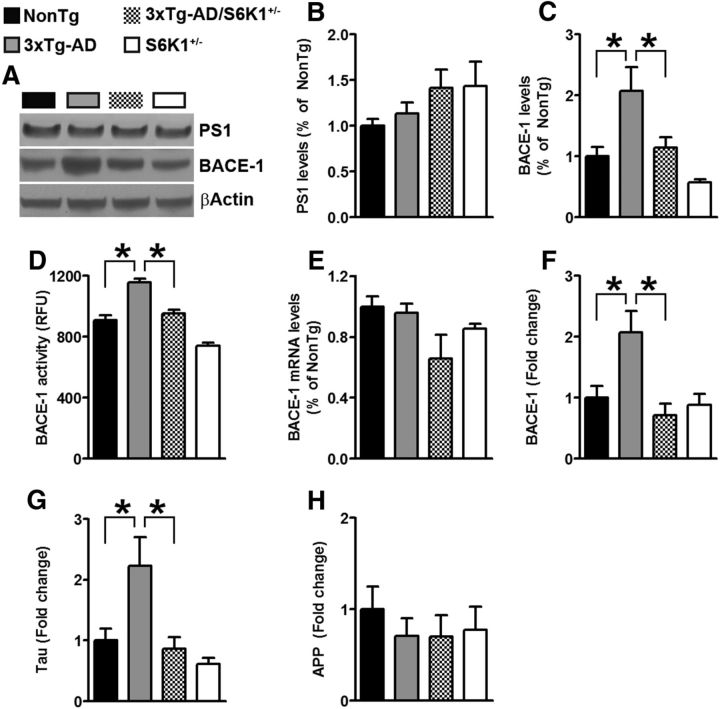
Aging is the most important risk factor associated with Alzheimer's disease (AD); however, the molecular mechanisms linking aging to AD remain unclear. Suppression of the ribosomal protein S6 kinase 1 (S6K1) increases healthspan and lifespan in several organisms, from nematodes to mammals. Here we show that S6K1 expression is upregulated in the brains of AD patients. Using a mouse model of AD, we found that genetic reduction of S6K1 improved synaptic plasticity and spatial memory deficits, and reduced the accumulation of amyloid-β and tau, the two neuropathological hallmarks of AD. Mechanistically, these changes were linked to reduced translation of tau and the β-site amyloid precursor protein cleaving enzyme 1, a key enzyme in the generation of amyloid-β. Our results implicate S6K1 dysregulation as a previously unidentified molecular mechanism underlying synaptic and memory deficits in AD. These findings further suggest that therapeutic manipulation of S6K1 could be a valid approach to mitigate AD pathology.

Significance statement: Aging is the most important risk factor for Alzheimer's disease (AD). However, little is known about how it contributes to AD pathogenesis. S6 kinase 1 (S6K1) is a protein kinase involved in regulation of protein translation. Reducing S6K1 activity increases lifespan and healthspan. We report the novel finding that reducing S6K1 activity in 3xTg-AD mice ameliorates synaptic and cognitive deficits. These improvement were associated with a reduction in amyloid-β and tau pathology. Mechanistically, lowering S6K1 levels reduced translation of β-site amyloid precursor protein cleaving enzyme 1 and tau, two key proteins involved in AD pathogenesis. These data suggest that S6K1 may represent a molecular link between aging and AD. Given that aging is the most important risk factor for most neurodegenerative diseases, our results may have far-reaching implications into other diseases.

Keywords: AD; Aβ; aging; mTOR; plaques; tangles.


Figures

Figure 1.
Figure 1.
S6K1 activity correlates with Aβ levels and MMSE scores. A, Representative Western blots of proteins extracted from the inferior frontal gyrus of AD and control (CTL) cases. The blots were probed with the indicated antibodies. B, C, Quantitative analyses of the arbitrary fluorescent units of the blots indicated that total S6K1 levels were similar between AD and CTL cases (t(33) = 0.42, p > 0.05). In contrast, the levels of S6K1-pThr389 were significantly higher in AD compared with CTL cases (t(33) = 2.81, p = 0.008). D, S6K1 enzymatic activity was significantly higher in AD brains compared with CTL cases (t(33) = 4.48, p < 0.0001). E–H, Scatter plots analyzed by linear regression displaying the correlation between S6K1 activity and total Aβ42 levels and between S6K1 activity and MMSE scores in AD and CTL cases. Higher S6K1 activity positively correlated with higher levels of total Aβ42 in AD but not in CLT brains. A negative correlation was also evident between S6K1 activity and MMSE scores in AD but not in CTL brains. Western blot data were obtained by normalizing the arbitrary fluorescent unit of the protein of interest to β-actin (used as a loading control). Data in B–D were analyzed by unpaired t test. For each experiment shown, n = 17 brains for CTL and n = 18 brains for AD cases. Error bars represent mean ± SEM.
Figure 2.
Figure 2.
Reduced S6K1 signaling in 3xTg-AD/S6K1+/− mice. A, The graph shows S6K1 enzymatic activity across the four groups. The values were significantly different among the groups (p < 0.001; F(3,28) = 14.15). Post hoc tests indicated that S6K1 activity in 3xTg-AD mice was significantly different than NonTg mice (p < 0.01, t = 3.63), 3xTg-AD/S6K1+/− mice (p < 0.05, t = 3.03), and S6K1+/− mice (p < 0.01, t = 6.49). Further, S6K1 activity in NonTg mice was similar to that in 3xTg-AD/S6K1+/− mice (p > 0.05, t = 0.60) and significantly different from that in S6K1+/− mice (p < 0.05, t = 2.85). Finally, S6K1 activity in 3xTg-AD/S6K1+/− mice was different from that in S6K1+/− mice (p < 0.05, t = 3.45). B, Representative Western blots of protein extracted from the brains of NonTg, 3xTg-AD, 3xTg-AD/S6K1+/−, and S6K1+/− mice. Blots were probed with the indicated antibodies. C, Quantitative analyses of the blots probed for total S6K1. The values were significantly different among the groups (p < 0.0001; F(3,28) = 15.01). Post hoc tests indicated that total S6K1 levels in NonTg mice were significantly different from those in 3xTg-AD/S6K1+/− (p < 0.01, t = 3.80) and S6K1+/− mice (p < 0.01, t = 4.10). In contrast, no difference was found between NonTg and 3xTg-AD mice (p > 0.05, t = 1.37). Total S6K1 levels in 3xTg-AD mice were significantly different from those in 3xTg-AD/S6K1+/− mice (p < 0.01, t = 5.18) and S6K1+/− mice (p < 0.01, t = 5.48). Finally, total S6K1 levels were similar between 3xTg-AD/S6K1+/− and S6K1+/− mice (p > 0.05, t = 0.30). D, The levels of S6K1 phosphorylated at Thr389 (pThr389) was significantly different among the four groups (p < 0.0001; F(3,28) = 57.48). Post hoc tests indicated that S6K1-pThr389 levels in 3xTg-AD mice were significantly different from those in NonTg mice (p < 0.01, t = 9.11), 3xTg-AD/S6K1+/− mice (p < 0.01, t = 8.30), and S6K1+/− mice (p < 0.01, t = 12.67). S6K1-pThr389 levels in NonTg mice were similar to those in 3xTg-AD/S6K1+/− mice (p > 0.05, t = 0.81) but statistically different from those in S6K1+/− mice (p < 0.01, t = 3.57). Finally, S6K1-pThr389 levels in 3xTg-AD/S6K1+/− mice were statistically different from those in S6K1+/− mice (p < 0.01, t = 4.37). E, The graph shows total levels of eEF2K. No differences were found among the four groups (p > 0.05; F(3,28) = 0.10). F, The graph shows eEF2K levels phosphorylated at Ser366 (eEF2K-pSer366). The values were different among the four groups (p < 0.0001; F(3,28) = 19.66). Post hoc tests indicated that the eEF2K-pSer366 levels in NonTg mice were significantly different from those in 3xTg-AD mice (p < 0.01, t = 5.03), but not from those in 3xTg-AD/S6K1+/− (p > 0.05, t = 1.38) or S6K1+/− mice (p > 0.05, t = 2.48). In 3xTg-AD mice, the eEF2K-pSer366 levels were significantly different compared with those in 3xTg-AD/S6K1+/− (p < 0.01, t = 3.65) and S6K1+/− mice (p < 0.01, t = 7.51). eEF2K-pSer366 levels were also different between 3xTg-AD/S6K1+/− and S6K1+/− mice (p < 0.01, t = 3.86). G, The graph shows total levels of rpS6. No difference was evident among the four groups (p > 0.05; F(3,28) = 1.24). H, The graph shows rpS6 levels phosphorylated at Thr235/236 (pThr235/236). The values were different among the four groups (p < 0.0001; F(3,28) = 20.29). Post hoc tests indicated that the rpS6-pThr235/236 levels in NonTg mice were significantly different compared with those in 3xTg-AD mice (p < 0.01, t = 5.17), but not when compared with those in 3xTg-AD/S6K1+/− (p > 0.05, t = 1.86) or S6K1+/− mice (p > 0.05, t = 2.38). rpS6-pThr235/236 levels in 3xTg-AD mice were significantly different compared with those in 3xTg-AD/S6K1+/− (p < 0.05, t = 3.30) and S6K1+/− mice (p < 0.01, t = 7.55). rpS6-pThr235/236 levels were also different between 3xTg-AD/S6K1+/− and S6K1+/− mice (p < 0.01, t = 4.24). Western blot data were obtained by normalizing the arbitrary fluorescent unit of the protein of interest to β-actin (used as a loading control). Data were analyzed by one-way ANOVA followed by Bonferroni's post hoc tests. For each experiment shown, n = 8 mice/genotype. Error bars represent mean ± SEM.
Figure 3.
Figure 3.
Reduced S6K1 signaling rescued synaptic deficits in 3xTg-AD mice. A, I/O curves were obtained by measuring fEPSPs elicited in CA1 by stimulation of the Schaffer collaterals at increasing stimulus intensities. We analyzed the slopes of each curve and found that they were statistically different from each other (F(3,28) = 51.40; p < 0.0001). Post hoc tests indicated that the I/O curve of NonTg mice was statistically significant from that of 3xTg-AD mice (p < 0.01, q = 12.39) and 3xTg-AD/S6K1+/− mice (p < 0.01, q = 11.68), but not from that of S6K1+/− mice (p > 0.05, q = 0.72). The I/O curve of 3xTg-AD mice was statistically significant compared with that of S6K1+/− mice (p < 0.01, q = 13.11), but not compared with that of 3xTg-AD/S6K1+/− mice (p > 0.05, q = 0.71). Last, the I/O curves of 3xTg-AD/S6K1+/− and S6K1+/− were significantly different from each other (p < 0.01, q = 12.40). B, The graph shows the amount of paired-pulse facilitation (PPF) across the four groups (F(3,56) = 3.05; p = 0.036). Post hoc tests indicated that the only statistically significant difference was between 3xTg-AD and S6K1+/− mice (p < 0.05, q = 3.96). C, Hippocampal LTP measured from 3xTg-AD, 3xTg-AD/S6K1+/−, S6K1+/−, and NonTg mice. D, Cumulative data analyzed by one-way ANOVA showing the mean fEPSP slope 5 min after tetanic stimulation. Compared with NonTg mice, 3xTg-AD mice showed significant reduction of LTP (p < 0.001; F(3,50) = 8.06). In addition, LTP in 3xTg-AD;S6K1+/− mice was significantly higher than that in 3xTg-AD mice (p < 0.01), and it was similar to LTP from NonTg mice (p > 0.05). Data were recorded from NonTg (n = 13 slices from 5 mice), 3xTg-AD (n = 15 slices from 6 mice), 3xTg-AD/S6K1+/− (n = 16 slices from 5 mice), and S6K1+/− (n = 10 from 5 mice). E–L, Representative confocal microphotographs of CA1 and CA3 sections from NonTg (n = 3 mice), 3xTg-AD (n = 6 mice), 3xTg-AD/S6K1+/− (n = 6 mice), and S6K1+/− (n = 3 mice). Sections were stained with an anti-synaptophysin antibody. M, N, Quantitative analysis of five images per tissue section of CA1 and CA3 through the z-axis (3 μm step). The data represent the total number of puncta across the five images. Synaptophysin immunoreactivity was significantly different among the four groups (CA1: p = 0.05, F(3,14) = 3.21; CA3: p = 0.017, F(3,14) = 4.80). Post hoc tests indicated that in both hippocampal subregions the only statistically significant difference was between 3xTg-AD and 3xTg-AD/S6K1+/− mice (CA1: p < 0.05, t = 3.07; CA3: p < 0.05, t = 3.77). Data in A and B were analyzed by one-way ANOVA followed by Tukey's multiple-comparison test. Data in C and D were analyzed by a two-way mixed ANOVA followed by a post hoc multiple comparisons based on Holm–Sidak. Data in M and N were analyzed by one-way ANOVA followed by Bonferroni's post hoc tests. Error bars represent mean ± SEM.
Figure 4.
Figure 4.
Reducing S6K1 levels improves spatial learning and memory deficits in 3xTg-AD mice. A, B, Learning curves of mice trained in the spatial reference version of the Morris water maze (NonTg, n = 10 mice; S6K1+/−, n = 10 mice; 3xTg-AD, n = 14 mice; 3xTg-AD/S6K1+/−, n = 14 mice). The distance traveled and the escape latency to find the hidden platform was plotted against the days of training. The values for each day represent the average of four training trails. For the distance traveled, we found significant effects for day (p < 0.0001, F(3,43) = 23.81), genotype (p < 0.0001, F(3,43) = 15.99), and genotype × day interaction (p = 0.0018, F(12,172) = 2.74). For the escape latency, we found significant effects for day (p < 0.0001, F(3,43) = 32.19) and genotype (p = 0.008, F(3,43) = 4.01). Post hoc tests indicated that the distance traveled was higher in 3xTg-AD mice compared with NonTg mice on day 2 (p < 0.001, t = 4.38), day 3 (p < 0.01, t = 3.27), day 4 (p < 0.05, t = 2.85), and day 5 (p < 0.001, t = 4.57). However, the 3xTg-AD/S6K1+/− mice performed significantly worse than NonTg mice only on day 2 (p < 0.05, t = 2.91). Further, the distance traveled between 3xTg-AD and 3xTg-AD/S6K1+/− was significantly different on day 5 (p < 0.01, t = 3.20). The escape latency of NonTg mice was significantly different compared with 3xTg-AD mice at day 5 (p < 0.01, t = 3.47). However, 3xTg-AD/S6K1+/− mice performed as well as NonTg mice (day 5: p > 0.05, t = 1.03). Notably, the escape latency and distance traveled was not statistically different between NonTg and S6K1+/− mice. C, Time mice spent in the target quadrant during a single 60 s trial. We found a significant difference among the groups (p = 0.001, F(3,43) = 6.52). Bonferroni's corrected post hoc tests showed that 3xTg-AD mice performed significantly worse when compared with NonTg mice (p < 0.05, t = 4.14). More importantly, the 3xTg-AD/S6K1+/− mice performed significantly better than 3xTg-AD mice (p < 0.05, t = 3.30) and as well as NonTg mice (p > 0.05, t = 2.42). D, Time mice spent in the opposite quadrant during a single 60 s trial. We found a significant difference among the groups (p < 0.0001, F(3,43) = 18.06). Post hoc tests showed that 3xTg-AD mice performed significantly worse when compared with NonTg mice (p < 0.05, t = 5.80). More importantly, the 3xTg-AD/S6K1+/− mice performed significantly better than 3xTg-AD mice (p < 0.05, t = 5.46) and as well as NonTg mice (p > 0.05, t = 0.98). E, Number of platform location crosses during a single 60 s probe trial. We found a significant difference among the groups (p = 0.007, F(3,43) = 4.52). Post hoc tests showed that 3xTg-AD mice performed significantly worse than NonTg mice (p < 0.05, t = 3.01). In contrast, 3xTg-AD/S6K1+/− mice performed significantly better than 3xTg-AD mice (p < 0.05, t = 3.19) and as well as NonTg mice (p > 0.05, t = 0.19). F, Swim speed was similar among the four different groups (p > 0.05, F(3,43) = 2.38). Learning data were analyzed by two-way ANOVA; probe trials were analyzed by one-way ANOVA. Bonferroni's was used for post hoc tests. Asterisk indicates a significant difference between 3xTg-AD and 3xTg-AD/S6K1+/− mice. Error bars represent mean ± SEM.
Figure 5.
Figure 5.
Reduced tau pathology in 3xTg-AD/S6K1+/− mice. A, B, Representative microphotographs of CA1 neurons from 3xTg-AD and 3xTg-AD/S6K1+/− mice stained with the anti-tau antibody CP13, which recognizes tau phosphorylated at Ser202. C, Quantitative analysis of the CP13 immunoreactivity by unpaired t test (t(14) = 5.96, p < 0.0001). D, Representative Western blots of protein extracted from NonTg, 3xTg-AD, 3xTg-AD/S6K1+/−, and S6K1+/− mice. Blots were probed with the indicated antibodies. The HT7 antibody recognizes total human tau, the tau 5 antibody recognizes total mouse tau, the TG3 antibody recognizes tau phosphorylated at Thr231, and the CP13 antibody recognizes tau phosphorylated at Ser202. E–H, Quantitative analyses of the blots obtained by normalizing the quantity of a specific protein with its loading control, β-actin. Data were analyzed by one-way ANOVA followed by a Bonferroni's multiple-comparison test. For HT7: p < 0.0001, F(3,28) = 166. Post hoc tests indicated that all groups were significantly different from each other with the exception of the NonTg with the S6K1+/− mice. For tau 5: p < 0.0001, F(3,28) = 35.83. Post hoc tests indicated that the 3xTg-AD mice have significantly higher tau 5 levels than all the other three groups. Tau 5 levels in 3xTg-AD/S6K1+/− mice were higher than those of S6K1+/− mice, while no differences were observed between NonTg and 3xTg-AD/S6K1+/− and between NonTg and S6K1+/− mice. For TG3: p < 0.0001, F(3,28) = 44.66. Post hoc tests indicated that all groups were significantly different from each other with the exception of the NonTg with the S6K1+/− mice. For CP13: p < 0.0001, F(3,28) = 18.53. Post hoc tests indicated that all groups were significantly different from each other with the exception of the NonTg with the S6K1+/− mice. n = 8 mice/genotype for each of the experiments shown here. Error bars represent mean ± SEM.
Figure 6.
Figure 6.
Reduced Aβ pathology in 3xTg-AD/S6K1+/− mice. A–D, Representative microphotographs of brain sections from 3xTg-AD and 3xTg-AD/S6K1+/− mice stained with an anti-Aβ42-specific antibody. C and D are high-magnification images of the boxed areas in A and B, respectively. E, Sandwich ELISA measurements of soluble Aβ42 and Aβ40 levels. The levels of both peptides were significantly lower in mice lacking one copy of the S6K1 gene (Aβ40: t(14) = 2.31, p = 0.03; Aβ42: t(14) = 2.81, p = 0.01; n = 8 mice/genotype). F, Sandwich ELISA measurements of insoluble Aβ42 and Aβ40 levels. While the levels of insoluble Aβ40 were similar between the two groups (t(14) 0.92, p > 0.05), the levels of insoluble Aβ42 were significantly lower in 3xTg-AD/S6K1+/− mice compared with those in 3xTg-AD mice (t(14) = 2.46, p = 0.02; n = 8 mice/genotype). ELISA data were analyzed by Student's t test. G, Representative Western blots of protein extracted from NonTg, 3xTg-AD, 3xTg-AD/S6K1+/−, and S6K1+/− mice. To identify full-length APP, blots were probed with 6E10. To identify C99 and C83, blots were probed with CT20, a C-terminal anti-APP antibody. H–J, Quantitative analyses of the blots obtained by normalizing the quantity of a specific protein with its loading control, β-actin. Data were analyzed by one-way ANOVA followed by a Bonferroni's multiple-comparison test (n = 8 mice/genotype; for APP: p < 0.0001, F(3,28) = 49.05). Post hoc analysis indicated that APP levels were significantly higher in 3xTg-AD and 3xTg-AD/S6K1+/− compared with the other two groups. No differences were observed between 3xTg-AD and 3xTg-AD/S6K1+/− mice and between NonTg and S6K1+/− mice. For C99: p < 0.0001; F(3,28) = 28.44. Post hoc tests indicated that C99 levels were significantly higher in 3xTg-AD mice compared with the other three groups. C99 levels were also higher in 3xTg-AD/S6K1+/− compared with those in S6K1+/− mice. No significant difference was found between NonTg and 3xTg-AD/S6K1+/− mice and between NonTg and S6K1+/− mice. For C83: p < 0.0001, F(3,28) = 15.90. Post hoc tests indicated that C83 levels were significantly higher in 3xTg-AD and 3xTg-AD/S6K1+/− compared with the other two groups. No differences were observed between 3xTg-AD and 3xTg-AD/S6K1+/− mice and between NonTg and S6K1+/− mice. Error bars represent mean ± SEM.
Figure 7.
Figure 7.
Proteasome activity and autophagy induction are not affected by S6K1 signaling. A–C, Brain homogenates from NonTg, 3xTg-AD, 3xTg-AD/S6K1+/−, and S6K1+/− mice were analyzed for proteasome activity (n = 4 mice/genotype). Data were analyzed by two-way ANOVA, which revealed no genotype effect of any of the three enzymatic activities measured. A: p > 0.05, F(3,12) = 0.77; B: p > 0.05, F(3,12) = 2.56; C: p > 0.05, F(3,12) = 2.87. D, Representative Western blots of protein extracted from the brains of NonTg, 3xTg-AD, 3xTg-AD/S6K1+/−, and S6K1+/− mice (n = 8 mice/genotype). Blots were probed with the indicated antibodies. E–I, Quantitative analyses of the blots were obtained by normalizing the protein of interest to β-actin, used as a loading control. One-way ANOVA analyses indicated that none of these markers was statistically significant among the four groups. B: p > 0.05, F(3,28) = 0.43; C: p > 0.05, F(3,28) = 1.35; D: p > 0.05, F(3,28) = 0.81; E: p > 0.05, F(3,28) = 1.82; F: p > 0.05, F(3,28) = 0.50. Error bars represent mean ± SEM.
Figure 8.
Figure 8.
Removing one copy of the S6K1 gene reduces BACE-1 activity and translation and tau translation. A, Representative Western blot of protein extracted from NonTg, 3xTg-AD, 3xTg-AD/S6K1+/−, and S6K1+/− mice (n = 8 mice/genotype). Blots were probed with the indicated antibodies. B, The graph shows the quantitative analyses of the PS1 blot. The values were similar among the four groups (p = 0.23; F(3,28) = 1.38). C, Quantitative analyses of the BACE-1 blot. BACE-1 protein levels were significantly different among the four groups (p = 0.0007, F(3,28) = 7.62). Post hoc tests revealed that BACE-1 levels were significantly different between NonTg and 3xTg-AD mice (p < 0.05, t = 3.31) but not different from those of 3xTg-AD/S6K1+/− or S6K1+/− mice. In contrast, BACE-1 levels in 3xTg-AD mice were significantly different from those in 3xTg-AD/S6K1+/− (p < 0.05, t = 2.87) and S6K1+/− (p < 0.01, t = 4.63) mice. No difference was found between 3xTg-AD/S6K1+/− or S6K1+/− mice. D, The graph shows BACE-1 enzymatic activity (n = 6 mice/genotype), which was significantly different among the four groups (p < 0.0001, F(3,20) = 7.62). Post hoc analyses revealed that BACE-1 activity in NonTg mice was significantly different from that in 3xTg-AD mice (p < 0.01, t = 6.66) and that in S6K1+/− mice (p < 0.01, t = 4.43), but not from that in 3xTg-AD/S6K1+/− mice (p > 0.05, t = 1.24). BACE-1 activity in 3xTg-AD mice was significantly different compared with that in 3xTg-AD/S6K1+/− mice (p < 0.01, t = 5.42) and that in S6K1+/− mice (p < 0.01, t = 11.09). A significant difference was also found between 3xTg-AD/S6K1+/− and S6K1+/− mice (p < 0.01, t = 5.66). E, The graph shows BACE-1 mRNA levels obtained by qPCR (n = 4 mice/genotype), which were not statistically different among the four groups (p > 0.05, F(3,12) = 2.82). F, The graph shows BACE-1 mRNA levels in the fractions containing heavy polysomes, which are expressed as fold change over NonTg (see Materials and Methods). The levels of BACE-1 mRNA were significantly different among the four groups (p = 0.0027, F(3,20) = 6.66). Post hoc tests indicated that the 3xTg-AD mice were significantly different than the other three groups, while 3xTg-AD/S6K1+/− mice were similar to NonTg mice. G, The levels of tau mRNA were significantly different among the four groups (p = 0.002, F(3,20) = 7.89). Post hoc tests indicated that the 3xTg-AD mice were significantly different than the other three groups, while 3xTg-AD/S6K1+/− mice were similar to NonTg mice. H, The levels of APP mRNA were not significantly different among the four groups (p = 0.78, F(3,20) = 0.35). Quantitative analyses of the blots obtained by normalizing the quantity of a specific protein with its loading control, β-actin. Data were analyzed by one-way ANOVA followed by a Bonferroni's (BE) or Tukey's (FI) multiple-comparison tests. Error bars represent mean ± SEM.

References

    1. Alzheimer's Association. 2014 Alzheimer's disease facts and figures. Alzheimer's Dement. 2014;10:e47–e92. - PubMed
    1. Antion MD, Merhav M, Hoeffer CA, Reis G, Kozma SC, Thomas G, Schuman EM, Rosenblum K, Klann E. Removal of S6K1 and S6K2 leads to divergent alterations in learning, memory, and synaptic plasticity. Learn Mem. 2008;15:29–38. doi: 10.1101/lm.661908. - DOI - PMC - PubMed
    1. Beach TG, Sue LI, Walker DG, Roher AE, Lue L, Vedders L, Connor DJ, Sabbagh MN, Rogers J. The Sun Health Research Institute Brain Donation Program: description and experience, 1987–2007. Cell Tissue Bank. 2008;9:229–245. doi: 10.1007/s10561-008-9067-2. - DOI - PMC - PubMed
    1. Caccamo A, Majumder S, Richardson A, Strong R, Oddo S. Molecular interplay between mammalian target of rapamycin (mTOR), amyloid-beta, and tau: effects on cognitive impairments. J Biol Chem. 2010;285:13107–13120. doi: 10.1074/jbc.M110.100420. - DOI - PMC - PubMed
    1. Caccamo A, Maldonado MA, Majumder S, Medina DX, Holbein W, Magrí A, Oddo S. Naturally secreted amyloid-beta increases mammalian target of rapamycin (mTOR) activity via a PRAS40-mediated mechanism. J Biol Chem. 2011;286:8924–8932. doi: 10.1074/jbc.M110.180638. - DOI - PMC - PubMed

Publication types

MeSH terms