. 2015 Dec 4;290(49):29555-66.
doi: 10.1074/jbc.M115.678292. Epub 2015 Oct 14.

Ca2+ Influx through Store-operated Calcium Channels Replenishes the Functional Phosphatidylinositol 4,5-Bisphosphate Pool Used by Cysteinyl Leukotriene Type I Receptors

Affiliations

Ca2+ Influx through Store-operated Calcium Channels Replenishes the Functional Phosphatidylinositol 4,5-Bisphosphate Pool Used by Cysteinyl Leukotriene Type I Receptors

Abdullah Alswied et al. J Biol Chem. .

Abstract

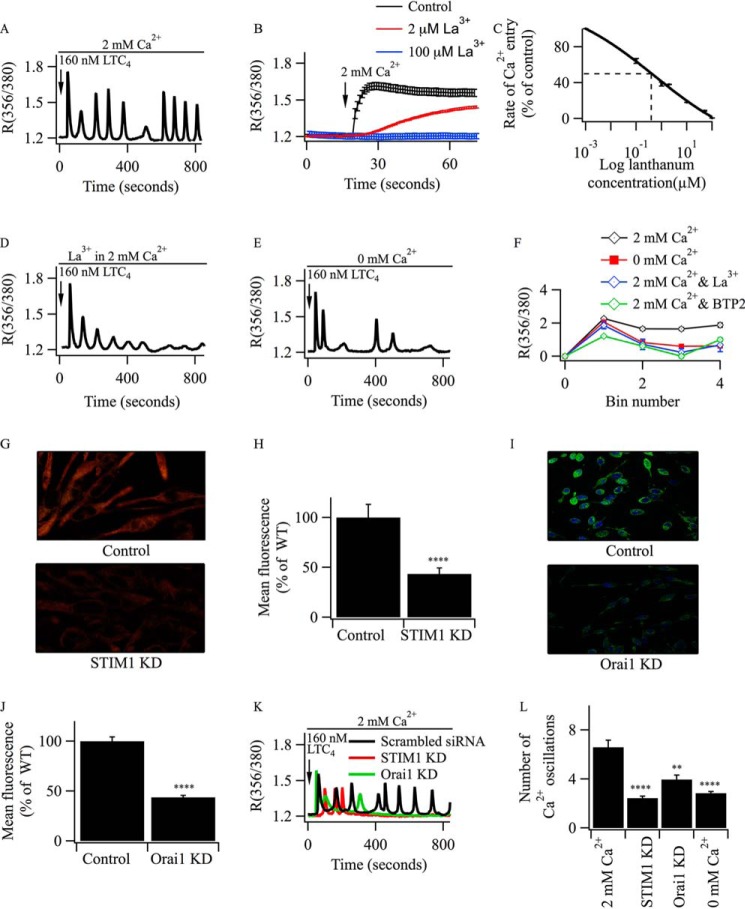
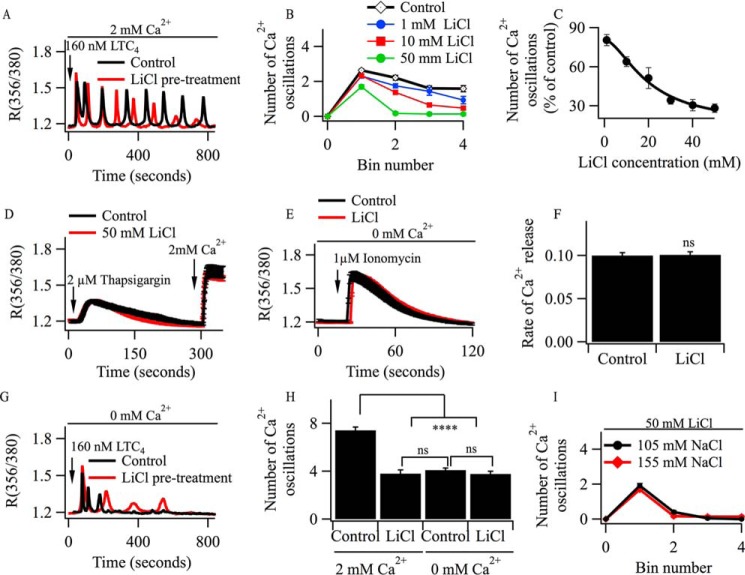
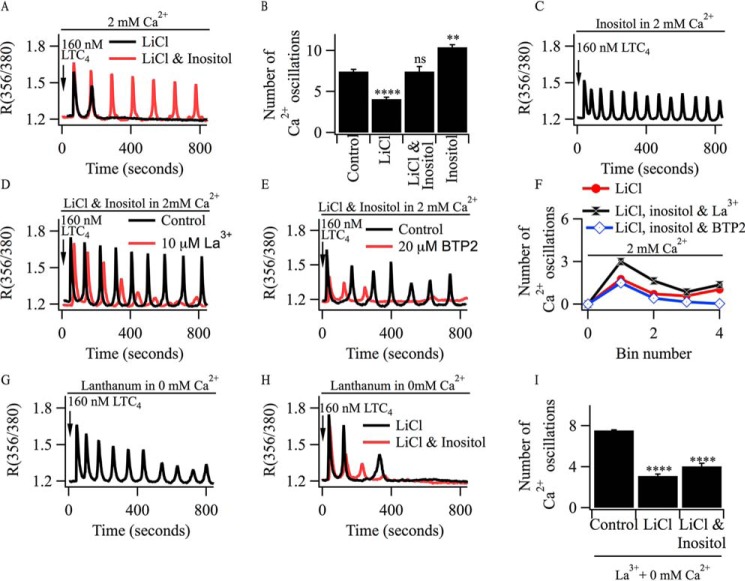
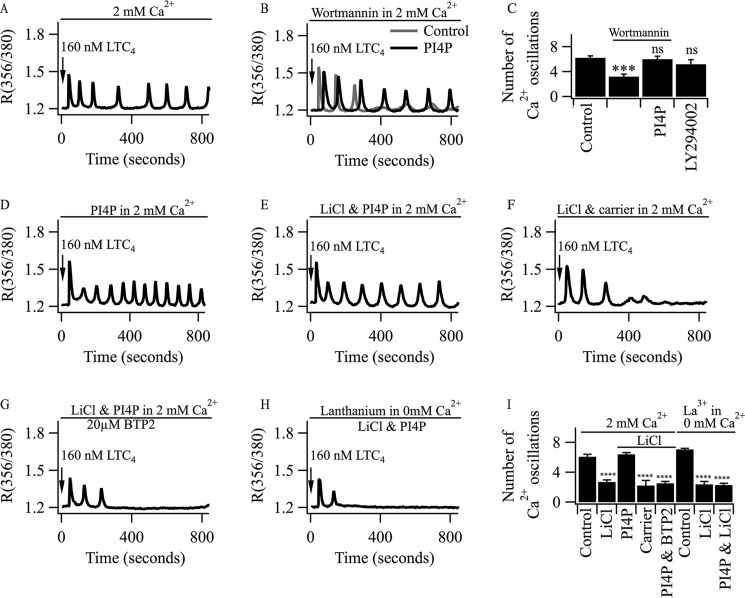
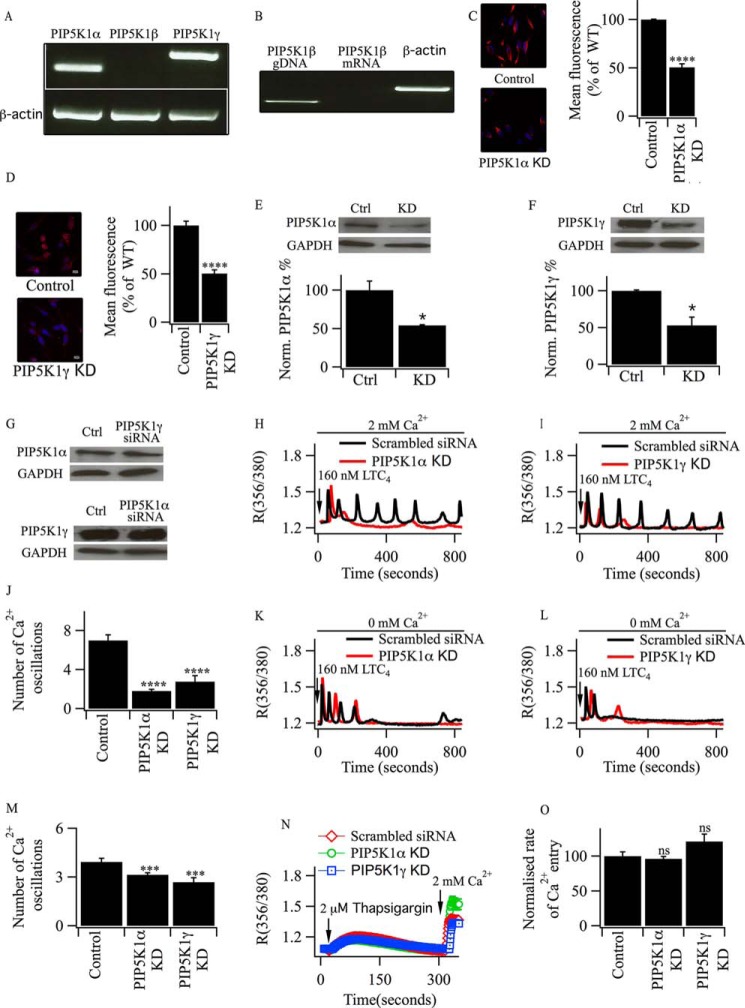
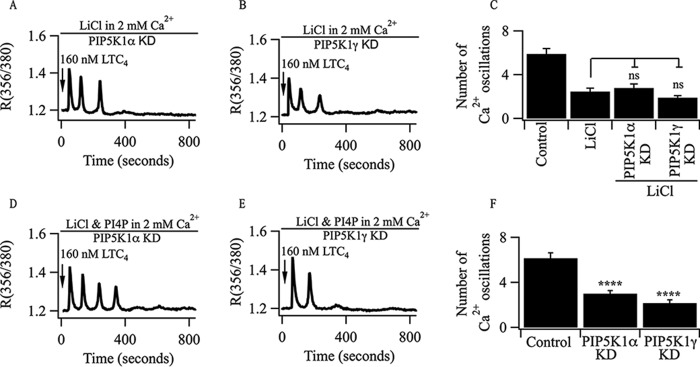
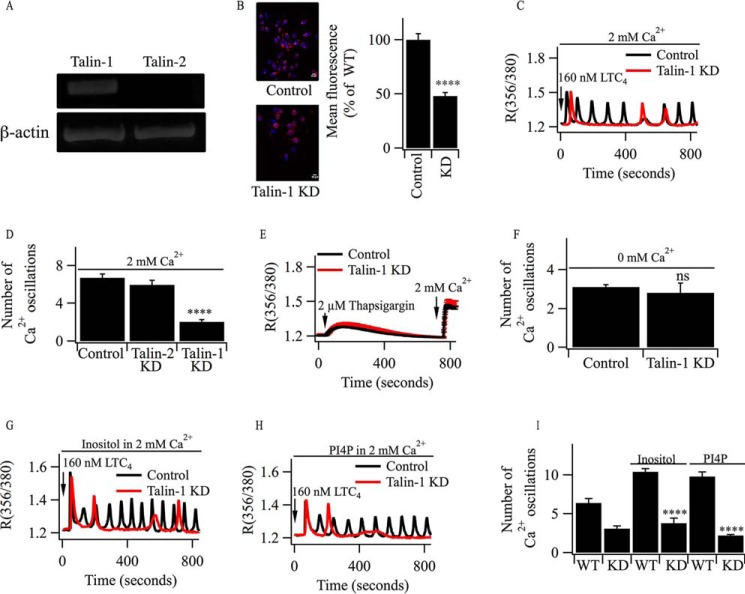
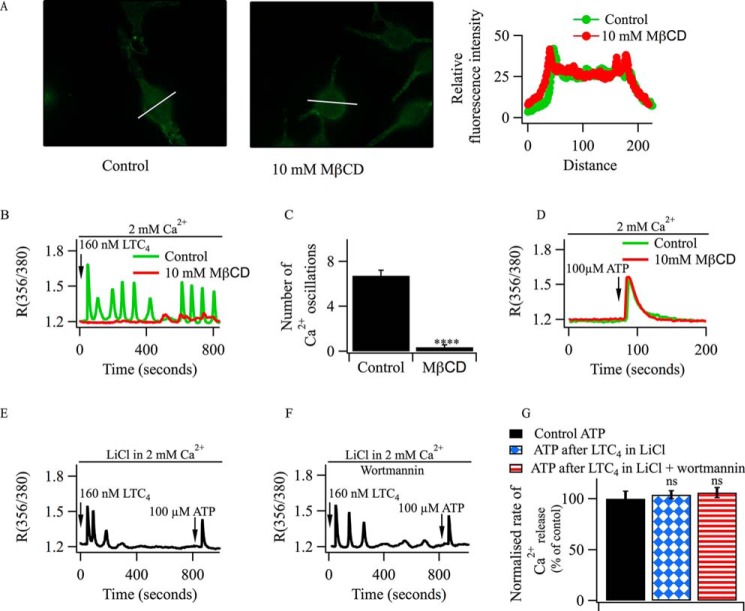
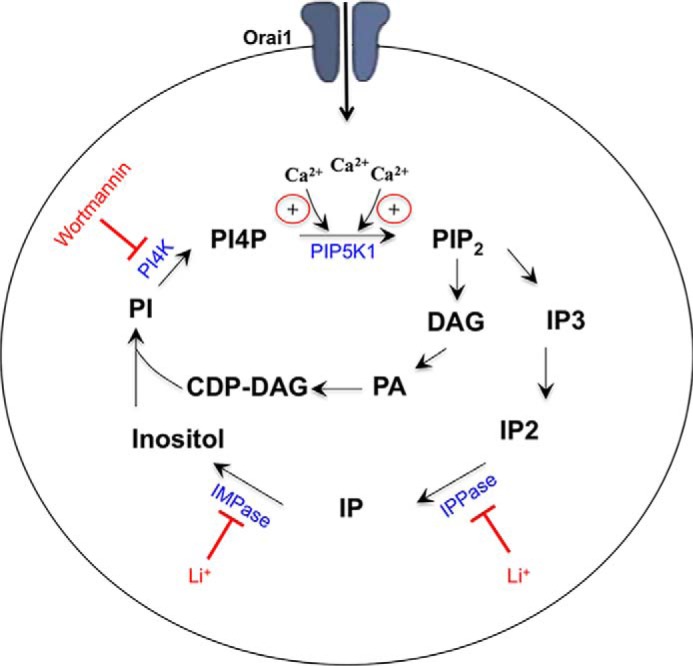
Oscillations in cytoplasmic Ca(2+) concentration are a universal mode of signaling following physiological levels of stimulation with agonists that engage the phospholipase C pathway. Sustained cytoplasmic Ca(2+) oscillations require replenishment of the membrane phospholipid phosphatidylinositol 4,5-bisphosphate (PIP2), the source of the Ca(2+)-releasing second messenger inositol trisphosphate. Here we show that cytoplasmic Ca(2+) oscillations induced by cysteinyl leukotriene type I receptor activation run down when cells are pretreated with Li(+), an inhibitor of inositol monophosphatases that prevents PIP2 resynthesis. In Li(+)-treated cells, cytoplasmic Ca(2+) signals evoked by an agonist were rescued by addition of exogenous inositol or phosphatidylinositol 4-phosphate (PI4P). Knockdown of the phosphatidylinositol 4-phosphate 5 (PIP5) kinases α and γ resulted in rapid loss of the intracellular Ca(2+) oscillations and also prevented rescue by PI4P. Knockdown of talin1, a protein that helps regulate PIP5 kinases, accelerated rundown of cytoplasmic Ca(2+) oscillations, and these could not be rescued by inositol or PI4P. In Li(+)-treated cells, recovery of the cytoplasmic Ca(2+) oscillations in the presence of inositol or PI4P was suppressed when Ca(2+) influx through store-operated Ca(2+) channels was inhibited. After rundown of the Ca(2+) signals following leukotriene receptor activation, stimulation of P2Y receptors evoked prominent inositol trisphosphate-dependent Ca(2+) release. Therefore, leukotriene and P2Y receptors utilize distinct membrane PIP2 pools. Our findings show that store-operated Ca(2+) entry is needed to sustain cytoplasmic Ca(2+) signaling following leukotriene receptor activation both by refilling the Ca(2+) stores and by helping to replenish the PIP2 pool accessible to leukotriene receptors, ostensibly through control of PIP5 kinase activity.

Keywords: calcium channel; calcium intracellular release; calcium release-activated calcium channel protein 1 (ORAI1); phosphatidylinositol kinase (PI kinase); phosphatidylinositol signaling.


Figures

FIGURE 1.
FIGURE 1.
CRAC channels maintain cytoplasmic Ca2+ oscillations in RBL-2H3 cells following leukotriene receptor stimulation. A, typical oscillatory response in [Ca2+]i to 160 nm LTC4 in the presence of external calcium. B, CRAC channel-mediated Ca2+ entry was blocked in a dose-dependent manner by pretreatment with La3+. Ca2+ influx was evoked by readmission of external Ca2+ to cells challenged with 2 μm thapsigargin in Ca2+-free solution. Only the Ca2+ influx component is shown. The x axis represents the time when Ca2+ release had returned to resting levels. La3+ was applied 3 min prior to thapsigargin exposure. C, graph summarizing the La3+ dose-inhibition curve. Each point is the mean of between 21 and 32 cells. D, oscillations in [Ca2+]i evoked by LTC4 in external Ca2+ run down in the presence of 10 μm La3+ (pretreatment for 3 min). E, typical response to LTC4 in the absence of external Ca2+. F, aggregate data (from >50 cells for each treatment) are shown from three independent experiments. Each bin represents a consecutive recording period of 200 s. For most averages, error bars (mean ± S.E.) are contained within the symbols. G, immunohistochemical staining of STIM1 in either control cells or in cells after knockdown of STIM1. An experiment with a higher than usual transfection efficiency is shown here and in I. KD, knockdown. H, semiquantitative measurements of mean florescence from two independent experiments for STIM1. ****, p < 0.0001. I, as in G, but Orai1 was measured instead. J, histogram showing aggregate data from three independent experiments (each column is the average of >50 cells). ****, p < 0.0001. K, cytoplasmic Ca2+ signals in cells stimulated with LTC4 after knockdown of STIM1 or Orai1. A scrambled siRNA control is included. L, data from three independent experiments are compared. Cells were stimulated with 160 nm LTC4. **, p < 0.01; ****, p < 0.0001.
FIGURE 2.
FIGURE 2.
Li+ blocks agonist-mediated oscillations in [Ca2+]i. A, cytoplasmic Ca2+ oscillations evoked by 160 nm LTC4 are compared between a control cell and one pre-exposed to 10 mm LiCl for ∼90 min. B, graph comparing cytoplasmic Ca2+ oscillations evoked by LTC4 between control cells and cells exposed to different concentrations of LiCl prior to stimulation. C, graph plotting the number of cytoplasmic Ca2+ oscillations evoked by LTC4 over 800 s of stimulation in the presence of different LiCl concentrations. The number of oscillations is normalized to the number of oscillations observed in control cells. Values were fitted with a Hill-type equation, yielding an IC50 value of 15 mm. D, thapsigargin-evoked Ca2+ release and Ca2+ influx are compared between control cells and cells pre-exposed to 50 mm LiCl for 90 min. Error bars (mean ± S.E.) are within the symbols. E, comparison of ionomycin-induced Ca2+ release in control cells and cells pretreated with 15 mm of LiCl for 90 min. F, data from three independent experiments as in E. ns, not significant. G, cytoplasmic Ca2+ oscillations in Ca2+-free external solution following stimulation with 160 nm LTC4 are compared between a control cell and one pretreated with 15 mm LiCl for 90 min. H, aggregate data from three experiments measuring the total number of cytoplasmic Ca2+ oscillations over an 800-s stimulation period with LTC4 are compared. Cells were stimulated either in the presence or absence of external Ca2+. The LiCl groups refer to pretreatment with 15 mm LiCl for 90 min. The data represent >52 cells from four independent experiments for each condition. ****, p < 0.0001. I, aggregate data showing the number of cytoplasmic Ca2+ oscillations evoked by LTC4 in 50 mm LiCl in an external solution containing either 155 or 105 mm NaCl, both with 2 mm Ca2+. Each bin number represents a period of 200 s. Each data point is >25 cells.
FIGURE 3.
FIGURE 3.
Inositol rescues cytoplasmic Ca2+ oscillations in LiCl-treated cells. A, oscillations in cytoplasmic [Ca2+]i evoked by LTC4 are sustained in a LiCl-treated cell when 10 mm inositol is added shortly before stimulation. B, aggregate data comparing the number of oscillations over an 800-s recording period for the conditions shown. Each column is the average of >30 cells from four independent experiments. **, p < 0.01; ****, p < 0.0001; ns, not significant. C, exposure to 10 mm inositol increases the oscillation frequency in a control cell. D and E, inositol fails to rescue oscillations in [Ca2+]i evoked by LTC4 in a LiCl-treated cell when CRAC channels are blocked with either La3+ (D) or BTP2 (E). F, aggregate data are compared for >50 cells/point. Each bin number reflects 200 s of recording. G, cytoplasmic Ca2+ oscillations are maintained over 800 s when a cell is challenged with LTC4 in Ca2+-free solution containing 1 mm La3+. H, Ca2+ oscillations run down in 0 Ca2+solution containing 1 mm La3+ following pretreatment with 15 mm LiCl, and this cannot be rescued by inositol. I, aggregate data are compared. Cells were stimulated with LTC4 in 0Ca2+ solution containing 1 mm La3+. ****, p < 0.0001.
FIGURE 4.
FIGURE 4.
Involvement of PI4P in supporting oscillations in [Ca2+]i evoked by LTC4. A, a typical control recording showing oscillations in [Ca2+]i evoked by LTC4 in the presence of external Ca2+. B, wortmannin (10 μm, 10-min pretreatment) accelerates rundown of the cytoplasmic Ca2+ oscillations. Rundown is less pronounced when PI4P (70 μm, 7-min pretreatment) is applied prior to stimulation. C, aggregate data from three independent experiments are compared. Each column represents data from >30 cells. ***, p < 0.001; ns, not significant. D, pretreatment with PI4P increases the cytoplasmic Ca2+ oscillation frequency. E, pretreatment with PI4P rescues oscillations in [Ca2+]i in a cell pre-exposed to LiCl for 105 min. F, cytoplasmic Ca2+ oscillations evoked by LTC4 are not rescued in LiCl-treated cells when the carrier for PI4P is used instead. G, PI4P fails to rescue oscillations in [Ca2+]i in Li+-treated cells in the presence of BTP2. H, PI4P has no effect on the rundown of cytoplasmic Ca2+ oscillations in Ca2+-free solution containing 1 mm La3+ in a LiCl-treated cell. I, aggregate data comparing the number of Ca2+ oscillations over an 800-s recording period for the different conditions are shown. La3+ in 0 mm Ca2+ denotes 0 Ca2+ supplemented with 1 mm La3+. ****, p < 0.0001.
FIGURE 5.
FIGURE 5.
PIP5K1 isoforms are involved in maintaining LTC4-driven cytoplasmic Ca2+ oscillations. A, RT-PCR comparing the expression of PIP5K1 isoforms in RBL-2H3 cells. B, PIP5KIβ mRNA is absent from RBL-2H3 cells despite genomic DNA (gDNA) being detectable. C and D, confocal microscopy images comparing the expression of PIPK1α and γ protein between control cells and those in which either PIP5K1α (C) or PIP5K1γ (D) had been knocked down (KD). The corresponding histograms summarize data from >40 cells in each group. ****, p < 0.0001. E, Western blot comparing the expression of PIP5K1α in control (Ctrl) cells and after siRNA-directed knockdown. *, p < 0.05. F, Western blot comparing the expression of PIP5K1γ in control cells and after siRNA-directed knockdown. *, p < 0.05. G, Western blot comparing the expression of PIP5K1α after knockdown of PIP5Kγ (top panel) and vice versa (bottom panel). H and I, cytoplasmic Ca2+ oscillations evoked by LTC4 run down quickly after knockdown of PIP5K1α (H) or PIP5K1γ (I). Scrambled siRNA controls are included. J, histogram comparing the total number of cytoplasmic Ca2+ oscillations evoked by LTC4 in 2 mm external Ca2+ over 800 s of stimulation from three independent experiments. ****, p < 0.0001. K and L, the effect of knockdown of PIP5K1α (K) or PIP5K1γ (L) on responses evoked by LTC4 in Ca2+-free solution. M, histogram comparing the average number of Ca2+ oscillations in Ca2+-free solution for the conditions shown. ***, p < 0.001. N, Ca2+ release and Ca2+ influx evoked by thapsigargin are compared following knockdown of PIP5K1α and PIP5K1γ or after transfection with scrambled siRNA. O, the rates of Ca2+ entry following stimulation with thapsigargin as in K are compared for the conditions shown. ns, not significant.
FIGURE 6.
FIGURE 6.
PI4P fails to rescue oscillations in [Ca2+]i evoked by LTC4 following knockdown of PIP5K1α or PIP5K1γ in LiCl-treated cells. A and B, typical transient oscillations in [Ca2+]i evoked by LTC4 following knockdown (KD) of either PIP5K1α (A) or PIP5K1γ (B). C, aggregate data are summarized. ns, not significant. D and E, PI4P (70 μm) fails to rescue the cytoplasmic Ca2+ oscillations evoked by LTC4 in either PIP5K1α- (D) or PIP5K1γ-deficient (E) cells pre-treated with LiCl. F, aggregate data for the conditions shown are summarized. Each column represents results from >19 cells. ****, p < 0.0001.
FIGURE 7.
FIGURE 7.
Knockdown of talin1 accelerates the rundown of oscillations in [Ca2+]i evoked by LTC4. A, RT-PCR reveals the presence of talin1 but not talin2 in RBL-2H3 cells. B, immunocytochemical detection of talin1 in control cells and after knockdown (KD). The histogram summarizes data from between 40 and 52 cells for each condition. ****, p < 0.0001. C, cytoplasmic Ca2+ oscillations evoked by LTC4 run down more quickly after talin1 knockdown. D, aggregate data from several experiments are summarized. Each column represents data from between 24 and 32 cells. E, thapsigargin-evoked cytoplasmic Ca2+ signals are unaffected by talin1 knockdown. F, the total number of cytoplasmic Ca2+ oscillations evoked by LTC4 in Ca2+-free solution are similar in control cells and those in which talin1 had been knocked down. ns, not significant. G, oscillations in [Ca2+]i evoked by LTC4 in talin1-deficient cells are not rescued by addition of inositol. Control refers to a wild-type cell stimulated with LTC4 in the presence of inositol. H, PI4P fails to rescue cytoplasmic Ca2+ oscillations in cells following knockdown of talin1. I, aggregate data from several independent experiments are compared. ****, p < 0.0001 compared with the corresponding controls. LTC4 was used to stimulate the cells. KD, knockdown of talin1.
FIGURE 8.
FIGURE 8.
Non-overlap of PIP2 pools in RBL-2H3 cells. A, confocal microscopic images compare the distribution of FLAG-tagged CysLT1 receptors following stimulation with 160 nm LTC4 in control cells and in cells pretreated with 10 mm MβCD for 30 min. The fluorescence profiles from the line scans are shown in the corresponding graph. B, the typical oscillatory Ca2+ signal induced by LTC4 in a control cell is lost following treatment with MβCD. C, aggregate data analyzing the number of oscillations from three independent experiments (34 cells for each condition). ****, p < 0.0001. D, the Ca2+ response induced by ATP is unaffected by the presence of MβCD (10 mm, 30 min pretreatment). E, after cytoplasmic Ca2+ oscillations evoked by LTC4 had run down in a cell pretreated with 15 mm LiCl for 90 min, application of ATP elicited prominent Ca2+ release. F, ATP application evoked Ca2+ release after the oscillatory response to LTC4 had run down in the presence of 10 μm wortmannin and LiCl. G, aggregate data from three independent experiments (between 26 and 30 cells/column) are compared. When LiCl (15 mm) was present, it was preincubated for 90 min prior to challenge with LTC4. ns, not significant.
FIGURE 9.
FIGURE 9.
Schematic summarizing how calcium influx affects the PIP2 pathway. Both inositol polyphosphatase (IPPase) and IMPase are targets of Li+. CDP-DAG, cytidine diphosphate-diacylglycerol; DAG, diacylglycerol; PA, phosphatidic acid; IP, inositol phosphate.

References

    1. Berridge M. J., Bootman M. D., and Roderick H. L. (2003) Calcium signalling: dynamics, homeostasis and remodelling. Nat. Rev. Mol. Cell Biol. 4, 517–529 - PubMed
    1. Clapham D. E. (2007) Calcium signaling. Cell 131, 1047–1058 - PubMed
    1. Parekh A. B. (2011) Decoding cytosolic Ca2+ oscillations. TiBS 36, 78–87 - PubMed
    1. Berridge M. J. (1993) Inositol trisphosphate and calcium signalling. Nature 361, 315–325 - PubMed
    1. Thomas A. P., Bird G. S., Hajnóczky G., Robb-Gaspers L. D., and Putney J. W. Jr. (1996) Spatial and temporal aspects of cellular calcium signalling. FASEB J. 10, 1505–1517 - PubMed

Publication types