Comparative Study
. 2015 Dec;53(12):3842-52.
doi: 10.1128/JCM.02145-15. Epub 2015 Oct 14.

Sequence Variation in Amplification Target Genes and Standards Influences Interlaboratory Comparison of BK Virus DNA Load Measurement

Collaborators, Affiliations
Comparative Study

Sequence Variation in Amplification Target Genes and Standards Influences Interlaboratory Comparison of BK Virus DNA Load Measurement

Morgane Solis et al. J Clin Microbiol. 2015 Dec.

Abstract

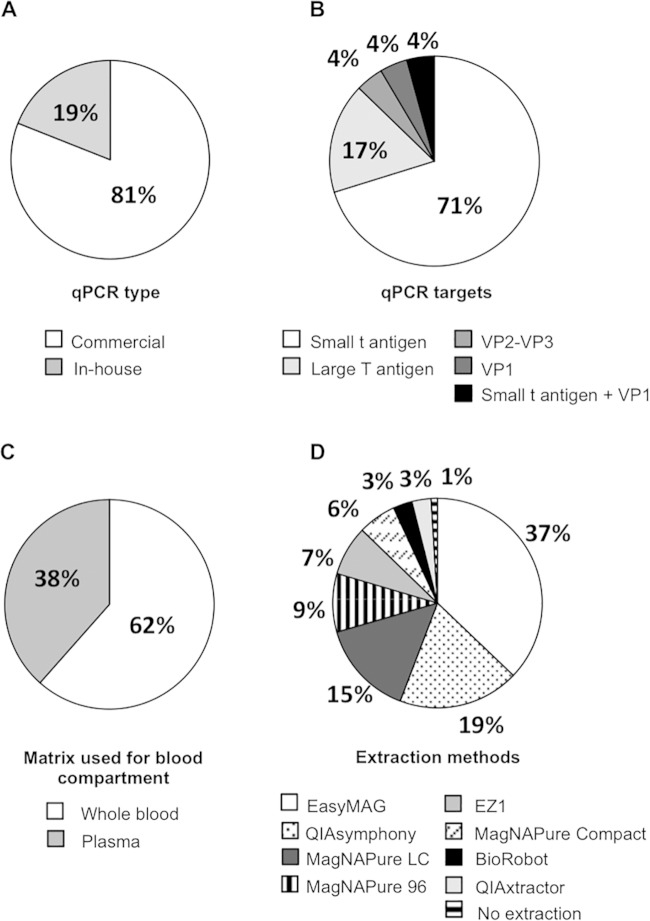
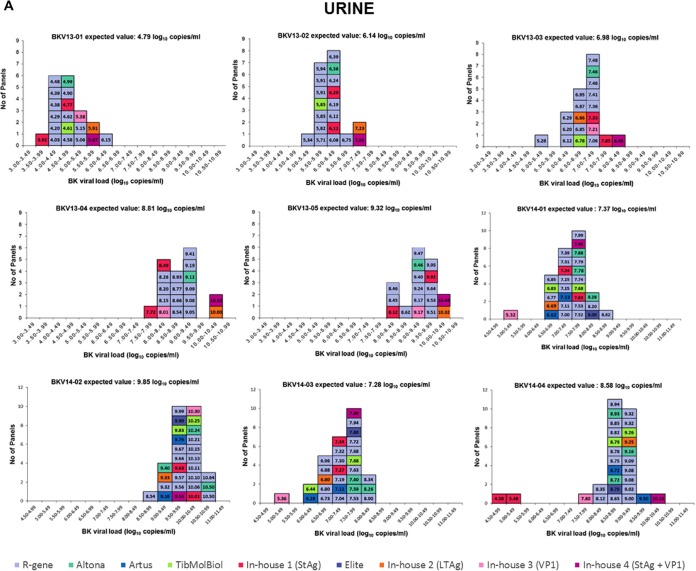
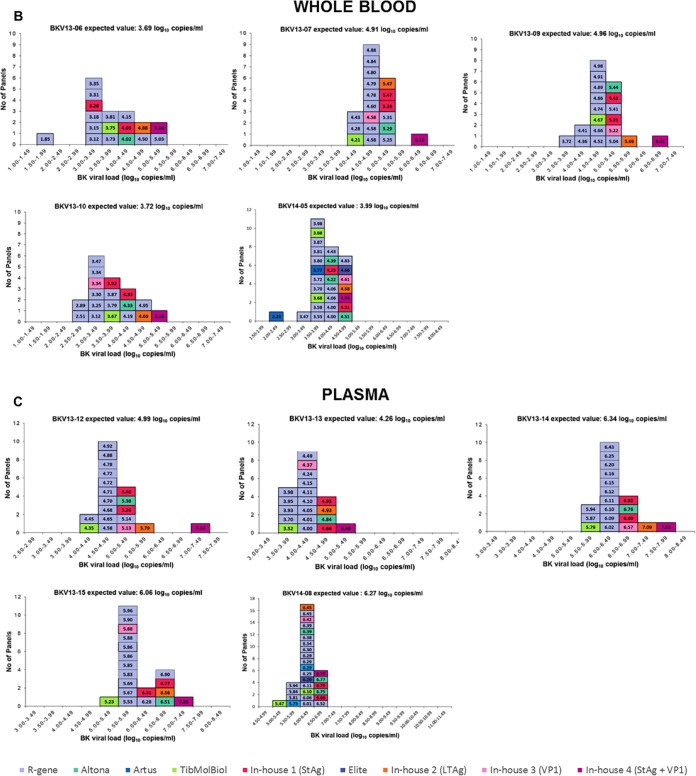
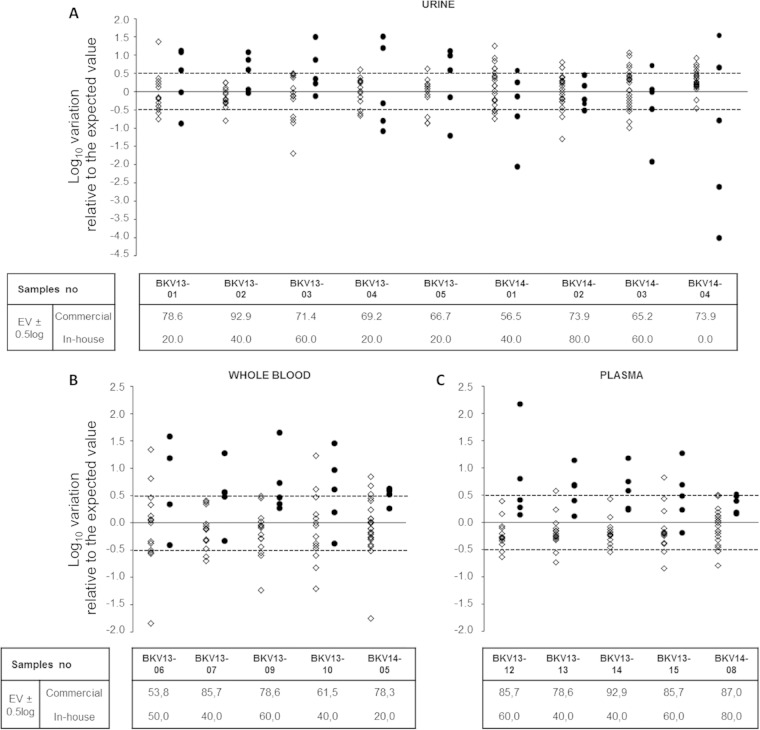
International guidelines define a BK virus (BKV) load of ≥4 log10 copies/ml as presumptive of BKV-associated nephropathy (BKVN) and a cutoff for therapeutic intervention. To investigate whether BKV DNA loads (BKVL) are comparable between laboratories, 2 panels of 15 and 8 clinical specimens (urine, whole blood, and plasma) harboring different BKV genotypes were distributed to 20 and 27 French hospital centers in 2013 and 2014, respectively. Although 68% of the reported results fell within the acceptable range of the expected result ±0.5 log10, the interlaboratory variation ranged from 1.32 to 5.55 log10. Polymorphisms specific to BKV genotypes II and IV, namely, the number and position of mutations in amplification target genes and/or deletion in standards, arose as major sources of interlaboratory disagreements. The diversity of DNA purification methods also contributed to the interlaboratory variability, in particular for urine samples. Our data strongly suggest that (i) commercial external quality controls for BKVL assessment should include all major BKV genotypes to allow a correct evaluation of BKV assays, and (ii) the BKV sequence of commercial standards should be provided to users to verify the absence of mismatches with the primers and probes of their BKV assays. Finally, the optimization of primer and probe design and standardization of DNA extraction methods may substantially decrease interlaboratory variability and allow interinstitutional studies to define a universal cutoff for presumptive BKVN and, ultimately, ensure adequate patient care.


Figures

FIG 1
FIG 1
Diversity of diagnostic conditions among the participants. Participating laboratories were asked to describe the type (A) and target (B) of the qPCR assay routinely used for BK viral load quantification, the matrix routinely tested in the blood compartment (C), and the extraction methods used for DNA purification (D). For laboratories using different extraction methods for urine and blood samples, both techniques were considered in our analysis. The percentages of participants are indicated for each pie chart.
FIG 2
FIG 2
Histograms of reported quantitative values for the positive samples from both panels. BK viral loads are represented in 0.5-log10 copies/ml intervals. Each rectangle refers to the result of one data set. Each color represents a different technique. The results obtained using commercial techniques are shown in blue and green, whereas results from in-house methods are colored in orange, red, and purple. The expected value is determined for each sample by calculating the geometric mean of all reported data set values. Results were obtained for urine (A), whole-blood (B), and plasma (C) specimens.
FIG 2
FIG 2
Histograms of reported quantitative values for the positive samples from both panels. BK viral loads are represented in 0.5-log10 copies/ml intervals. Each rectangle refers to the result of one data set. Each color represents a different technique. The results obtained using commercial techniques are shown in blue and green, whereas results from in-house methods are colored in orange, red, and purple. The expected value is determined for each sample by calculating the geometric mean of all reported data set values. Results were obtained for urine (A), whole-blood (B), and plasma (C) specimens.
FIG 3
FIG 3
Comparison of reported results using in-house and commercial assays. The log10 variation in the reported results relative to the expected value (EV) was calculated for each positive sample of the panel. The results for commercial and in-house assays are depicted by open diamonds and filled circles, respectively. The dashed lines indicate a difference of ±0.5 log10 relative to the EV. The tables specify the percentages of results in the interval EV ± 0.5 log10 for commercial and in-house assays. Results were obtained for urine (A), whole-blood (B), and plasma (C) specimens.
FIG 4
FIG 4
Distribution of the standard deviations according to the expected BKVL. Standard deviations (SD) are represented by black diamonds for urine samples, gray triangles for plasma samples, and open circles for the whole-blood samples. The SD ranged from 0.33 to 1.07 log10 copies/ml. No difference in variability was found across the analytical measuring range. The variability of BKVL in the 3 matrices (urine, WB, and plasma) was not statistically different (P = 0.08, Kruskal-Wallis test). The greatest SD (>1 log10) was observed for the BKV genotype II sample.

References

    1. Borni-Duval C, Caillard S, Olagne J, Perrin P, Braun-Parvez L, Heibel F, Moulin B. 2013. Risk factors for BK virus infection in the era of therapeutic drug monitoring. Transplantation 95:1498–1505. doi:10.1097/TP.0b013e3182921995. - DOI - PubMed
    1. Hirsch HH, Knowles W, Dickenmann M, Passweg J, Klimkait T, Mihatsch MJ, Steiger J. 2002. Prospective study of polyomavirus type BK replication and nephropathy in renal-transplant recipients. N Engl J Med 347:488–496. doi:10.1056/NEJMoa020439. - DOI - PubMed
    1. Hirsch HH, Vincenti F, Friman S, Tuncer M, Citterio F, Wiecek A, Scheuermann EH, Klinger M, Russ G, Pescovitz MD, Prestele H. 2013. Polyomavirus BK replication in de novo kidney transplant patients receiving tacrolimus or cyclosporine: a prospective, randomized, multicenter study. Am J Transplant 13:136–145. doi:10.1111/j.1600-6143.2012.04320.x. - DOI - PMC - PubMed
    1. Kuypers DR. 2012. Management of polyomavirus-associated nephropathy in renal transplant recipients. Nat Rev Nephrol 8:390–402. doi:10.1038/nrneph.2012.64. - DOI - PubMed
    1. Drachenberg RC, Drachenberg CB, PapadimitriouC J, Ramos E, Fink JC, Wali R, Weir MR, Cangro CB, Klassen DK, Khaled A, Cunningham R, Bartlett ST. 2001. Morphological spectrum of polyoma virus disease in renal allografts: diagnostic accuracy of urine cytology. Am J Transplant 1:373–381. doi:10.1034/j.1600-6143.2001.10414.x. - DOI - PubMed

Publication types