. 2015 Oct 14;90(1):575-85.
doi: 10.1128/JVI.01539-15. Print 2016 Jan 1.

pH-Dependent Formation and Disintegration of the Influenza A Virus Protein Scaffold To Provide Tension for Membrane Fusion

Affiliations

pH-Dependent Formation and Disintegration of the Influenza A Virus Protein Scaffold To Provide Tension for Membrane Fusion

O V Batishchev et al. J Virol. .

Abstract

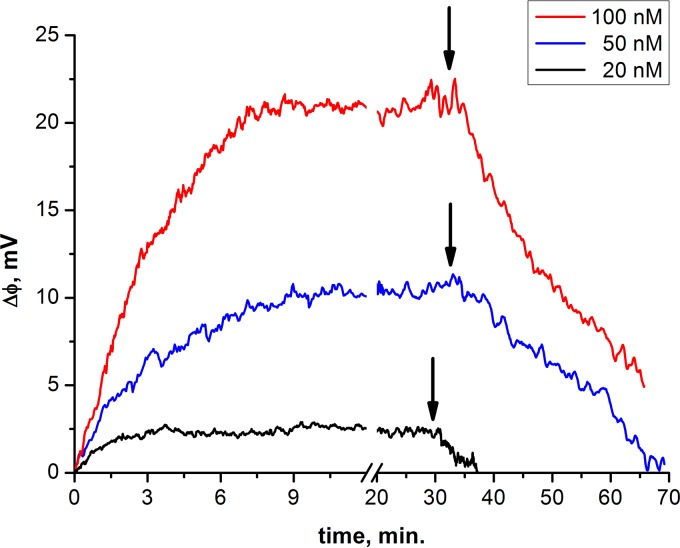
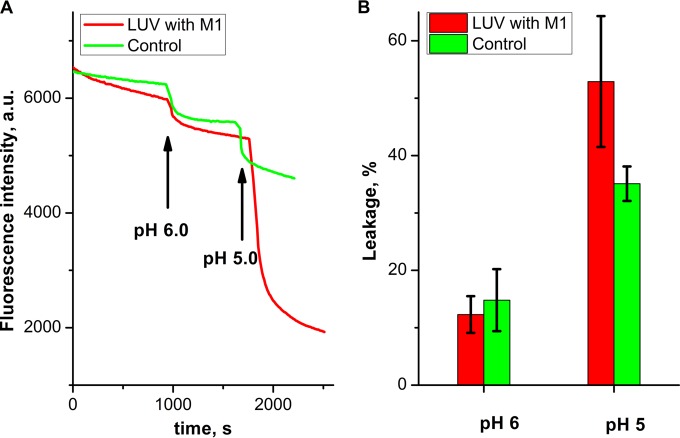
Influenza virus is taken up from a pH-neutral extracellular milieu into an endosome, whose contents then acidify, causing changes in the viral matrix protein (M1) that coats the inner monolayer of the viral lipid envelope. At a pH of ~6, M1 interacts with the viral ribonucleoprotein (RNP) in a putative priming stage; at this stage, the interactions of the M1 scaffold coating the lipid envelope are intact. The M1 coat disintegrates as acidification continues to a pH of ~5 to clear a physical path for the viral genome to transit from the viral interior to the cytoplasm. Here we investigated the physicochemical mechanism of M1's pH-dependent disintegration. In neutral media, the adsorption of M1 protein on the lipid bilayer was electrostatic in nature and reversible. The energy of the interaction of M1 molecules with each other in M1 dimers was about 10 times as weak as that of the interaction of M1 molecules with the lipid bilayer. Acidification drives conformational changes in M1 molecules due to changes in the M1 charge, leading to alterations in their electrostatic interactions. Dropping the pH from 7.1 to 6.0 did not disturb the M1 layer; dropping it lower partially desorbed M1 because of increased repulsion between M1 monomers still stuck to the membrane. Lipid vesicles coated with M1 demonstrated pH-dependent rupture of the vesicle membrane, presumably because of the tension generated by this repulsive force. Thus, the disruption of the vesicles coincident with M1 protein scaffold disintegration at pH 5 likely stretches the lipid membrane to the point of rupture, promoting fusion pore widening for RNP release.

Importance: Influenza remains a top killer of human beings throughout the world, in part because of the influenza virus's rapid binding to cells and its uptake into compartments hidden from the immune system. To attack the influenza virus during this time of hiding, we need to understand the physical forces that allow the internalized virus to infect the cell. In particular, we need to know how the protective coat of protein inside the viral surface reacts to the changes in acid that come soon after internalization. We found that acid makes the molecules of the protein coat push each other while they are still stuck to the virus, so that they would like to rip the membrane apart. This ripping force is known to promote membrane fusion, the process by which infection actually occurs.


Figures

FIG 1
FIG 1
SDS-PAGE of M1 protein sample. LWM, low-weight markers. The values to the left are molecular weights in thousands.
FIG 2
FIG 2
Kinetics of change in boundary PD after addition of M1 protein from one side of the BLM. Time zero is the moment of protein addition. Arrows indicate the start of buffer perfusion. The membrane has a DPhPS/DPhPC ratio of 3:7.
FIG 3
FIG 3
Adsorption isotherm of M1 protein on the lipid bilayer surface. Each point corresponds to a stationary level for the given concentration, averaged over three to five independent series of experiments. The dashed line is a fit of the experimental data by equation 3, with the following parameters: Δφm = 14.2 ± 1.3 mV, K1 = (2.6 ± 0.4) × 107 M−1, K2 = (3.7 ± 0.3) × 106 M−1, and R2 = 0.998. The inset shows the kinetics of the PD change from 100 nM protein added in one (red) or two (blue) steps. The arrow indicates the moment of the second addition of protein.
FIG 4
FIG 4
Adsorption isotherm of M1 protein on the lipid bilayer surface in Langmuir rectifying coordinates. The blue line is the Langmuir fit of all of the data points, the red line is the fit of the first adsorbed layer of protein (according to the BET adsorption isotherm), and the green line is the fit of the second layer (according to the BET adsorption isotherm).
FIG 5
FIG 5
AFM topography images of M1 adsorbed at pH 7.1 to supported BLMs (A to C) and mica (D to F) at the following bulk concentrations: A and D, 10 nM; B and E, 50 nM; C and F, 70 nM. The full z-axis scale is 5 nm for panels A and D to F and 10 nm for panels B and C. The bright spots in panels B and C are protein aggregates. The working buffer was 100 mM KCl–50 mM MES. The inset in panel C is a 300-by-300-nm2 enlargement of the image. The full z-axis scale of the inset is 5 nm.
FIG 6
FIG 6
AFM topography image of M1 adsorbed at pH 7.1 to freshly cleaved mica at a bulk concentration of 250 nM. The full z-axis scale is 10 nm. The bright spots are protein aggregates. The inset is an enlargement of the area in the white square at the upper left. The full z-axis scale of the inset is 5 nm.
FIG 7
FIG 7
AFM topography images of M1 adsorbed at pH 7.1 to mica at bulk concentrations corresponding to the formation of a second adsorbed layer. Panels: A, 150 nM; B, 200 nM; C, 300 nM. The full z-axis scale is 25 nm in panel A, 10 nm in panel B, and 5 nm in panel C. The bright spots in panel A are protein aggregates in the second layer. Panel B shows the formation of an unstructured second protein layer. In panel C, only the structured second layer is shown.
FIG 8
FIG 8
Surface coverage of M1 protein measured by AFM (green bars) (error bars, SD; n = 5) compared with Δφm-normalized PD values (red bars) (error bars, SD; n = 5).
FIG 9
FIG 9
Dependency of M1 adsorption density on the percentage of DOPS (from 10 to 30%) in supported lipid bilayers measured by AFM. The bulk concentration of M1 is 70 nM. Every column is an average of five individual topography images.
FIG 10
FIG 10
AFM topography image of the protein layer adsorbed at an M1 bulk concentration of 100 nM with a removed square patch of the protein layer with dimensions of 0.7 by 0.7 μm2. The full z-axis scale is 10 nm.
FIG 11
FIG 11
AFM topography images of M1 protein layer structures on supported BLMs (A to C) and mica (D to F). (A, D) Changes in M1 layer structure upon a pH drop from 7.1 to 5.0 or pH transitions from 7.1 to 6.0 to 5.0. The bright spots are protein aggregates. (B, E) M1 initially adsorbed at pH 6.0. (C, F) M1 initially adsorbed at pH 5.0. The protein bulk concentration was 70 nM. The working buffer was 100 mM KCl–50 mM MES. The full z-axis scale is 10 nm in panels A to D and 5 nm in panels E and F.
FIG 12
FIG 12
AFM topography image of M1 protein layer structure on mica after adsorption at pH 7.1 at a concentration of 300 nM and incubation at pH 6.0 for 1 h.
FIG 13
FIG 13
pH-induced leakage of LUVs loaded with the Tb3+-DPA complex with EDTA in the outer buffer. Adsorption of 75 nM M1 to LUVs was allowed for 15 min prior to acidification. (A) Kinetics of fluorescence intensity change in LUVs with M1 (red curve) and protein-free liposomes (green curve) upon stepwise pH drops. Arrows indicate the moments when pH changes occurred. a.u., arbitrary units. (B) LUV leakage after a change in pH. Error bars show the SD of the data; n = 4 for control experiments, and n = 6 for LUVs with M1.

References

    1. Lamb RA, Krug RM. 2001. Orthomyxoviridae: the viruses and their replication, p 1487–1532. In Knipe DM, Howley PM, Griffin DE, Lamb RA, Martin MA, Roizman B, Straus SE (ed), Fields virology, 4th ed Lippincott Williams & Wilkins, Philadelphia, PA.
    1. Lamb RA, Choppin PW. 1983. The structure and replication of influenza virus. Annu Rev Biochem 52:467–506. doi:10.1146/annurev.bi.52.070183.002343. - DOI - PubMed
    1. Sun X, Whittaker GR. 2006. Entry of influenza virus, p 72–82. In Poehlmann S, Simmons G (ed), Viral entry into host cells. Springer Science & Business Media, LLC, New York, NY.
    1. Lakadamyali M, Rust MJ, Babcock HP, Zhuang X. 2003. Visualizing infection of individual influenza viruses. Proc Natl Acad Sci U S A 100:9280–9285. doi:10.1073/pnas.0832269100. - DOI - PMC - PubMed
    1. Stauffer S, Feng Y, Nebioglu F, Heilig R, Picotti P, Helenius A. 2014. Stepwise priming by acidic pH and a high K+ concentration is required for efficient uncoating of influenza A virus cores after penetration. J Virol 88:13029–13046. doi:10.1128/JVI.01430-14. - DOI - PMC - PubMed

Publication types

LinkOut - more resources