. 2015 Oct 15:5:15037.
doi: 10.1038/srep15037.

A novel immunofluorescent assay to investigate oxidative phosphorylation deficiency in mitochondrial myopathy: understanding mechanisms and improving diagnosis

Affiliations

A novel immunofluorescent assay to investigate oxidative phosphorylation deficiency in mitochondrial myopathy: understanding mechanisms and improving diagnosis

Mariana C Rocha et al. Sci Rep. .

Abstract

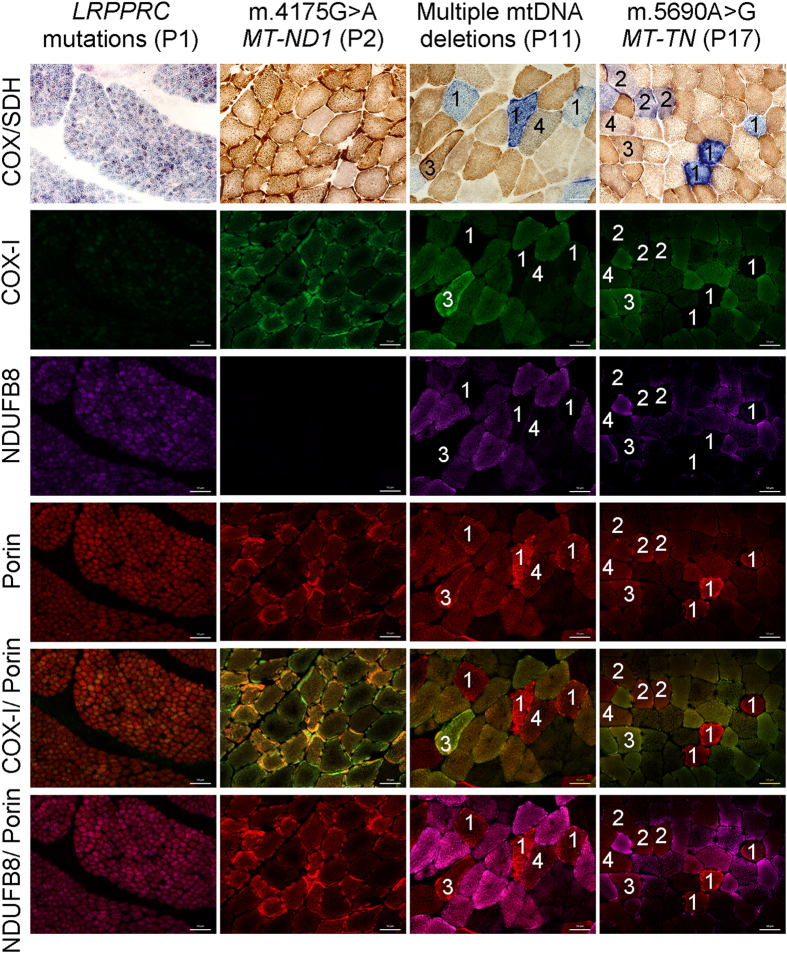
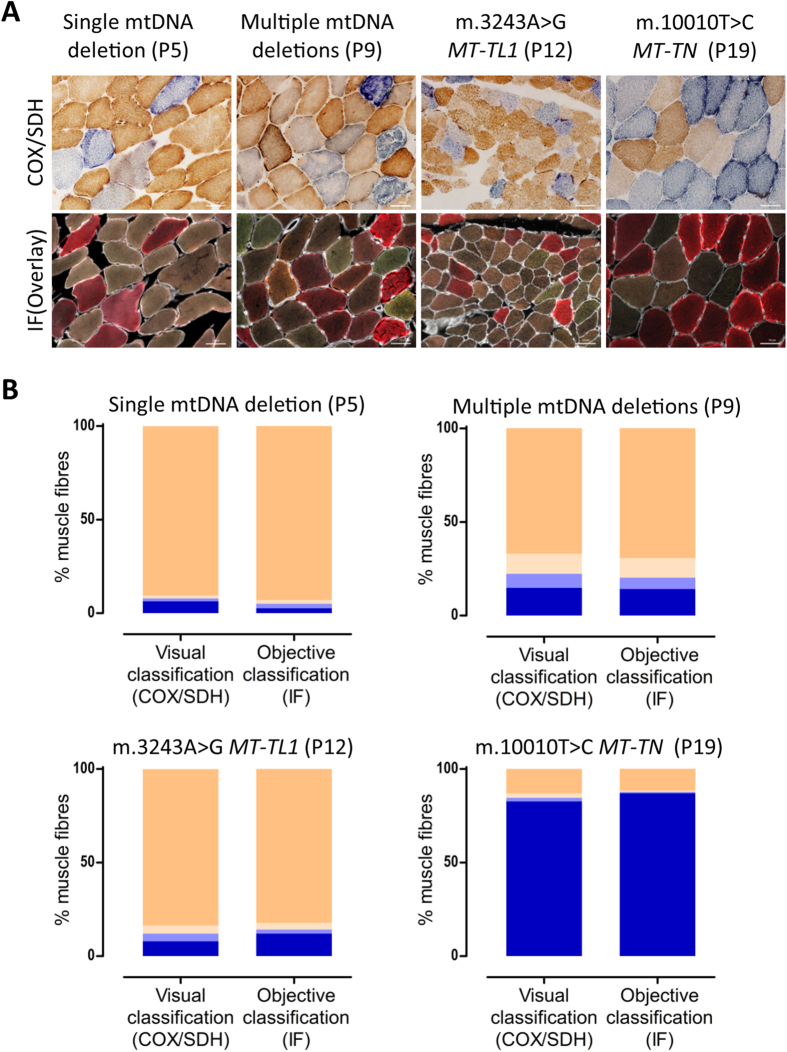
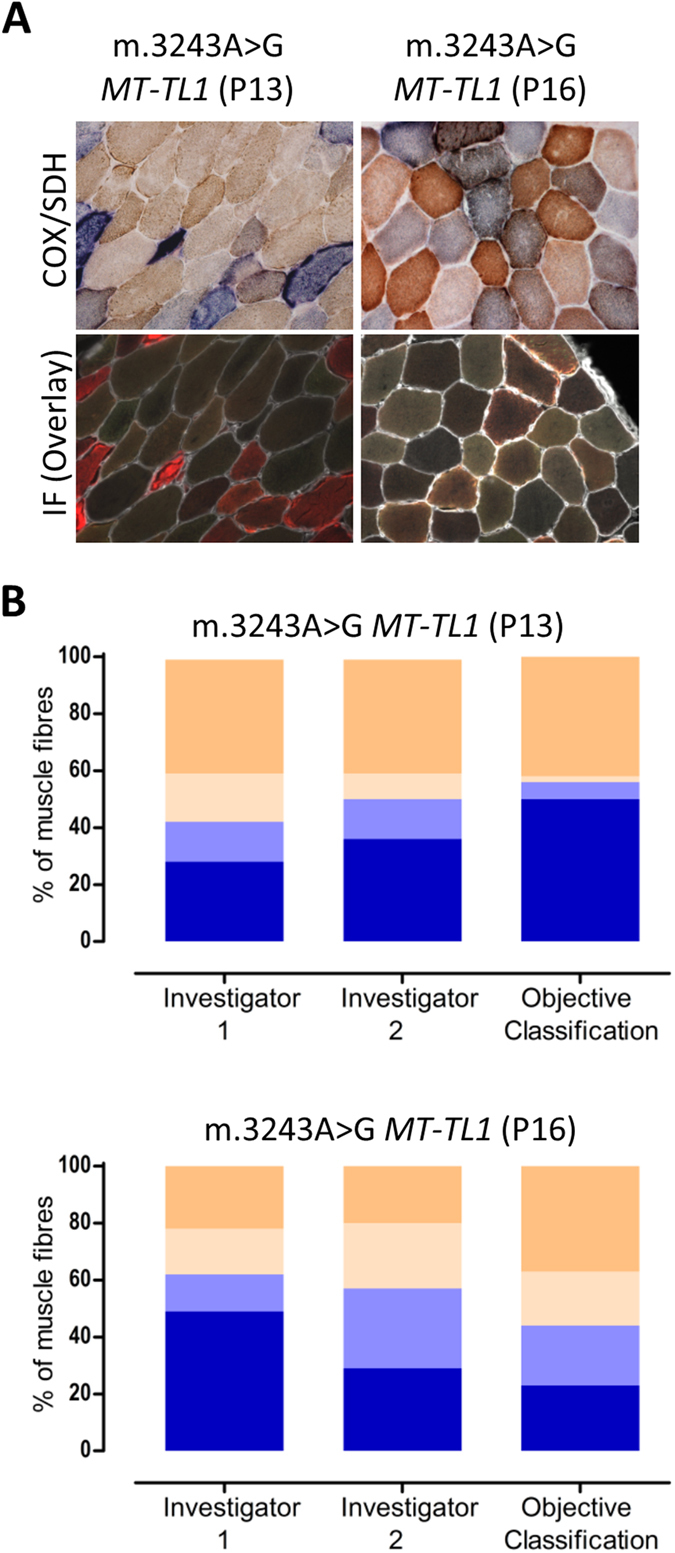
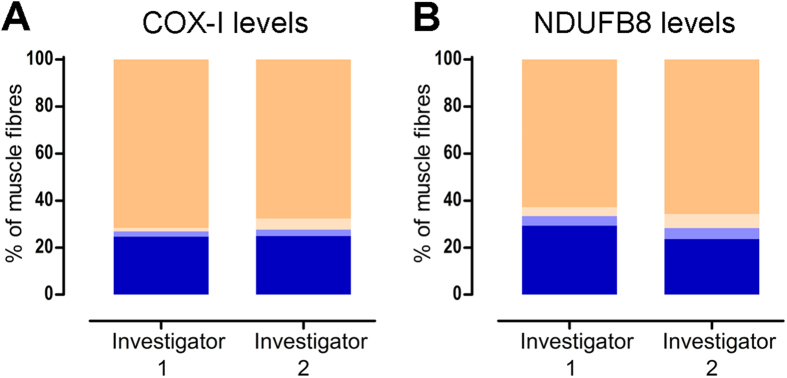
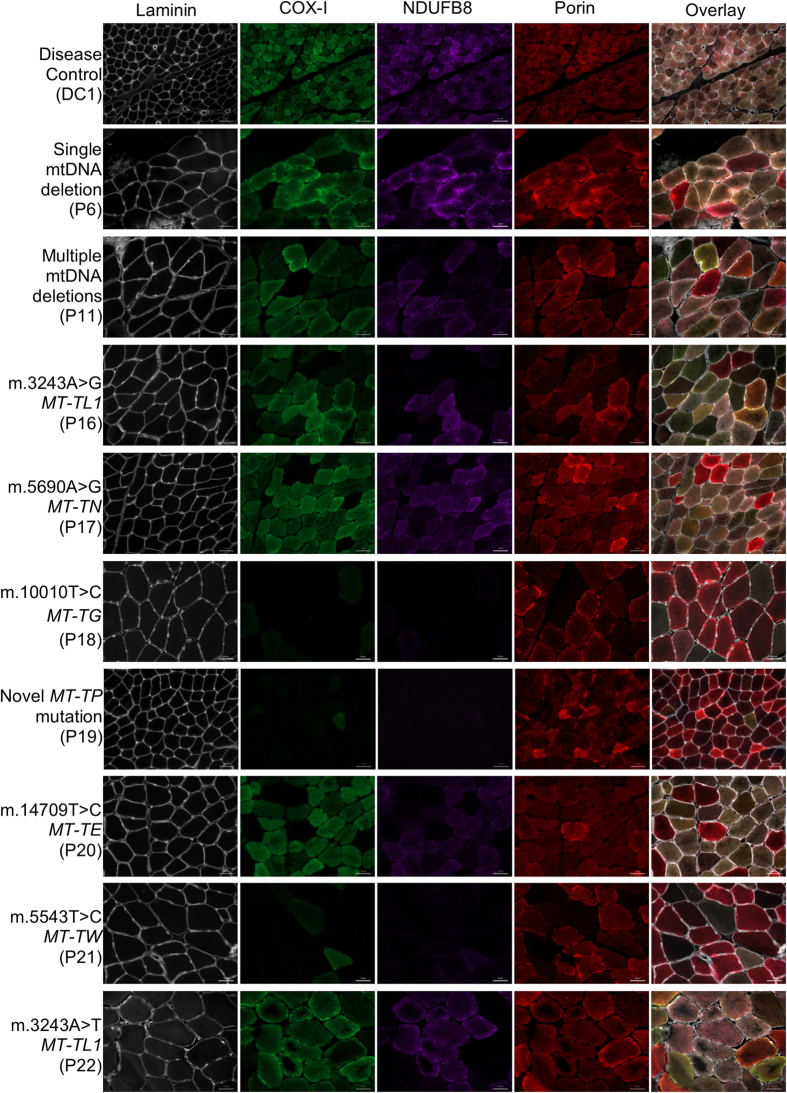
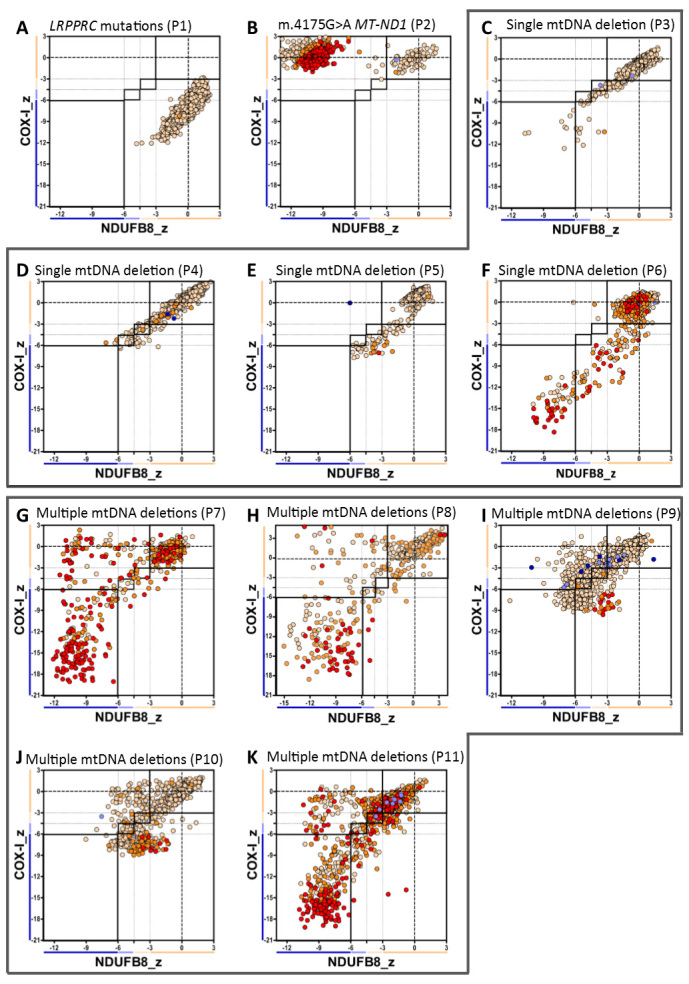
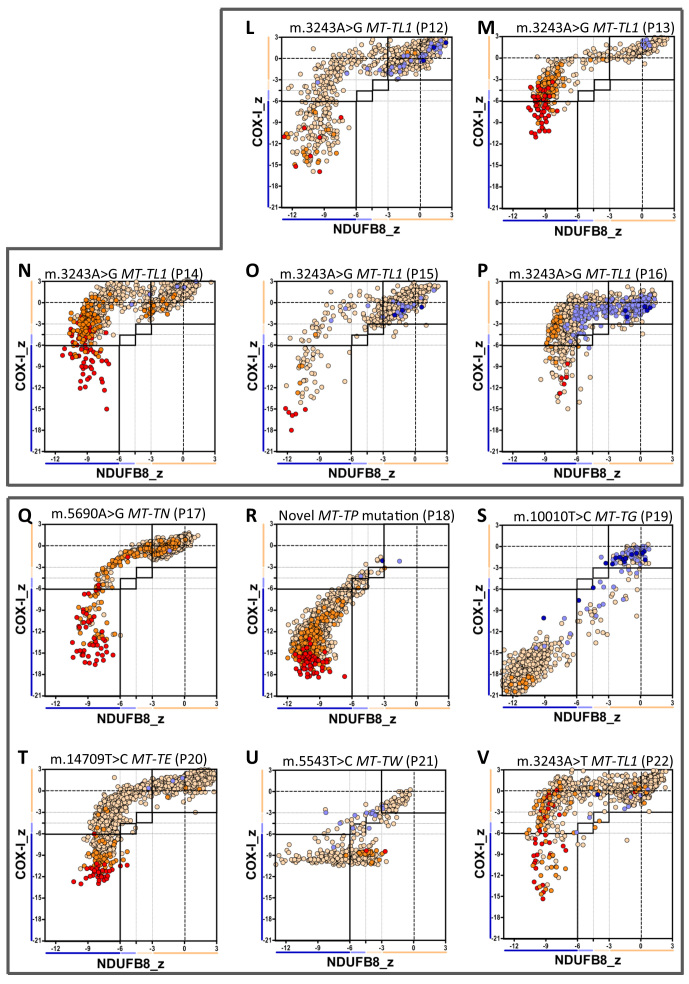
Oxidative phosphorylation defects in human tissues are often challenging to quantify due to a mosaic pattern of deficiency. Biochemical assays are difficult to interpret due to the varying enzyme deficiency levels found in individual cells. Histochemical analysis allows semi-quantitative assessment of complex II and complex IV activities, but there is no validated histochemical assay to assess complex I activity which is frequently affected in mitochondrial pathology. To help improve the diagnosis of mitochondrial disease and to study the mechanisms underlying mitochondrial abnormalities in disease, we have developed a quadruple immunofluorescent technique enabling the quantification of key respiratory chain subunits of complexes I and IV, together with an indicator of mitochondrial mass and a cell membrane marker. This assay gives precise and objective quantification of protein abundance in large numbers of individual muscle fibres. By assessing muscle biopsies from subjects with a range of different mitochondrial genetic defects we have demonstrated that specific genotypes exhibit distinct biochemical signatures in muscle, providing evidence for the diagnostic use of the technique, as well as insight into the underlying molecular pathology. Stringent testing for reproducibility and sensitivity confirms the potential value of the technique for mechanistic studies of disease and in the evaluation of therapeutic approaches.


Figures

Figure 1
Figure 1. Comparison of COX/SDH histochemistry with complex I, IV and porin immunofluorescence.
COX/SDH and quadruple immunofluorescence were performed in serial muscle sections from patients: P1, P2, P11 and P17. Fluorescent detection was used to visualise: complex IV subunit I (COX-I) - green (488 nm), complex I subunit (NDUFB8) - purple (647 nm) and porin (mitochondrial mass) - red (546 nm). P1 (LRPPRC mutations) shows widespread COX deficiency whereas P2 (m.4175G > A MT-ND1 mutation) shows widespread NDUFB8 deficiency and preserved COX activity. Both P11 and P17 show mosaic COX deficiency. Selected muscle fibres demonstrate: (1) COX deficiency (COX-deficient fibres) with absent COX-I immunoreactivity, (2) decreased COX activity (COX-intermediate fibres) and decreased level of COX-I abundance, (3) normal COX activity (COX-positive fibres) and COX-I level but absent NDUFB8 immunoreactivity, (4) apparently normal COX activity and low level of COX-I immunoreactivity. All fibres highlighted show down-regulated levels of NDUFB8 abundance. P1 is a paediatric case and thus has smaller fibre size than the other cases. Scale bars measure 50 μm.
Figure 2
Figure 2. Correlation between COX activity and COX-I immunodetection.
(A) COX/SDH histochemistry (top) and quadruple immunofluorescence (bottom, COX-I - green, NDUFB8 - purple, porin - red and laminin - white) were performed on serial muscle sections from patients P5, P9, P12 and P19. (B) Visual classification (COX/SDH) and objective classification (COX-I and porin immunodetection) results. Fibres were classified as COX (activity/protein abundance) positive (beige), intermediate(+) (light beige), intermediate(−) (light blue) or deficient (blue). Fibres counted (n = visual/immunodetection): P5 (n = 1103/841); P9: (n = 1395/1071); P12: (n = 1887/1740) and P19: (n = 956/769). Visually classified COX deficiency was overestimated in P5 by 3.6 percentage points, underestimated in P19 by 4.4 percentage points, underestimated in P12 by 4.1 percentage points, and consistent in P5, as compared to objective classification. Scale bars measure 50μm.
Figure 3
Figure 3. Inter- and intra-observer variability of visual classification.
(A) COX/SDH (top) and quadruple immunofluorescence (bottom: COX-I - green, NDUFB8 - purple, porin - red and laminin - white) were performed in two serial muscle sections from patients P13 and P16. 100 myofibres from each patient were visually classified (COX/SDH) by two independent investigators, and objectively classified (COX-I and porin immunodetection). (B) Bar graphs show the percentage of COX-positive (beige), intermediate(+) (light beige), intermediate(−) (light blue) or deficient (blue) based on visual classification by investigator 1 and 2 (first two bars) and objective classification (last bar). In patient P13, both investigators identified the majority of COX-positive cells correctly (40% versus 42% using immunofluorescence) but differed in other categories. In patient P16, the investigators differed markedly in all categories. Importantly, both investigators demonstrated a high degree of internal inconsistency.
Figure 4
Figure 4. Inter-observer variability of quadruple immunofluorescence.
Quadruple immunofluorescence was performed in a muscle section taken from P8 (multiple mtDNA deletions) and approximately the same area of the biopsy was assessed by investigator 1 (n = 528 fibres analysed) and investigator 2 (n = 470 fibres analysed). The assessment included imaging the selected area of the muscle section by each investigator on a separate occasion (15 days apart) and performing subsequent IMARIS analysis. Bar graphs show the percentage of fibres with normal (beige), intermediate(+) (light beige), intermediate(−) (light blue), and deficient (blue) levels of (A) COX-I and (B) NDUFB8, when assessed by investigators 1 and 2.
Figure 5
Figure 5. Representative images of complex I and IV abundance in skeletal muscle sections from control and disease cases using quadruple immunofluorescence.
Fluorescent detection was used to visualise: COX-I - green, NDUFB8 - purple, porin - red and laminin – white. Representative images of respiratory-normal tissue (disease control, DC1) and single large-scale mtDNA deletion (P6), multiple mtDNA deletions (P11), m.3243A > G MT-TL1 mutation (P16), m.5690A > G MT-TN mutation (P17), novel MT-TP mutation (P18), m.10010T > C MT-TG mutation (P19), m14709T > C MT-TE mutation (P20), m.5543T > C MT-TW mutation (P21) and m.3243A > T MT-TL1 mutation (P22). Representative images of compound heterozygous LRPPRC mutations and m.4175G > A MT-ND1 mutation are shown in Fig. 1. DC1 is a paediatric case and thus has smaller fibre size than the other cases. Scale bars measure 50 μm.
Figure 6
Figure 6. Mitochondrial respiratory chain expression profile linking complex I, complex IV and porin levels in patients with genetically-characterised mitochondrial disease.
Plots show complex I and IV expression profile from patients with (A) isolated complex IV deficiency (compound heterozygous LRPPRC mutations, P1, n = 1258fibres analysed), (B) isolated complex I deficiency (m.4175G > A MT-ND1 mutation, P2, n = 1062), (C F) single mtDNA deletion: (C) P3 (n = 1027), (D) P4 (n = 1228), (E) P5 (n = 841) and (F) P6 (n = 779), (G K) multiple mtDNA deletions: (G) P7 (n = 526), (H) P8 (n = 528), (I) P9 (n = 1071), (K) P10 (n = 1118) and (K) P11 (n = 2400), Each dot represents the measurement from an individual muscle fibre, colour coded according to its mitochondrial mass (very low: blue, low: light blue, normal: light orange, high: orange and very high: red). Thin black dashed lines indicate the SD limits for the classification of fibres, lines next to x and y axis indicate the levels of NDUFB8 and COX-I respectively (beige: normal, light beige: intermediate(+), light blue: intermediate(−) and blue: deficient). Bold dashed lines indicate the mean expression level of normal fibres.
Figure 7
Figure 7. Continuation of figure 6.
Plots show complex I and IV expression profile from patients with (L-P) m.3243A > G MT-TL1 mutation: (L) P12 (n = 1328), (M) P13 (n = 499), (N) P14 (n = 1441), (O) P15 (n = 741) and (P) P16 (n = 918) and (Q-V) different mt-RNA mutations: (Q) m.5690A > G MT-TN mutation (P17, n = 1512), (R) novel MT-TP mutation (P18, n = 1012), (S) m.10010T > G MT-TG mutation (P19, n = 769), (T) m.14709T > C MT-TE mutation (P20, n = 1782), (U) m.5543T > C MT-TW mutation (P21, n = 447) and (V) m.3243A > T MT-TL1 mutations (P22, n = 1042).

References

    1. Gorman G. S. et al. Prevalence of nuclear and mtDNA mutations related to adult mitochondrial disease. Ann Neurol 77, 753–759 (2015). - PMC - PubMed
    1. Greaves L. C., Reeve A. K., Taylor R. W. & Turnbull D. M. Mitochondrial DNA and disease. J Pathol 226, 274–286 (2012). - PubMed
    1. Campbell G. R. et al. Mitochondrial DNA deletions and neurodegeneration in multiple sclerosis. Ann Neurol 69, 481–492 (2011). - PMC - PubMed
    1. Oldfors A., Larsson N.-G., Lindberg C. & Holme E. Mitochondrial DNA deletions in inclusion body myositis. Brain 116, 325–336 (1993). - PubMed
    1. Reeve A. K. et al. Nature of mitochondrial DNA deletions in substantia nigra neurons. Am J Hum Genet 82, 228–235 (2008). - PMC - PubMed

Publication types

MeSH terms

Substances