Comparative Study
. 2015 Oct 15:6:8549.
doi: 10.1038/ncomms9549.

RFX transcription factors are essential for hearing in mice

Affiliations
Comparative Study

RFX transcription factors are essential for hearing in mice

Ran Elkon et al. Nat Commun. .

Abstract

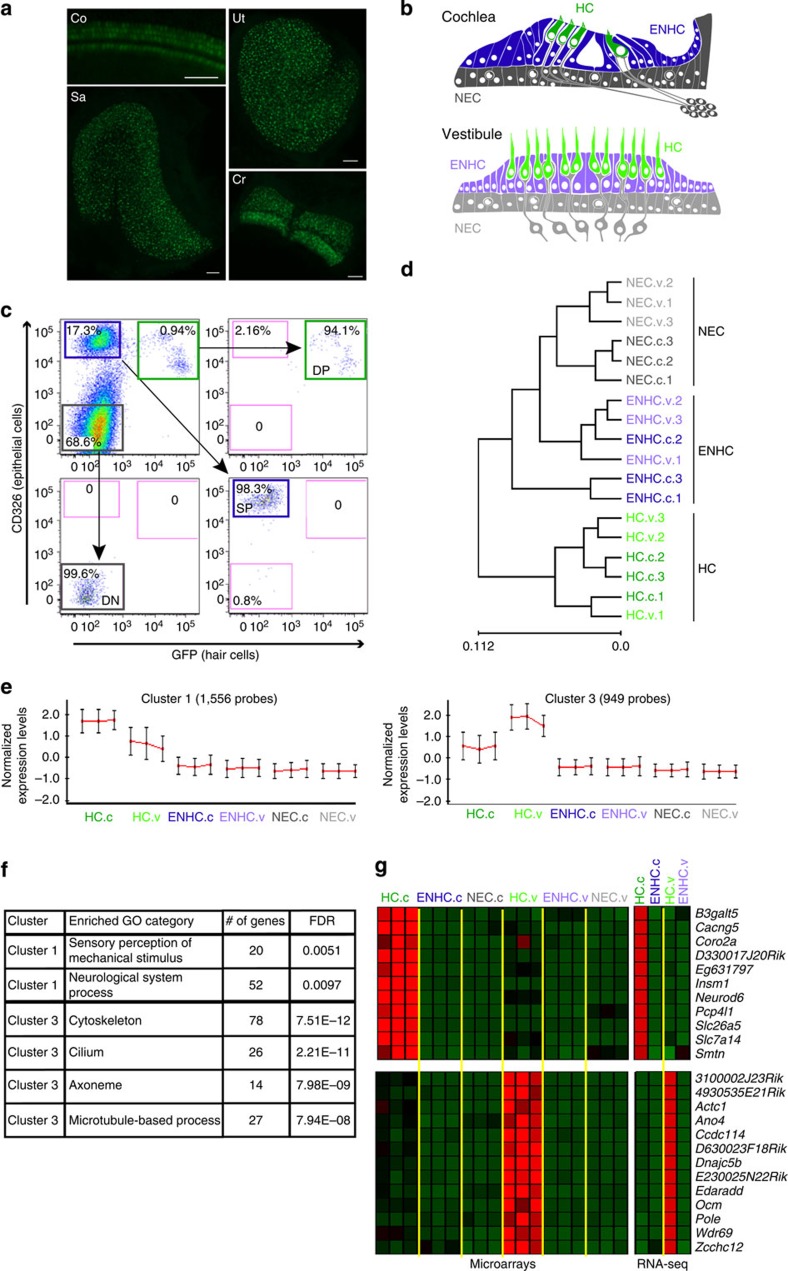
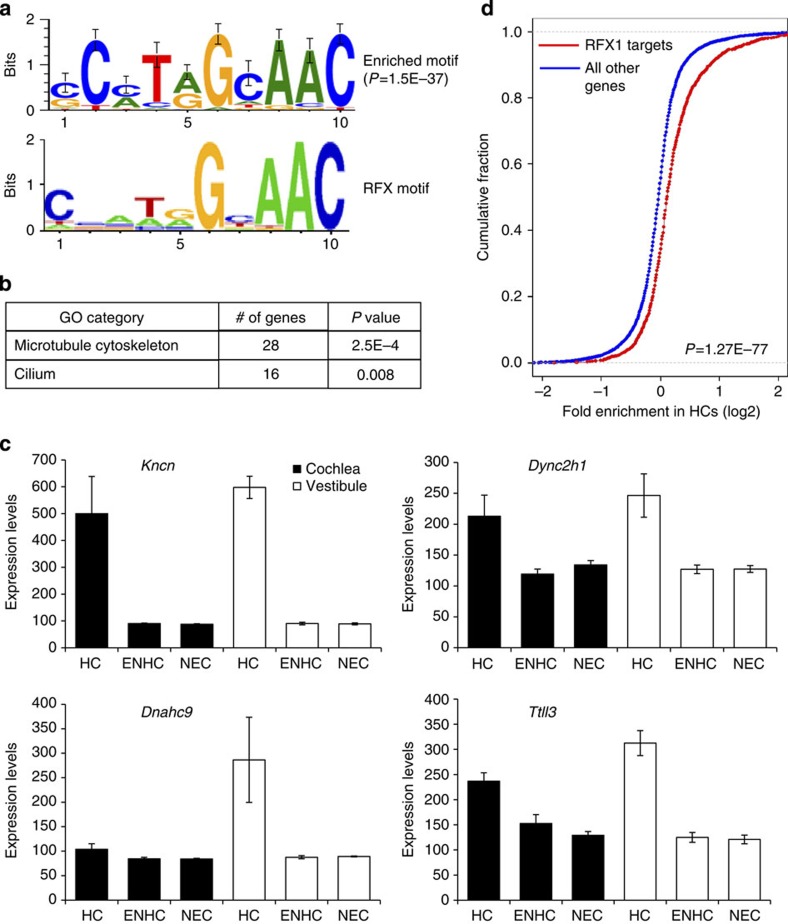
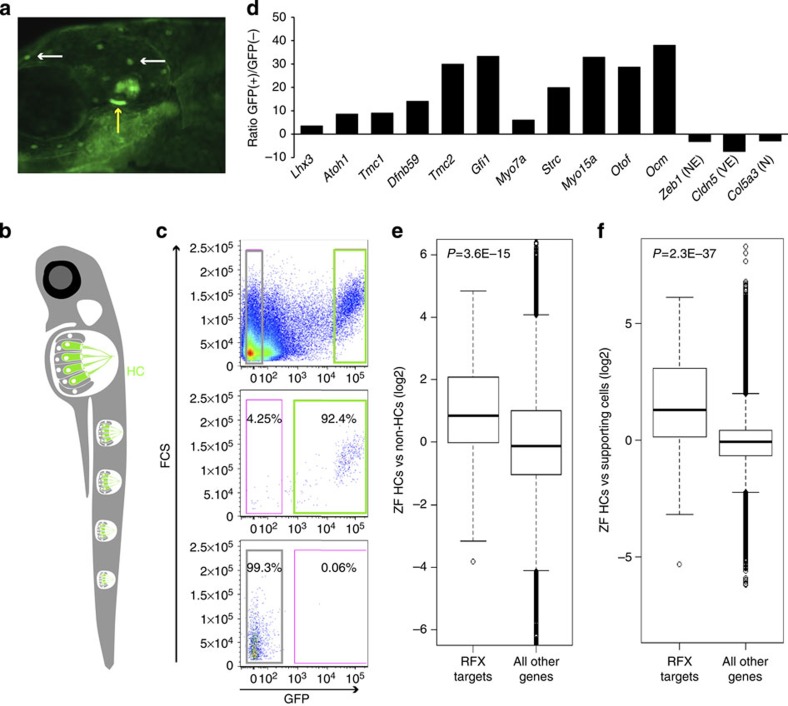
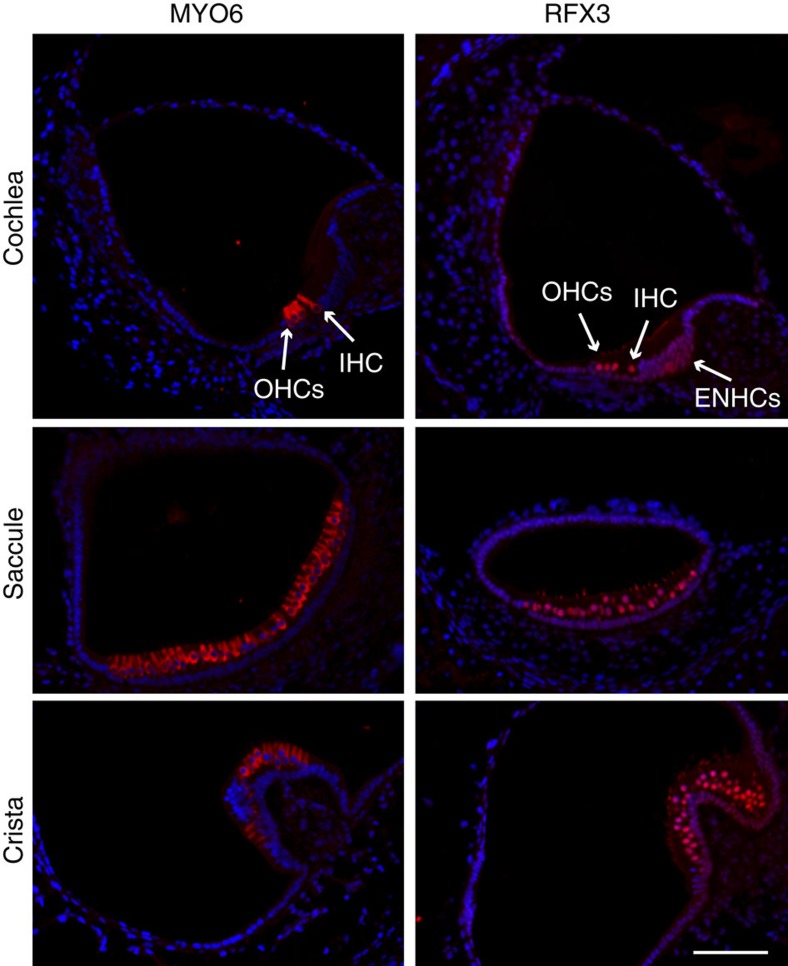
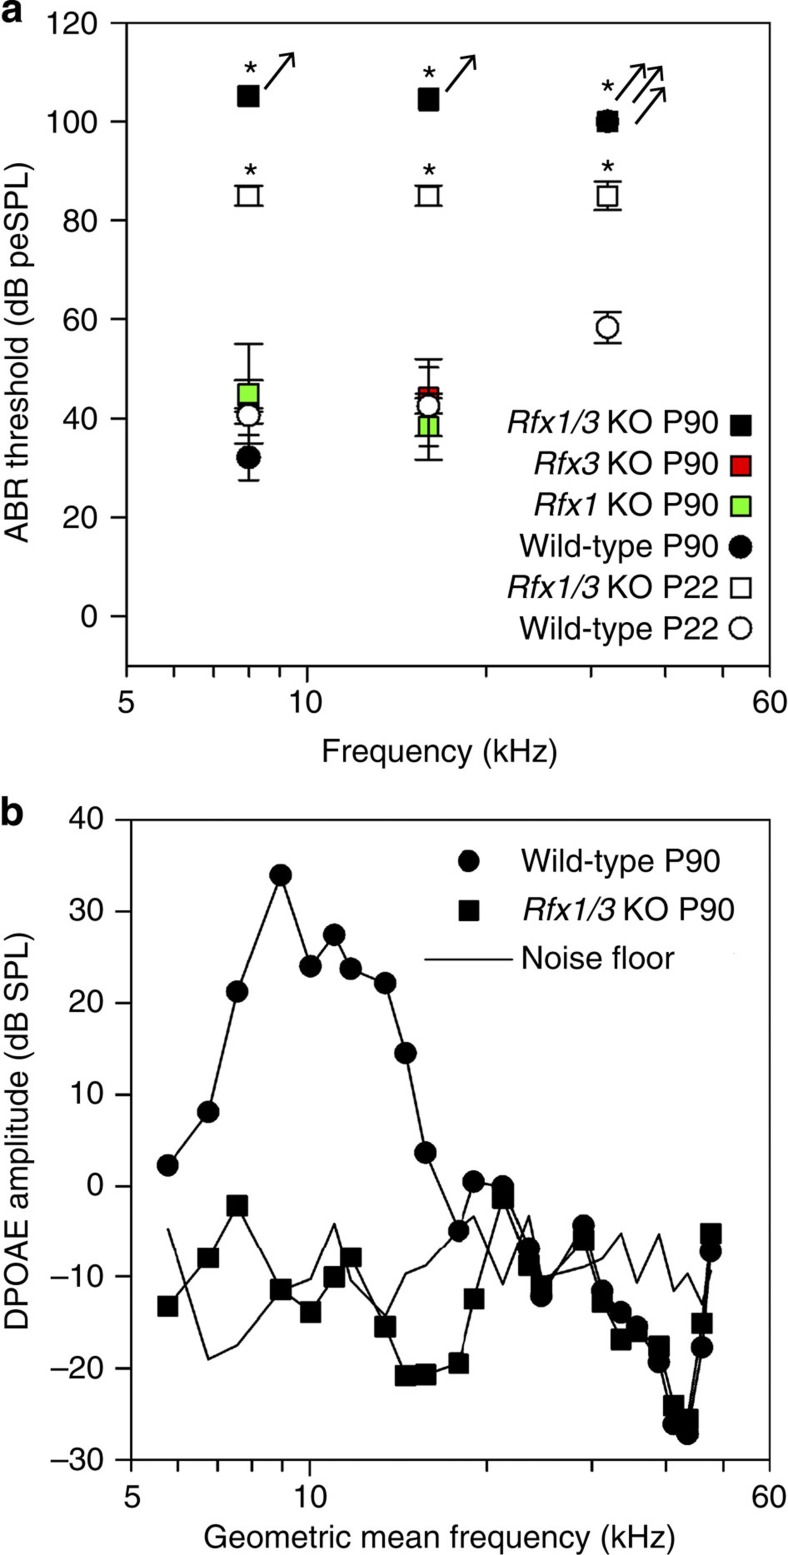
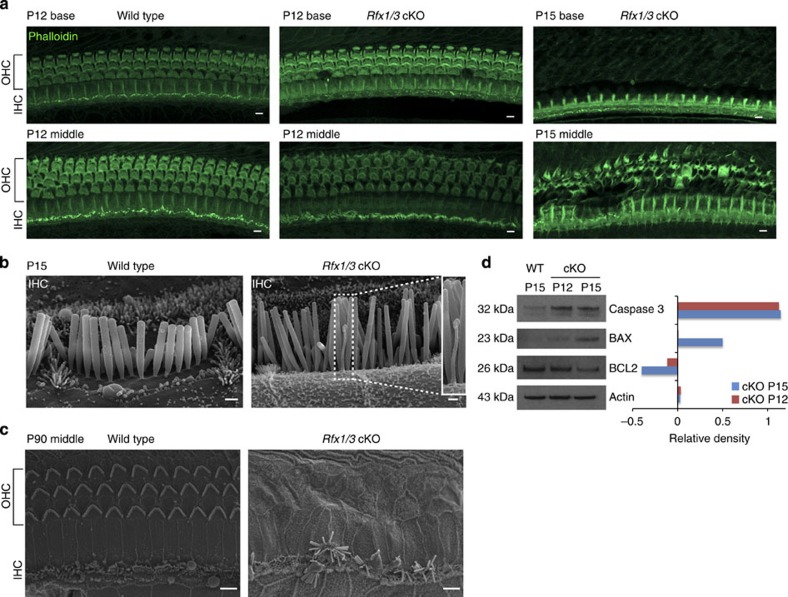
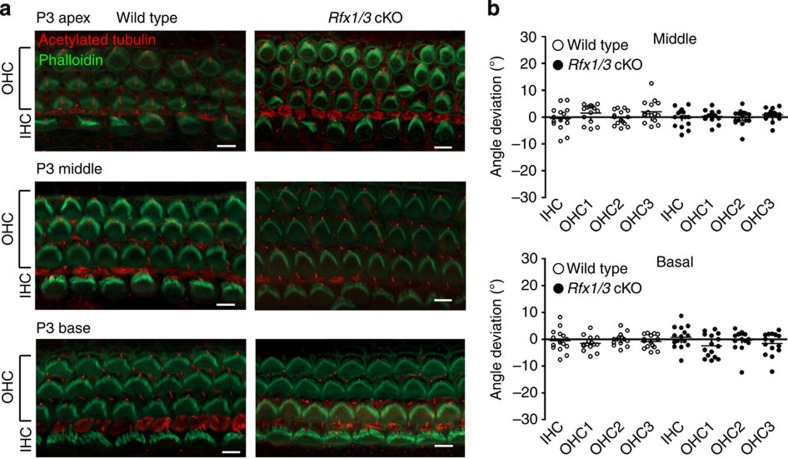
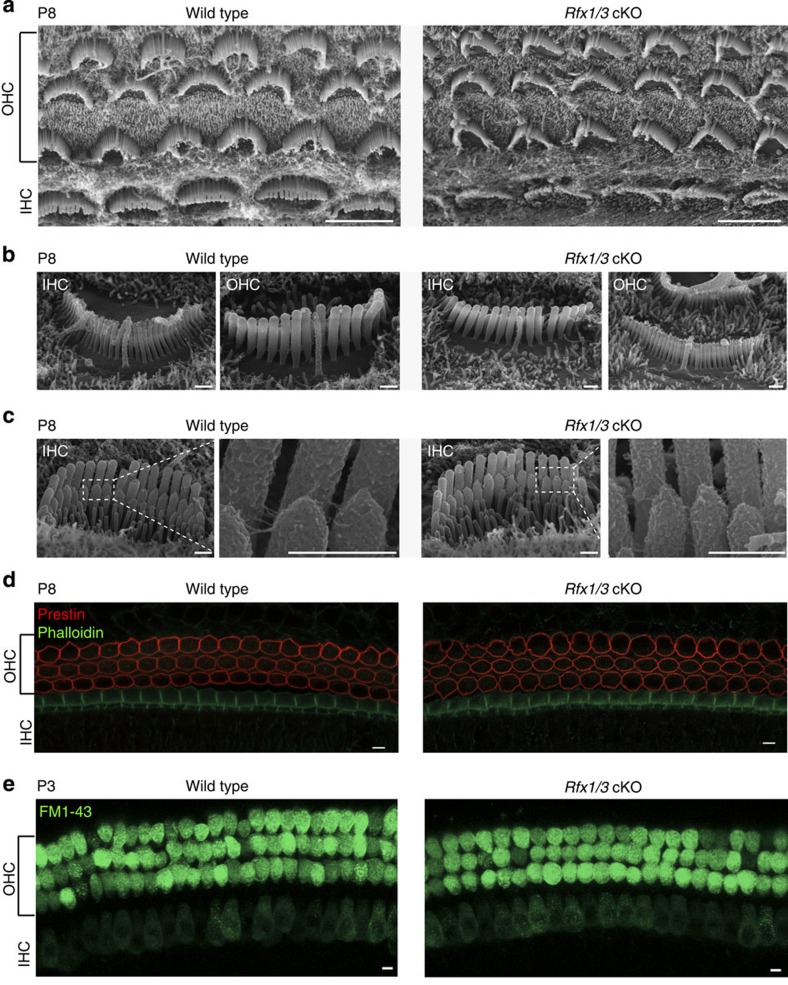
Sensorineural hearing loss is a common and currently irreversible disorder, because mammalian hair cells (HCs) do not regenerate and current stem cell and gene delivery protocols result only in immature HC-like cells. Importantly, although the transcriptional regulators of embryonic HC development have been described, little is known about the postnatal regulators of maturating HCs. Here we apply a cell type-specific functional genomic analysis to the transcriptomes of auditory and vestibular sensory epithelia from early postnatal mice. We identify RFX transcription factors as essential and evolutionarily conserved regulators of the HC-specific transcriptomes, and detect Rfx1,2,3,5 and 7 in the developing HCs. To understand the role of RFX in hearing, we generate Rfx1/3 conditional knockout mice. We show that these mice are deaf secondary to rapid loss of initially well-formed outer HCs. These data identify an essential role for RFX in hearing and survival of the terminally differentiating outer HCs.


Conflict of interest statement

Scott Strome is a Cofounder and Major stockholder in Gliknik Inc., a biotechnology company. He also receives royalties for intellectual property, related to B7-H1 (PD-L1), licensed by the Mayo Clinic College of Medicine to third parties. The remaining authors declare no competing financial interests.

Figures

Figure 1
Figure 1. HC transcriptome analysis.
(a) Representative images from an inner ear of an Atoh1/nGFP mouse. All HCs in the auditory and vestibular systems are GFP(+). Co-cochlea; Cr-crista; S-saccule; U-utricle. Scale bar, 50 μm. (b) Schematic diagram of cochlear and vestibular sensory epithelia, illustrating the cells designated as HC, ENHC and NECs in each organ. (c) Representative image of flow cytometry from cochlear epithelia of newborn Atoh1/nGFP mice. Left upper quadrant—pre-sorting figure: HCs are double positive (DP), ENHCs are positive for CD326 (SP), NECs are negative for CD326 and GFP (DN). Post-sort analyses of sorted cells showing a cell type-specific purity >94% for HCs, >99% for NECs and >98% for ENHCs. (d) Hierarchical clustering, based on all the expressed genes in the data set, separated the probed samples into three major branches according to cell type: HC, NEC and ENHC (c-cochlea and v-vestibular samples). (e) Two major clusters containing genes whose expression is elevated in HCs. Each cluster is represented by the mean pattern of its genes’ expression levels (error bars: ±s.d. calculated over all genes assigned to each cluster). Expression levels of each gene were standardized (mean=0, s.d.=1) prior to clustering. This methodology enabled grouping of genes that share similar patterns, but not necessarily the same magnitude of expression. The entire set of clusters is shown in Supplementary Fig. 2. (f) Enriched GO categories with a P value <0.01 (hypergeometric test) after false discovery rate correction for multiple testing. (g) Marker genes specific for cochlear HCs (top) and vestibular HCs (bottom) as detected in the expression microarray data set (left) and confirmed by the RNA-seq data set (right). Red represents enrichment, Green represents depletion. Data represent results from three biological replicates.
Figure 2
Figure 2. RFX binding signature is enriched in promoters of HC-enriched genes.
(a) De-novo motif analysis revealed that the promoters of genes whose expression is elevated in inner ear HCs are significantly enriched for a DNA motif that matches the binding signature of the RFX family of TFs (the known RFX motif is from TRANSFAC DB; accession number M00281). The enriched motif was detected in promoters of 225 HC-elevated genes (enrichment factor=2.7; P value=1.5E−37). (b) GO functional categories that were over-represented in the set of 225 putative RFX HC target genes. (c) Expression pattern of selected putative RFX targets that function in ciliogenesis (n=3; error bars: ±s.d.). (d) HC enrichment was defined per gene as the ratio between its expression in HCs and its average expression over the three probed cell types (HC, ENHC and NEC). The plot compares the cumulative distribution of these HC-enrichment measures (in log2 scale; x-axis) between the set of all RFX1 targets defined by ChIP-seq analysis (red) and all the other genes in the data set (blue). The distribution for the RFX1 targets is significantly shifted to the right, demonstrating that their expression level as a group is markedly elevated in HCs (P value=1.3E−77; Wilcoxon test). See Supplementary Fig. 9b for similar analysis applied to ChIP-Seq targets of RFX3.
Figure 3
Figure 3. The expression of RFX target genes is elevated in zebrafish HCs.
(a) An image of a 5 dpf ppv3b:GFP larvae showing GFP expression in the inner ear HCs (yellow arrow) and in the neuromast HCs (white arrows). (b) Schematic representation of a zebrafish showing the neuromast HCs. (c) Representative image of flow cytometry from dissociated 5 dpf ppv3b:GFP larvae. Top—dot plot analysis reveals a distinct population of GFP(+) cells (right). Post-sort analyses showing a cell type-specific purity >92% for GFP(+) cells (middle panel), >99% for negative cells (bottom). (d) The expression of zebrafish orthologues of known murine HC-enriched genes. Expression is enriched in the zebrafish GFP(+) cell population, while markers of NECs (for example, Zeb1), vascular epithelial cells (VE; for example, Cldn5) and neuronal cells (N; for example, Col5a3) are decreased (results based on RNA-seq). (e) Expression of the zebrafish orthologous genes of the 225 putative targets of RFX that we identified in murine HCs, was significantly elevated in zebrafish HC (GFP(+) cells). Ratios between expression level in the GFP(+) and GFP(−) cells were calculated for each gene in the zebrafish data set. The plot compares the distribution of these ratios (in log2 scale; y-axis) between the set of orthologues of the RFX targets (left boxplot) and all the other genes in the data set (right boxplot). The box indicates the first and third quartiles; the horizontal band inside the box indicates the median. The whiskers extend to the most extreme data point, which is no more than 1.5 times the interquartile range from the box. P value calculated using Wilcoxon test. (f) Similar to panel (e), but using an independent zebrafish gene expression data set. Here too, expression of RFX target genes is significantly elevated in HCs as compared with their expression levels in non-HCs.
Figure 4
Figure 4. RFX3 expression in the mouse inner ear.
Inner ear sections from a P1 wild-type mouse stained with an antibody for MYO6, which marks the inner ear hair cells (left panel) and RFX3 (right panel), in red, and counterstained with DAPI, in blue. A robust nuclear expression of RFX3 is detected in all HCs with a much weaker expression in ENHCs. Staining of the stereocilia with the RFX3 antibody is non-specific, validated by staining cKO ears in which the nuclear staining is abolished and the stereocilia staining persists (Supplementary Fig. 11). IHC, inner hair cell; OHCs, outer hair cells. Representative images of n>5 experiments. Scale bar, 60 μm.
Figure 5
Figure 5. Rfx genes are necessary for hearing.
(a) Elevated hearing thresholds in the Rfx1/3 cKO mice: 3-month-old Rfx1 cKO and Rfx3 cKO have hearing thresholds indistinguishable from their wild-type littermate controls at 8 and 16 kHz. However, Rfx1/3 cKO mice have significantly elevated hearing thresholds compared with their age-matched controls already at postnatal day 22. Their hearing thresholds progress to a profound hearing loss as measured at P90. All strains exhibited elevated thresholds at 32 kHz at P90. Arrows indicate that mean thresholds are likely higher than those indicated because a number of animals had absent ABR at the maximum stimulus levels tested. Error bars are ±s.e.m. ‘*’ are P value<0.01 (multivariate ANOVA test for P22 data and ANOVA test for P90 data). (b) Distortion Product Otoacoustic Emissions (DPOAE) amplitudes, indicative of outer HC function, were also significantly reduced for Rfx1/3 cKO mice compared with wild-type controls. The following genotypes were tested at P22: Rfx1/3 cKO (n=4), wild type (n=10); and at P90: Rfx1 cKO (n=3), Rfx3 cKO (n=8), Rfx1/3 cKO (n=10), wild type (n=6).
Figure 6
Figure 6. Rapid degeneration of the terminally differentiating OHCs in the Rfx1/3 cKO mice.
(a) Confocal imaging of the basal and middle turns of cochlear ducts from wild-type (P12) and Rfx1/3 cKO (P12 and 15) stained with phalloidin (green), n=4 for all genotypes. A diffuse loss of OHCs is seen in the P15 cKO mice progressing from the basal to the middle turn. (b) Lateral view of IHC of P15 mice, demonstrating the retained kinocilium in the IHC of the mutant mice. Inset shows a high magnification image of the retained kinocilium. (c) SEM of a middle turn from 3-month-old mice showing complete degeneration of the OHCs and disrupted IHCs in the double cKO mice. N=4 for all genotypes. Scale bars for a,c: 5 μm; for b: 0.5 μm. (d) Western blot analysis was performed to detect changes in expression of markers for cell death and survival in cochlear ducts dissected from P15 wild-type (controls) and P12 and P15 Rfx1/3 cKO mice (left panel). Densitometry analysis was performed to quantify the changes in protein expression relative to the levels in the wild-type tissue (right panel). Results show a significant increase in caspase 3 and BAX along with a decrease in BCL2 consistent with cell death. Actin was used as a loading control. Left margin indicates the molecular weight. Each lane consists of tissue obtained from four ears. This set of experiments was performed twice using biologically independent samples and a representative figure is shown.
Figure 7
Figure 7. The stereociliary bundles of the HCs in the Rfx1/3cKO mice are properly polarized.
(a) Representative confocal microscopy images from the basal, middle and apical turns of 3-day-old Rfx1/3 cKO mice (n=3) and their wild-type littermate controls (n=3). Cochleae were stained with phalloidin (green) to define the actin cytoskeleton and stereociliary bundles, and an antibody for acetylated tubulin (red) to define the kinocilium. The stereociliary bundles of the wild-type and mutant mice appear properly polarized in the basal and middle turns. In the apical turn at P3, the polarity of the bundles is less organized in both the wild-type and mutant mice. Scale bar, 5 μm. (b) Quantification of the angle of deviation of the bundles in the wild-type and mutant mice, as measured from a line perpendicular to the axis of the pillar cells, crossing through the middle of the HCs. Results from the basal and middle turns are represented in a scatter dot plot. Each dot represents a HC, horizontal bars represent the median value. The polarity of five consecutive IHCs, first row OHCs, second row OHCs and third row OHCs was measured from cochleae of three separate mice from each genotype and from two regions: basal and middle turns, separately. A one-way ANOVA followed by a Tukey’s test was used to compare the results. No statistical significant differences were detected (P value>0.05).
Figure 8
Figure 8. Rfx1/3 are not necessary for the early differentiation of OHCs.
(a) SEM images of the middle turns from P8 Rfx1/3 cKO mice and their wild-type controls showing normal appearance of the cochlear sensory epithelia with one row of IHCs and three rows of OHCs. All HCs have kinocilia. (b) Higher magnification lateral views of IHCs and OHCs of Rfx1/3 cKO and littermate P8 controls showing properly formed kinocilia. (c) Higher magnification medial views of IHCs; Inset show the tip links at higher magnification from the regions indicated in the dashed boxes. (d) Basal turns of P8 cochlear ducts from Rfx1/3 cKO and controls stained with an antibody for prestin (red) and phalloidin (green). All OHCs express prestin in their lateral wall. (e) A functional assay for the presence of an intact transduction channel was performed using the uptake of FM1-43 dye. HCs throughout the cochleae of the wild-type and double cKO mice internalized the dye within 10 s. Scale bars for a,d,e: 5 μm; Scale bars for b,c: 0.5 μm. n=3 for P8 SEM analysis, n=4 for prestin staining and n=8 for FM1-43 analysis.

References

    1. Morton N. E. Genetic epidemiology of hearing impairment. Ann. NY Acad. Sci. 630, 16–31 (1991). - PubMed
    1. Yamasoba T. et al.. Current concepts in age-related hearing loss: epidemiology and mechanistic pathways. Hear. Res. 303, 30–38 (2013). - PMC - PubMed
    1. Schwander M., Kachar B. & Muller U. Review series: the cell biology of hearing. J. Cell Biol. 190, 9–20 (2010). - PMC - PubMed
    1. Ruben R. J. Development of the inner ear of the mouse: a radioautographic study of terminal mitoses. Acta Otolaryngol. 220, (Suppl): 1–44 (1967). - PubMed
    1. Bermingham N. A. et al.. Math1: an essential gene for the generation of inner ear hair cells. Science 284, 1837–1841 (1999). - PubMed

Publication types

MeSH terms

Associated data