Comparative Study
. 2015 Oct 15:6:8557.
doi: 10.1038/ncomms9557.

Single-cell RNA-Seq resolves cellular complexity in sensory organs from the neonatal inner ear

Affiliations
Comparative Study

Single-cell RNA-Seq resolves cellular complexity in sensory organs from the neonatal inner ear

Joseph C Burns et al. Nat Commun. .

Abstract

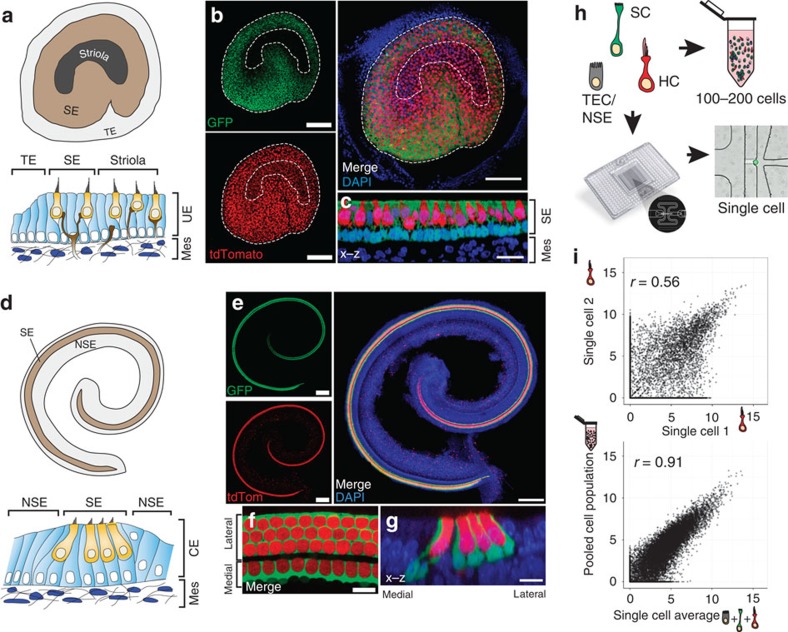
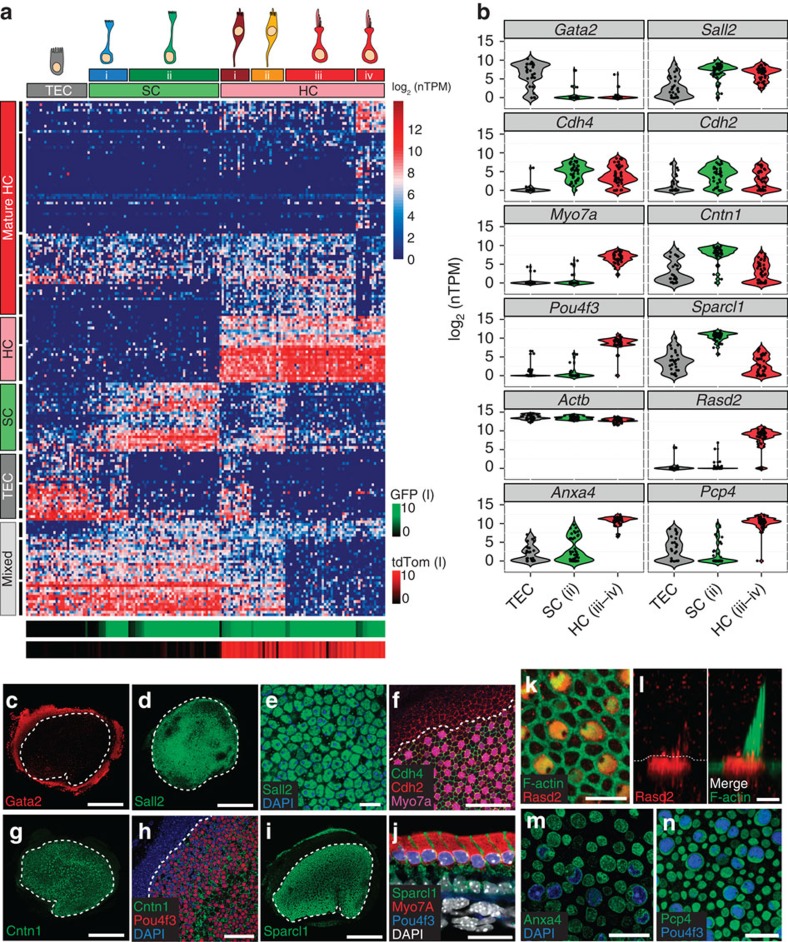
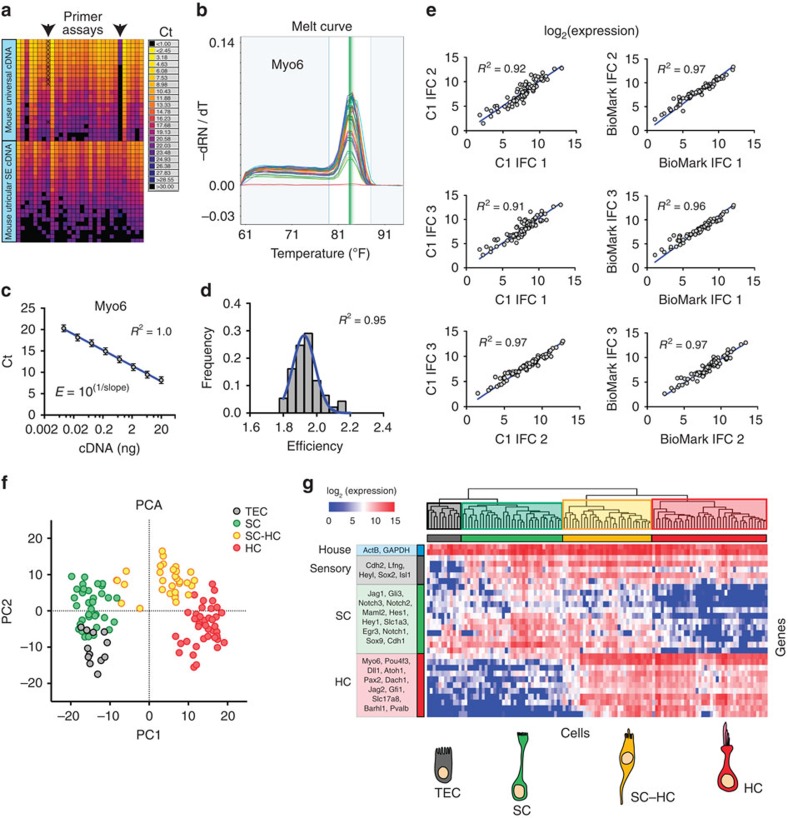
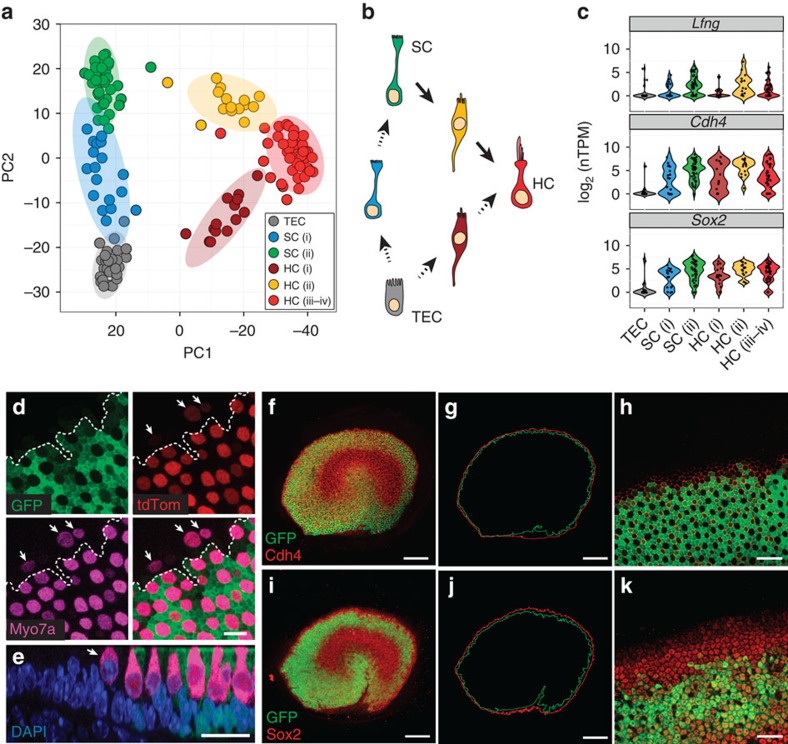
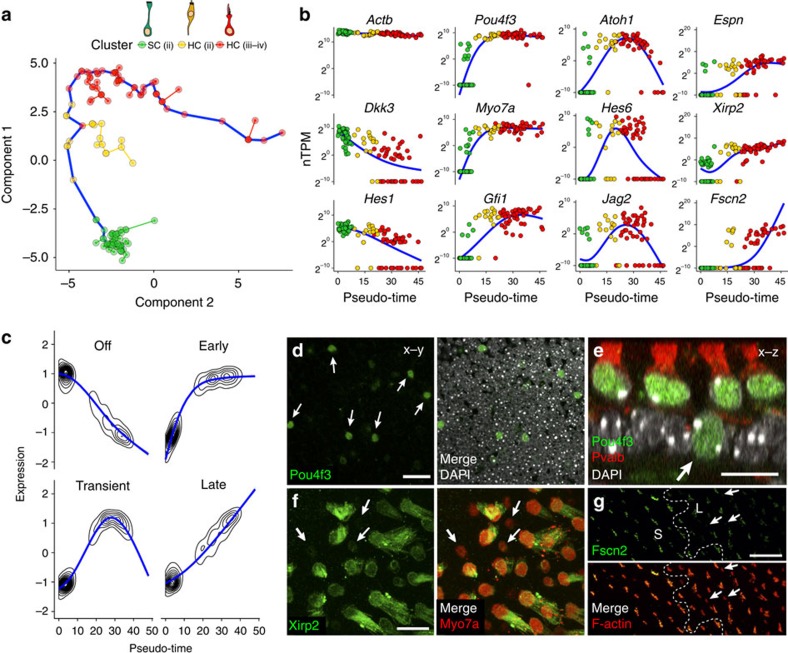
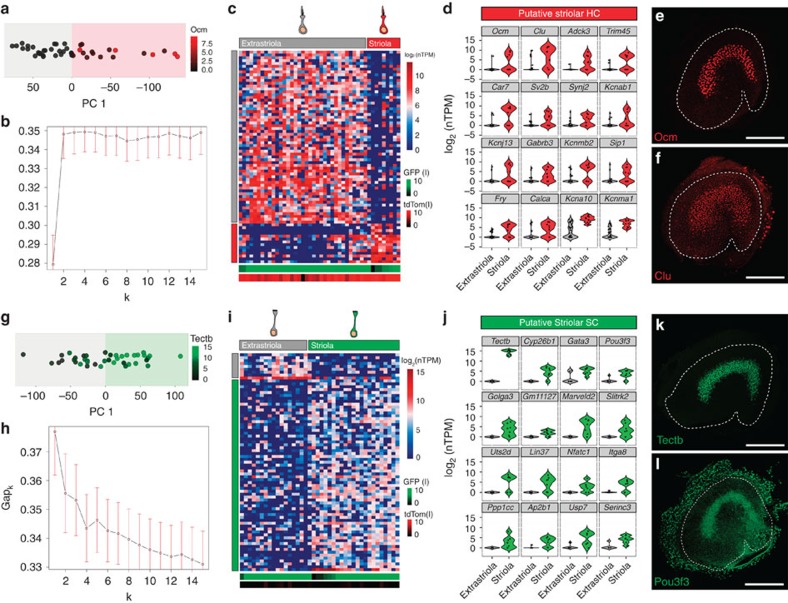
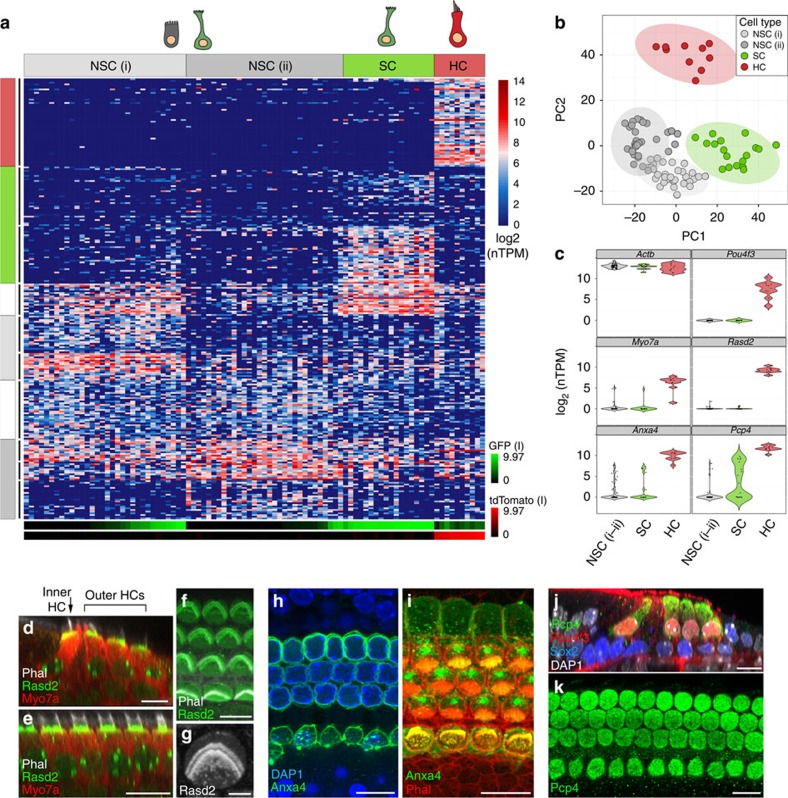
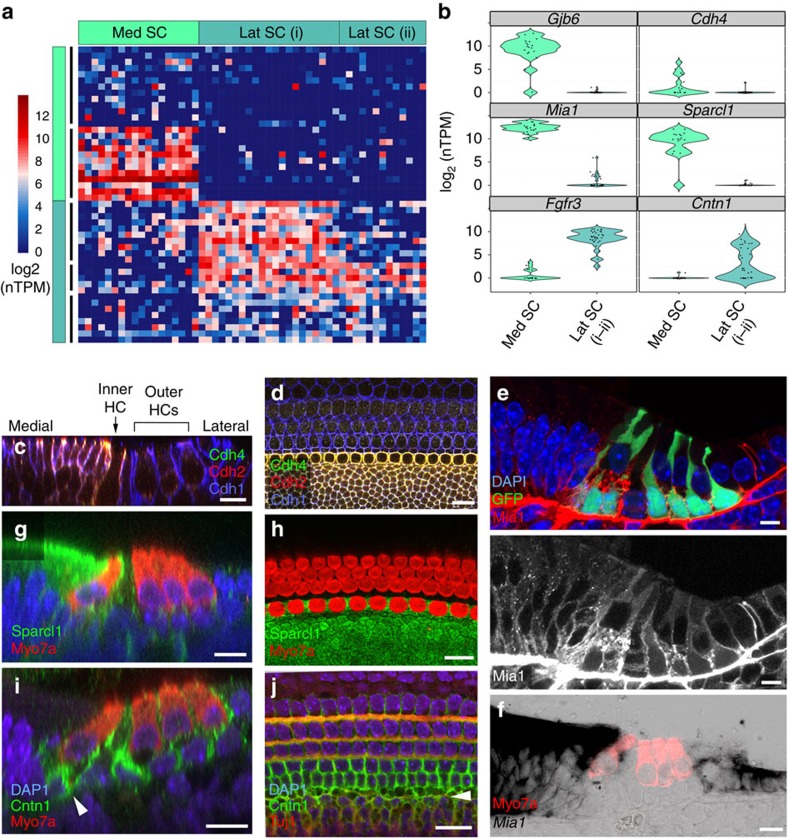
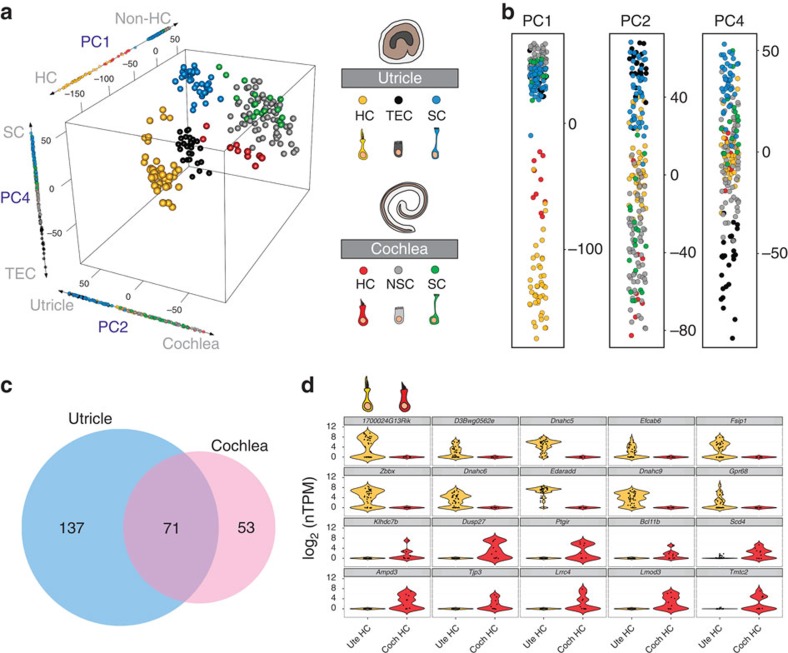
In the inner ear, cochlear and vestibular sensory epithelia utilize grossly similar cell types to transduce different stimuli: sound and acceleration. Each individual sensory epithelium is composed of highly heterogeneous populations of cells based on physiological and anatomical criteria. However, limited numbers of each cell type have impeded transcriptional characterization. Here we generated transcriptomes for 301 single cells from the utricular and cochlear sensory epithelia of newborn mice to circumvent this challenge. Cluster analysis indicates distinct profiles for each of the major sensory epithelial cell types, as well as less-distinct sub-populations. Asynchrony within utricles allows reconstruction of the temporal progression of cell-type-specific differentiation and suggests possible plasticity among cells at the sensory-nonsensory boundary. Comparisons of cell types from utricles and cochleae demonstrate divergence between auditory and vestibular cells, despite a common origin. These results provide significant insights into the developmental processes that form unique inner ear cell types.


Figures

Figure 1
Figure 1. Genetic labelling and RNA-Seq of single cells from the newborn mouse inner ear.
(a) Diagrams depicting regional heterogeneity in the utricle, a linear acceleration detector. Surface view (top) shows the sensory epithelium (SE), which contains HCs and SCs, and the surrounding transitional epithelium (TE) that is devoid of HCs and SCs. The striola is a crescent-shaped zone that sits in the centre of the SE where specialized HCs and SCs may reside. Cross-sectional view (bottom) illustrates that the utricular epithelium (UE) sits on a matrix (Mes) that contains mesenchyme and neuronal processes. (b,c) Genetic labelling of SCs and HCs in LfngEGFP; R26RCAG-tdTomato; Gfi1Cre mice at P1. In extra-striolar regions, SCs are GFP+/tdTomato−, and HCs are GFP+/tdTomato+. In contrast, GFP is expressed at or below the level of detection in most striolar cells (outlined). (dg) Comparable images as in ac for the cochlear epithelium. The coiled cochlea contains a narrow strip of HCs and SCs (SE) bounded on both the medial and lateral sides by non-sensory epithelium (NSE). In P1 cochleae from LfngEGFP; R26RCAG-tdTomato; Gfi1Cre mice, nearly all HCs are tdTomato+, and all SCs except inner pillar cells (see Supplementary Fig. 2 for details) are GFP+. Mesenchymal cells express tdTomato (tdTom) as well, but are excluded by epithelial delamination. (h) Workflow for preparing inner ear cells for RNA-Seq. Dissociated HCs, SCs and TECs/NSE from utricle or cochlea were isolated and prepared for single-cell RNA-Seq on a C1 IFC and then imaged before lysis. For comparison, some dissociated samples were prepared as 100–200-cell bulk populations. Single cells and bulk tube controls were prepared and processed in the same manner. (i) Correlation plots of log2(nTPM) gene expression for all 26,583 genes in the NCBI-annotated mouse genome for two randomly selected HCs (top) and the average of all single cells compared with a tube control (bottom). The increase in r-value (Spearman's correlation) when all single cells are compared with a tube control suggests that much of the variation between individual cells is biological. Scale bars, 100 μm (b); 20 μm (c); 200 μm (e); 10 μm (f,g).
Figure 2
Figure 2. Single-cell RNA-Seq identifies unique cell types and novel markers in the newborn mouse utricle.
(a) K-means clustering of 158 P1 utricle cells (x axis) using the top 195 genes (y axis) identified with PCA. The gap statistic, an unbiased estimate of the total number of clusters, identified seven distinct clusters. On the basis of expression of known marker genes and fluorescence state (bottom x-axis bars and right legends, displayed on log2 scale), each cluster was assigned to one of the three known cell types (top x-axis bars): TECs (grey), SCs (light green) and HCs (light red). TECs comprise one cluster, whereas SCs and HCs comprise two (SC.i–ii) and four (HC.i–iv) clusters, respectively. Genes were also divided by k-means (black bars indicate 15 clusters identified by gap statistic) and pooled based on cell type, HC maturity or variation across multiple cell types (Mixed). The Mixed group consists of two gene clusters expressed in non-HCs and one small cluster restricted to SCs and HCs. (b) Violin plots for representative genes identified as differentially expressed (FDR<0.05) between the clusters of differentiated, non-fate-transitioning cells (TEC, SC.ii and HC.iii–iv) as indicated in a. Black dots show the expression level for each cell. The housekeeping gene Actb is included for comparison. (cn) Immunohistochemical validation of differentially expressed genes illustrated in b. Gata2 is enriched in TECs (c), whereas spalt-like transcription factor 2 (Sall2), R-cadherin (Cdh4), contactin 1 (Cntn1) and SPARC-like 1 (Sparcl1) are enriched within the sensory epithelium (SE, dj). Co-staining of Cdh4 with N-cadherin (Cdh2) shows that Cdh4 is a more specific marker of the SE boundary (dotted line in f). Pou4f3 (h,j,n) and myosin VIIA (f,j; Myo7a) are canonical HC markers. Higher magnification or cross-sections indicate the Cntn1 (h) and Sparcl1 (j) are enriched within SCs. Rasd2, Anxa4 and Pcp4 are novel HC markers (kn). Rasd2 localizes to the cuticular plate and base of stereocilia (k,l), Anxa4 localizes to cell membranes (m) and Pcp4 localizes to the cytoplasm (n). Scale bars, 200 μm (c,d,g,i); 10 μm (e,k); 20 μm (f,j,m,n); 50 μm (h); 3 μm (l).
Figure 3
Figure 3. Single-cell qPCR identifies distinct cell types in the P1 utricle.
(a) Heatmap of qPCR Cts measured from serial dilutions of mouse universal or utricular sensory epithelium (SE) cDNA, which were used to test primer efficiency. Arrows point to two assays, Egr3 and Pou4f3, that showed bimodal melt curves or were not detected in universal cDNA but passed quality control metrics for utricular SE cDNA. (b) Example melt curves for amplicons obtained with primers for Myo6. Single peaks at a similar melt temperature were observed in all single cells. Assays that showed more than one peak were removed from analysis. (c) Plot of average Ct value measured on the BioMark system across three replicates versus input cDNA concentration (mouse universal cDNA). (d) Histogram of primer efficiencies for all 30 assays used. Efficiencies are normally distributed (Gaussian fit) and have an average efficiency of 1.9. (e) Comparison of average gene expression in single-cell qPCR data between different capture (C1) and qPCR (BioMark) IFC's. Left: graphs compare average expression of 30 genes across all cells captured on each C1 IFC for single-cell qPCR. Expression level is displayed as log2(expression), which is equivalent to the difference between the limit of detection Ct value and the measured Ct value. Right: graphs compare average gene expression across all cells profiled on each BioMark IFC. Cells from different C1 captures were profiled on each BioMark IFC to test for variability in the qPCR system. All plots show strong correlations (Pearson's r) and linear dependence, indicating that data collected on the microfluidics platforms are reproducible. (f,g) Plots show PCA (f) and hierarchical clustering (g) of 118 single cells based on qPCR-based detection of 30 genes. TECs, SCs and HCs cluster into defined groups enriched for known marker genes. A group of HCs that express SC genes (SC–HC, yellow) can also be identified. The 30 assays utilized did not provide sufficient resolution to detect the group of HCs with expression of TEC genes (HC.i), which was identified by single-cell RNA-Seq.
Figure 4
Figure 4. Single-cell RNA-Seq identifies cellular transitions and possible variation in the sensory/non-sensory boundary.
(a) Plot of P1 utricular cells projected onto the first two principal components (PCs) identified by PCA using the top 195 genes (same as Fig. 2a). Each circle is a single cell while the larger ovals represent 95% confidence regions. Cells are coloured based on the groups assigned by k-means clustering. (b) Model of cellular relationships based on the data in a, suggesting that the sensory epithelium adds new SCs and HCs via both interstitial and appositional growth. (c) Violin plots showing expression of genes that potentially mark the sensory region in the P1 utricle. Expression within all of the k-means clusters is shown. In the HC.i group, Lfng expression is low compared with Cdh4 and Sox2. (d) High-resolution confocal image of the lateral edge of the utricular sensory epithelium from a P1 LfngEGFP; R26RCAG-tdTomato; Gfi1Cre mouse. New HCs expressing low levels of both Myo7a and tdTom (arrows) are present beyond the lateral edge of the sensory epithelium defined by LfngEGFP expression (dotted line). (e) Cross-sectional view of the utricle in d illustrating a single HC (arrow) outside of the GFP expression domain. (fh) Confocal images of Cdh4 immunolabelling in a P1 LfngEGFP mouse utricle. Traces (g) around the borders of the GFP+ (green) and Cdh4+ (red) domains reveal that the Cdh4+ region is slightly larger. Single confocal z-plane (h) at the apical surface of the lateral edge in f. At most locations, two to three Cdh4+ cells extend past the last GFP+ cell. (ik) Similar analysis as fh for GFP and Sox2. Compared with Cdh4, the Sox2+ domain extends even further past the edge of GFP+ cells, in some instances up to five cell widths. Image in k is a single confocal z-plane at the level of the SC nuclei. Scale bars, 10 μm (d); 20 μm (e,h,k); 100 μm (f,g,i,j).
Figure 5
Figure 5. Ordering single cells along a differentiation trajectory reveals mechanistic insights into utricular HC differentiation.
(a) Ordering of SC to HC differentiation using Monocle. On the basis of the model illustrated in Fig. 4b, cells from the SC.ii and HC.ii–iv clusters were used for ordering. Individual cells are connected by a minimum spanning tree (thin lines), and the longest line through the tree (blue) represents the differentiation trajectory (pseudo-time). (b) Gene expression levels in single cells ordered along the pseudo-time axis from a. Housekeeping genes such as Actb change little while SC-specific genes such as Dkk3 and Hes1 gradually turn off. Also shown are examples of genes expressed early (Pou4f3, Myo7a and Gfi1), transiently (Atoh1, Hes6 and Jag2) or late (Espn, Xirp2 and Fscn2) in the HC differentiation process. (c) Plots of average expression profiles for genes that show significant variation over pseudo-time. Genes were clustered into four groups before generating the average profiles (see Methods for details). The groups reflect the different trends observed in c. Topographic lines show where the segments of profiles for individual genes are concentrated along the average trend. (d) Single confocal z-plane through the SC nuclear layer near the lateral edge in a P1 mouse utricle. Several of the SC nuclei (arrows) label with an antibody to Pou4f3 (green, early gene in b). (e) Confocal cross-section through a P1 mouse utricle. Arrow points to a Pou4f3+ SC nucleus. Note that it is located in the SC nuclear layer, suggesting that it is a HC in the early stages of differentiation. All HC soma are counterstained with an antibody to Pvalb (red). (f,g) Confocal images of stereocilia labelled with antibodies to the ‘Late' HC differentiation genes, Xirp2 (f) and Fscn2 (g). Arrows point to small, immature-appearing HCs with little to no Xirp2/Fscn2 antibody labelling. Cuticular plates and stereocilia of larger, more mature-appearing HCs label intensely. Images were taken near the lateral edge. Dashed line in g indicates the line of polarity reversal. S, striola, L, lateral. Scale bars, 20 μm (d,g); 10 μm (e,f).
Figure 6
Figure 6. Examination of HC and SC diversity identifies the striola as a distinct region in P1 utricle.
(a) PCA plot of the 44 cells in HC.iii–iv projected onto PC1 (all expressed genes used for PCA). Expression levels of Ocm in log2(nTPM) are indicated by the black-to-red colour gradient. (b) Plot of the gap statistics from k-means clustering with 1 to 15 clusters. The gap statistic becomes stable at two clusters. Error bars, s.e.m. (c) Heatmap shows k-means clustering of the 44 HC.iii–iv cells identified in the analyses presented in Fig. 2. The top 75 genes identified with PCA (maximum absolute eigenvector values on PC1) were used for clustering. HC.i–ii, which represent transitional cell types, were excluded from the analysis to avoid contamination from SC and TEC genes. The number of clusters was determined to be two from the gap statistic calculation in b. (d) Violin plots of representative, significant genes (FDR<0.05) found by differential expression analysis between clusters containing putative extrastriolar HCs and striolar HCs. (e,f) Immunohistochemistry for striolar HC markers Ocm (known) and Clu (novel). (g) PCA plot of 40 SC.ii projected onto PC1 (all expressed genes used for PCA). Expression levels of Tectb in log2(nTPM) are indicated by the black-to-green colour gradient. (h) Plot of gap statistics shows no clusters are identifiable in SC.ii with this metric. (i) Heatmap shows k-means clustering of differentiated SC.ii identified in the analyses presented in Fig. 2. The top 75 genes identified with PCA (maximum absolute eigenvector values on PC1) were used for clustering. SC.i, which represented transitional cell types, were excluded from the analysis to avoid contamination from TEC genes. (j) Violin plots of representative genes that are significantly differentially expressed (FDR<0.05) between Tectb+ and Tectb− cells. (k,l) Immunohistochemistry of known (Tectb) and novel (Pou3f3) markers of striolar SCs. Scale bars, 200 μm (e,f,k,l).
Figure 7
Figure 7. Single-cell RNA-Seq of cochlear cells reveals broad domains and identifies novel markers of auditory hair cells.
(a) Heatmap representing the k-means clustering of 91 P1 cochlear epithelial cells (x axis) using the top 260 genes (y axis) identified by PCA. Gap statistics identified four cell groups, which based on known marker genes and recorded log2-transformed normalized fluorescent intensities (bottom, x-axis bars), were classified into known cell types (top, x-axis bars): NSC (grey), SC (green) and HC (red). Genes were separated into 10 k-means groups (left, y-axis bars) as specified by gap statistics, and were grouped and colour-coded by their associated enrichment with specific cell groups. Two separate k-group clusters (NSC.i–ii) were identified by less unique expression of gene clusters, including genes known to be differentially expressed in the medial and lateral non-sensory domains of the cochlea. Some cells within the NSC groups had high GFP expression, suggesting they are either from a subdomain of the organ of Corti, or non-sensory cells on the border (see Supplementary Fig. 2). (b) PCA plot of the samples and genes used in a across the first two principle components, depicted with the same cell group colours. (c) Violin plots summarizing the distribution of expression of the housekeeping gene Actb, the HC-specific genes Pou4f3, Myo7a, Pcp4 and two novel genes identified and shown to be specifically expressed in HCs, Rasd2 and Anxa4. (dk) Antibody labelling of HC-specific proteins. Rasd2, localized to the base of stereocilia bundles and cuticular plates, as seen in axial (d), tranverse (e) and wholemount (f,g) views. Anxa4 (h,i) and Pcp4 (j,k) localized to HC membranes and soma, respectively. Scale bars, 10 μm (df,hk); 3 μm (g).
Figure 8
Figure 8. Analysis of GFP+ organ of Corti supporting cells reveals distinct medial and lateral domains.
(a) Heatmap representing the k-means clustering for 52 FACS-enriched P1 GFP+ organ of Corti SCs (x axis) using the top 50 genes (y axis) identified by PCA. Gap statistics identified three sample groups (top, x-axis bars) and five gene groups (left, y-axis bars), which were labelled and colour-coded according to the expression of known markers within medial (Med) SC (teal) and lateral (Lat) SC (turquoise). Two Lat SC groups (i–ii) were identified based on varying expression of the same gene clusters. (b) Violin plots summarizing the distribution of expression of both known and novel genes across the two major k-groups (Med SC and Lat SC (i–ii)). (c,d) Antibody labelling of Cdh4 protein, showing specific expression within the cell membrane of cells within the medial domain. (e,f) Antibody (e) labelling and in situ hybridization with Myo7a antibody labelling overlay (f) of Mia1/Mia1, which shows expression within the medial sensory domain and surrounding non-sensory domains. (g,h) Sparcl1 also shows a distinct medial domain expression pattern. (i,j) Antibody labelling of Cntn1, which shows labelling in lateral domain SCs consistent with b, as well as in the spiral ganglion neurites (i, arrowhead indicating inner HC innervation), which by comparison with SCs, co-label with Tuj1 (j, arrowhead). Shown are orthogonal (c,e,g,i,f) and whole-mount (d,h,j) views. Scale bars, 10 μm (cj).
Figure 9
Figure 9. Inter-organ comparisons of single cells reveal differences between complementary cell types.
(a) Three-dimensional PCA plot of utricular and cochlear cells (only differentiated, non-fate-transitioning utricular cells were included) onto PC1, PC2 and PC4. PC3 segregated similar cells as PC4, but to a lesser extent. See Supplementary Movie 1 for alternative angles of the three-dimensional plot. (b) Projections of cells onto each PC. HCs segregate from all other cells along PC1 while PC2 segregates utricular cells from cochlear cells. PC4 indicates that utricular SCs project closer to cochlear NSCs and SCs than to TECs. (c) Differential expression analysis across cell groups from each organ reveals genes that are shared or highly enriched within each organ. The Venn diagram shows genes that are expressed in >10 cells from one organ but no cells from the other (for all genes, FDR<0.05 and specificity score=1). See Methods for details on calculation of specificity score. The 71 shared genes were genes that failed to reach significance and found to be expressed in all cells from both organs. (d) Comparison of differential gene expression for cochlear (red) and utricular (yellow) HCs. Violin plots show highly specific genes enriched in each cell type (specificity score=1 for all genes).

References

    1. Doetzlhofer A. et al. Hey2 regulation by FGF provides a Notch-independent mechanism for maintaining pillar cell fate in the organ of Corti. Dev. Cell 16, 58–69 (2009). - PMC - PubMed
    1. Eatock R. A. & Songer J. E. Vestibular hair cells and afferents: two channels for head motion signals. Annu. Rev. Neurosci. 34, 501–534 (2011). - PubMed
    1. Kelley M. W. Regulation of cell fate in the sensory epithelia of the inner ear. Nat. Rev. Neurosci. 7, 837–849 (2006). - PubMed
    1. Groves A. K. & Fekete D. M. Shaping sound in space: the regulation of inner ear patterning. Development 139, 245–257 (2012). - PMC - PubMed
    1. Fettiplace R. & Hackney C. M. The sensory and motor roles of auditory hair cells. Nat. Rev. Neurosci. 7, 19–29 (2006). - PubMed

Publication types

Associated data