

Delayed clearance of triglyceride-rich lipoproteins in young, healthy obese subjects
- PMID: 26469529
- PMCID: PMC5111784
- DOI: 10.1111/cob.12118
Delayed clearance of triglyceride-rich lipoproteins in young, healthy obese subjects
Abstract
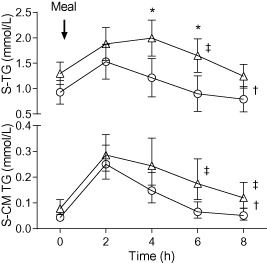
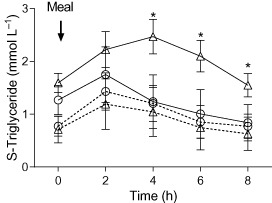
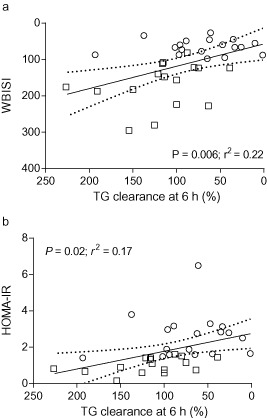
Obesity is associated with the metabolic syndrome. The aims were, first, to study the postprandial triglyceride clearance in young, healthy obese subjects and, second, to investigate if fasting triglycerides can predict delayed postprandial triglyceride clearance. Eighteen apparently healthy, obese subjects with no clinical signs of metabolic disturbances participated. Controls were age- and sex-matched, healthy, normal weight subjects. Subclinical markers of metabolic disturbances were assessed by measuring postprandial triglycerides in serum and in chylomicrons by oral fat tolerance test. Postprandial triglyceride clearance for 8 h was assessed indirectly as removal of the lipid from serum during the oral fat tolerance test. Insulin resistance was measured by the homeostasis model assessment of insulin resistance (HOMA-IR). Twelve (66%) of the apparently healthy obese individuals had insulin resistance measured by HOMA-IR. There was a delayed clearance of serum triglycerides and chylomicron triglycerides at 6 h when compared with the control group, while, at 8 h, the differences were only detected for the chylomicron triglyceride clearance. Triglyceride response was significantly greater in the obese subjects. Fasting triglycerides in upper normal level predicted a delayed postprandial triglyceride clearance and insulin resistance. In young, apparently healthy obese subjects early metabolic disturbances including insulin resistance and delayed postprandial triglyceride clearance can be detected. Fasting serum triglyceride in upper normal level predicted delayed postprandial triglyceride clearance and insulin resistance.
Keywords: Chylomicrons; fasting triglycerides; insulin resistance; metabolic healthy obese.
© 2015 World Obesity.
Figures
Similar articles
-
Influence of obesity and body fat distribution on postprandial lipemia and triglyceride-rich lipoproteins in adult women.J Clin Endocrinol Metab. 1999 Jan;84(1):184-91. doi: 10.1210/jcem.84.1.5397. J Clin Endocrinol Metab. 1999. PMID: 9920081
-
Leptin to adiponectin ratio - A surrogate biomarker for early detection of metabolic disturbances in obesity.Nutr Metab Cardiovasc Dis. 2018 Nov;28(11):1114-1121. doi: 10.1016/j.numecd.2018.06.020. Epub 2018 Jul 3. Nutr Metab Cardiovasc Dis. 2018. PMID: 30145019
-
Postprandial dyslipidemia in men with visceral obesity: an effect of reduced LDL receptor expression?Am J Physiol Endocrinol Metab. 2001 Sep;281(3):E626-32. doi: 10.1152/ajpendo.2001.281.3.E626. Am J Physiol Endocrinol Metab. 2001. PMID: 11500319
-
Postprandial triglycerides and endothelial function.Exp Clin Endocrinol Diabetes. 2001;109(4):S533-47. doi: 10.1055/s-2001-15116. Exp Clin Endocrinol Diabetes. 2001. PMID: 11453041 Review.
-
Triglyceride-rich lipoproteins and atherosclerosis, from fast to feast.Ann Med. 1993 Oct;25(5):431-5. doi: 10.3109/07853899309147307. Ann Med. 1993. PMID: 8251140 Review.
Cited by
-
Barberry in the treatment of obesity and metabolic syndrome: possible mechanisms of action.Diabetes Metab Syndr Obes. 2018 Nov 8;11:699-705. doi: 10.2147/DMSO.S181572. eCollection 2018. Diabetes Metab Syndr Obes. 2018. PMID: 30519065 Free PMC article. Review.
-
Postprandial leptin and adiponectin in response to sugar and fat in obese and normal weight individuals.Endocrine. 2019 Dec;66(3):517-525. doi: 10.1007/s12020-019-02102-9. Epub 2019 Oct 11. Endocrine. 2019. PMID: 31605363
-
The role of apheresis and insulin therapy in hypertriglyceridemic acute pancreatitis-a concise review.BMC Gastroenterol. 2023 Oct 3;23(1):341. doi: 10.1186/s12876-023-02957-3. BMC Gastroenterol. 2023. PMID: 37789261 Free PMC article. Review.
-
Postprandial triglyceride levels rather than fat distribution may reflect early signs of disturbed fat metabolism in Iraqi immigrants.Lipids Health Dis. 2022 Aug 4;21(1):68. doi: 10.1186/s12944-022-01679-x. Lipids Health Dis. 2022. PMID: 35927727 Free PMC article.
-
Recreational football practice attenuates postprandial lipaemia in normal and overweight individuals.Eur J Appl Physiol. 2018 Feb;118(2):261-270. doi: 10.1007/s00421-017-3766-y. Epub 2017 Dec 6. Eur J Appl Physiol. 2018. PMID: 29214463 Clinical Trial.
References
-
- James WP. A public health approach to the problem of obesity. Int J Obes Relat Metab Disord 1995; 19(Suppl. 3): S37–S45. - PubMed
-
- Tonstad S, Despres JP. Treatment of lipid disorders in obesity. Expert Rev Cardiovasc Ther 2011; 9: 1069–1080. - PubMed
-
- Zilversmit DB. Atherogenesis: a postprandial phenomenon. Circulation 1979; 60: 473–485. - PubMed
Publication types
MeSH terms
Substances
LinkOut - more resources
Full Text Sources
Other Literature Sources
Medical
