. 2015 Oct 15:6:8563.
doi: 10.1038/ncomms9563.

Liquid exfoliation of solvent-stabilized few-layer black phosphorus for applications beyond electronics

Affiliations

Liquid exfoliation of solvent-stabilized few-layer black phosphorus for applications beyond electronics

Damien Hanlon et al. Nat Commun. .

Abstract

Few-layer black phosphorus (BP) is a new two-dimensional material which is of great interest for applications, mainly in electronics. However, its lack of environmental stability severely limits its synthesis and processing. Here we demonstrate that high-quality, few-layer BP nanosheets, with controllable size and observable photoluminescence, can be produced in large quantities by liquid phase exfoliation under ambient conditions in solvents such as N-cyclohexyl-2-pyrrolidone (CHP). Nanosheets are surprisingly stable in CHP, probably due to the solvation shell protecting the nanosheets from reacting with water or oxygen. Experiments, supported by simulations, show reactions to occur only at the nanosheet edge, with the rate and extent of the reaction dependent on the water/oxygen content. We demonstrate that liquid-exfoliated BP nanosheets are potentially useful in a range of applications from ultrafast saturable absorbers to gas sensors to fillers for composite reinforcement.


Figures

Figure 1
Figure 1. Basic characterization of exfoliated black phosphorous.
(a) Structure of black phosphorus (BP). (b) SEM image of a layered BP crystal (scale bar, 100 μm). (c) Photograph of a dispersion of exfoliated FL-BP in CHP. (df) Representative low-resolution transmission electron microscopy (TEM) images of FL-BP exfoliated in N-cyclohexyl-2-pyrrolidone (CHP) (scale bars in df: 500, 100 and 500 nm). (g) Bright-field scanning transmission TEM (STEM) image and (h) Butterworth-filtered high-angle annular dark field (HAADF) STEM image of FL-BP (exfoliated in isopropanol) showing the intact lattice (scale bars in g and h, 2 and 1 nm). (i) Nanosheet length histogram of the exfoliated FL-BP obtained from TEM (sample size=239). (j) Extinction, absorbance, scattering coefficient spectra of FL-BP in CHP. (k) Concentration of FL-BP as a function of sonication time. The dashed line shows power law behaviour with exponent 0.4. (l) Raman spectrum (mean of 100 spectra, excitation 633 nm) of a filtered dispersion. Inset: scanning electron microscopic image of thin film (scale bar, 2 μm). (m) X-ray photoelectron spectroscopy P core-level region.
Figure 2
Figure 2. Characterization of individual nanosheets.
(ac) Representative atomic force microscopic (AFM) images (scale bars in a, b and c: are 500, 200 and 1000, nm). (d) Height profile of the nanosheet in the inset along the line showing clearly resolvable steps, each consisting of multiple monolayers (scale bar, 500 nm). (e) Heights of >70 steps of deposited FL-BP nanosheets in ascending order. The step height clustered in groups and is always found to be a multiple of ∼2 nm, which is the apparent height of one monolayer. The mean height for each group (the error is the sum of the mean step height error and the s.d. in step height within a given group) is plotted in ascending order in the inset with the slope giving a mean monolayer step height of 2.06±0.18 nm. (f) Plot of number of layers per nanosheet (obtained by dividing the apparent height by the step height) as a function of flake area determined from AFM. The dashed line indicates formula image 
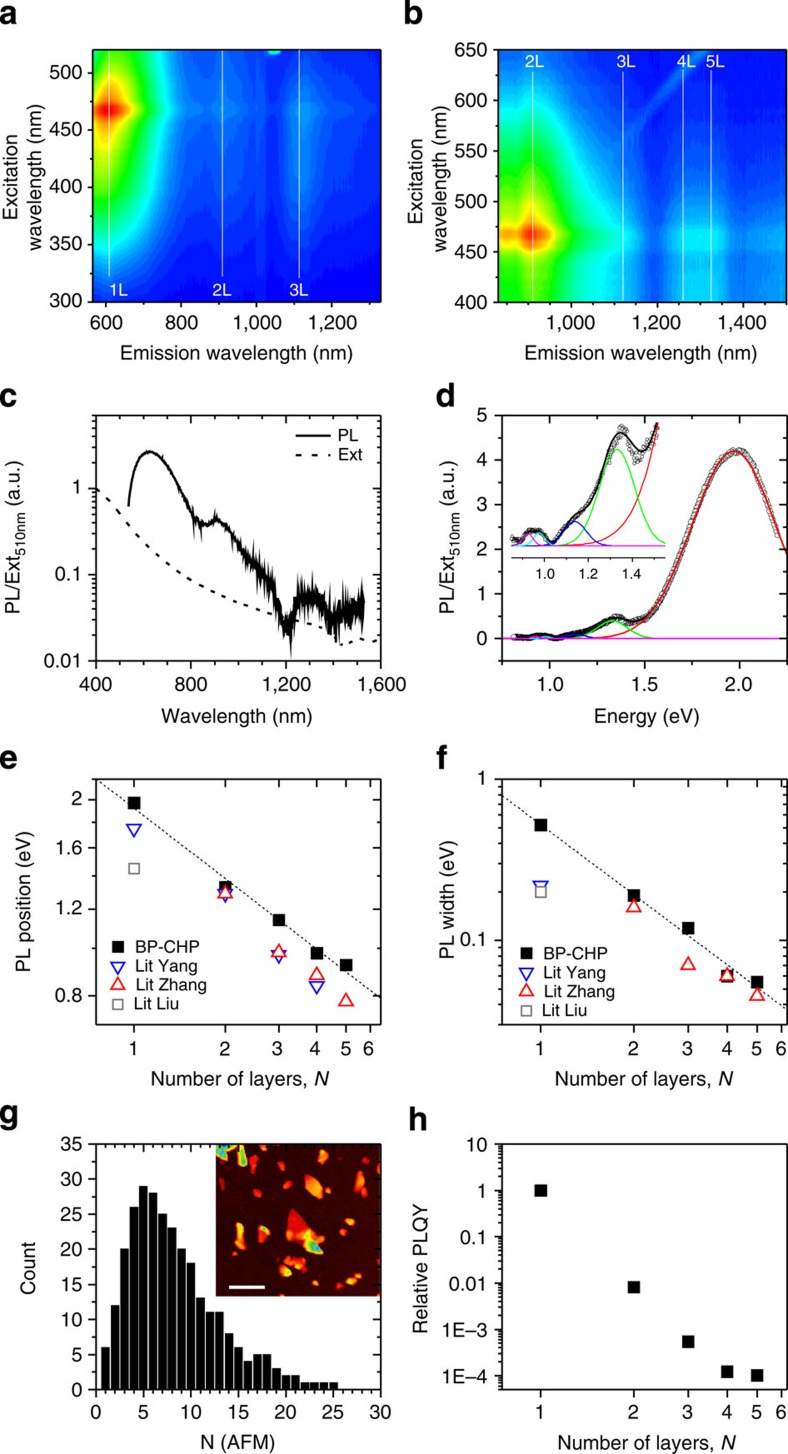
behaviour. (g) Histogram of number of monolayers per nanosheet (sample size=126). The mean number of layers is determined as 9.4±1.3 nm (where the error is due to the uncertainty in the step height analysis and the s.e. of the distribution). (h,i) Large area AFM image (h, scale bar, 1 μm) and Raman A1g intensity map (i, excitation wavelength 633 nm) of the same sample region. (j) Raman spectra (normalized to Ag2) of the nanosheets indicated in h and i (the numbers labelling the spectra in j correspond to the nanosheets marked by numbers in h and i). (k) Histogram of the intensity ratio of the Ag1/Ag2 modes obtained from the analysis of 120 baseline-corrected spectra acquired over an area of 25 × 25 μm2 (sample size=120) The absence of spectra with an intensity ratio <0.6 strongly suggests that no basal plane oxidation has occurred.
Figure 3
Figure 3. Size dependence of optical properties of exfoliated Black Phosphorous.
(ac) TEM length histograms of size-selected FL-BP in CHP including representative TEM images as insets (scale bars in ac: 100, 200 and 200 nm). Sample sizes in ac are 131, 111 and 140, respectively. (d) Extinction (ɛ) spectra normalized to 355 nm of FL-BP dispersions with different mean nanosheet lengths showing systematic changes as a function of size. Extinction spectra can be split into contributions from absorbance (α) and scattering (σ). (e) Absorbance spectra of the same dispersions (normalized to 340 nm) and (f) scattering spectra. Scattering spectra were obtained by subtracting the absorbance spectra from the normalized extinction spectra.
Figure 4
Figure 4. Photoluminescence of dispersed black phosphorous nanosheets.
(a,b) Photoluminescence emission–excitation contour maps measured on a size-selected BP dispersion in CHP exfoliated under inert gas conditions (see Methods) measured with a 550 nm and 830 nm cut-off filter in emission, respectively. (c) Photoluminescence line spectrum (wavelength, λexc=510 nm) for this BP dispersion in CHP. Also shown is the extinction spectrum for this dispersion as dashed line. (d) PL line spectrum, plotted versus photon energy, fitted to five Gaussian lines, representing the PL contributions from 1-, 2-, 3-, 4- and 5-layer nanosheets. (e,f) Position (e) and width (f) of fit lines shown in d, plotted versus layer number. The dashed lines in e,f show power law decays with exponents of −0.48 and −1.4, respectively. Also shown in e,f are data for mechanically cleaved BP nanosheets taken from Yang et al., Zhang et al. and Liu et al. (g) AFM image (inset, scale bar 500 nm) and statistical analysis of nanosheet thickness (expressed as layer number, sample size=281) for the samples used to measure PL. (h) Relative PL quantum yield (by integrated PL area) as a function of layer number.
Figure 5
Figure 5. Stability of exfoliated black phosphorous nanosheets.
(a,b) Relative absorbance at 465 nm, measured as a function of time, for (a) the standard FL-BP dispersion (std-BP) exfoliated in CHP, NMP and IPA, as well as BP exfoliated in CHP in a glovebox (CHP GB) and (b) std-BP in CHP compared with size-selected dispersions containing small (S-BP) and large nanosheets (L-BP). The dashed lines represent exponential decays: A=AUnRe+AReet/τ, where ARe represents the component of BP, which reacts with water/O2, AUnRe represents the unreacted component and τ represents the reaction timescale. (c) Reaction timescale, τ, plotted versus the fraction of BP which reacts, ARe/AUnRe+ARe, for a number of different systems. (d) Fitted time-dependent absorbance (465 nm) data for std-BP in CHP and std-BP dispersions with 3 vol% and 12.5 vol% of water added. (e) Plot of τ versus volume fraction of added water. The inset shows the fraction of unstable BP plotted versus water content. The dashed line demonstrates this fraction to scale initially linearly with water content. (f) Plot of τ versus ARe/AUnRe+ARe for BP exfoliated in CHP with and without the addition of water. (g) Sequence of AFM images of the same sample region of an as-prepared sample, and after 1, 4 and 11 days of exposure to ambient conditions, respectively (scale bar, 600 nm). Errors in c,e,f are statistical errors associated with the fits. (h) Map showing both fractional length, L, and width, w, changes as measured by AFM immediately after exfoliation after day 4. Negative values of Δw/w0 and ΔL/L0 indicate that the nanosheets are getting smaller over time. (i) Mean Raman spectra (633 nm excitation) summed over the same sample region of an as-prepared sample, after 4 days and 11 days, respectively. Spectra are normalized to the silicon peak at 521 cm−1. Inset: Raman A1g intensity map of the sample region (freshly prepared and after 11 days). (j) TEM images of the same flake deposited from a freshly prepared dispersion and after 16 days.
Figure 6
Figure 6. Reactivity of solvent-stabilized Black Phosphorous with water.
(a) Edge selective degradation model for BP exposed to pure neutral water. Top and bottom panel represent reagent (BP edge+three water molecules) and reaction products (BP defective edge+phosphine+phosphorous acid), respectively, with the reaction energy also given. Green, red and white balls represent P, O and H atoms, respectively. (b) Experimental data for amount of reacted phosphorus and water, respectively, as a function of time for std-BP GB in CHP after addition of 3 vol% of water. The data was obtained from tracking both water and BP concentrations by ultraviolet–visible spectroscopy (see Supplementary Note 3). (c) Molar ratio of water/BP as a function of time measured for a std-BP GB dispersion in CHP after addition of 3 and 10 vol% of water. The molar ratio is centred at 2–3, which is reasonably consistent with the proposed edge degradation reaction.
Figure 7
Figure 7. Applications of liquid-exfoliated FL-BP.
(a,b) Sensing of NH3 gas using std-BP films. (a) Sensor response plot shows percentile resistance change versus time of the FL-BP films with a bias voltage of 1 V at room temperature, on consequent NH3 exposures at various concentrations from 1 to 10 p.p.m. (b) Plot of signal-to-noise ratio as a function of NH3 concentration from 1 to 3 p.p.m. The error bar represents the s.d. of five devices and the linear line indicates the fitted line. (ce) Saturable absorption of std-BP and graphene in CHP for fematosecond pulses excited at (c) 1,030 nm and (d) 515 nm. Linear transmission T0 is given in the legend. (e) Saturation intensity of FL-BP and graphene as a function of T0. (f) Representative stress–strain curves for PVC and PVC: FL-BP (0.3 vol%). Inset: low strain regime. (gi) Young's modulus, including the theoretical constant-strain rule-of-mixtures modulus prediction (blue using the Voigt–Reuss–Hill planar-averaged nanosheet modulus, blue-dashed using its Voigt and Reuss bounds) (g), tensile strength (h) and tensile toughness (i) plotted as a function of FL-BP volume fraction. (j) Calculated orientation dependence of the in-plane two-dimensional Young's modulus (YBP, blue) and Poisson's ratio (ν, red), of black phosphorus, together with the Voigt–Reuss–Hill averaged in-plane modulus (<YBP>, black). Errors in b,e,gi are statistical errors associated with the fits.

References

    1. Geim A. K. Graphene: status and prospects. Science 324, 1530–1534 (2009). - PubMed
    1. Novoselov K. S. et al.. A roadmap for graphene. Nature 490, 192–200 (2012). - PubMed
    1. Ferrari A. C. et al.. Science and technology roadmap for graphene, related two-dimensional crystals, and hybrid systems. Nanoscale 7, 4598–4810 (2015). - PubMed
    1. Chhowalla M. et al.. The chemistry of two-dimensional layered transition metal dichalcogenide nanosheets. Nat. Chem. 5, 263–275 (2013). - PubMed
    1. Osada M. & Sasaki T. Exfoliated oxide nanosheets: new solution to nanoelectronics. J. Mater. Chem. 19, 2503–2511 (2009).

Publication types