. 2015 Oct 15:5:15287.
doi: 10.1038/srep15287.

Identification of novel sRNAs involved in biofilm formation, motility, and fimbriae formation in Escherichia coli

Affiliations

Identification of novel sRNAs involved in biofilm formation, motility, and fimbriae formation in Escherichia coli

Geunu Bak et al. Sci Rep. .

Abstract

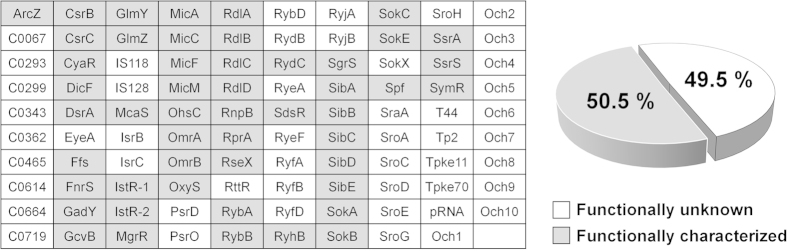
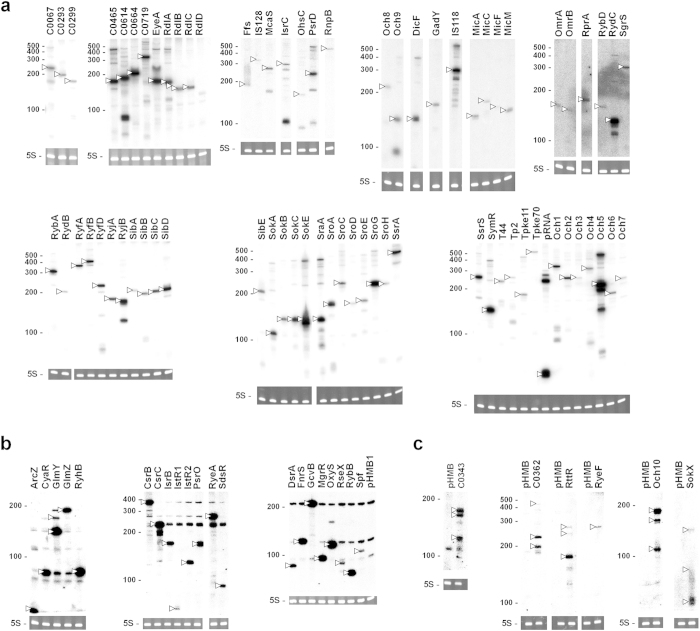
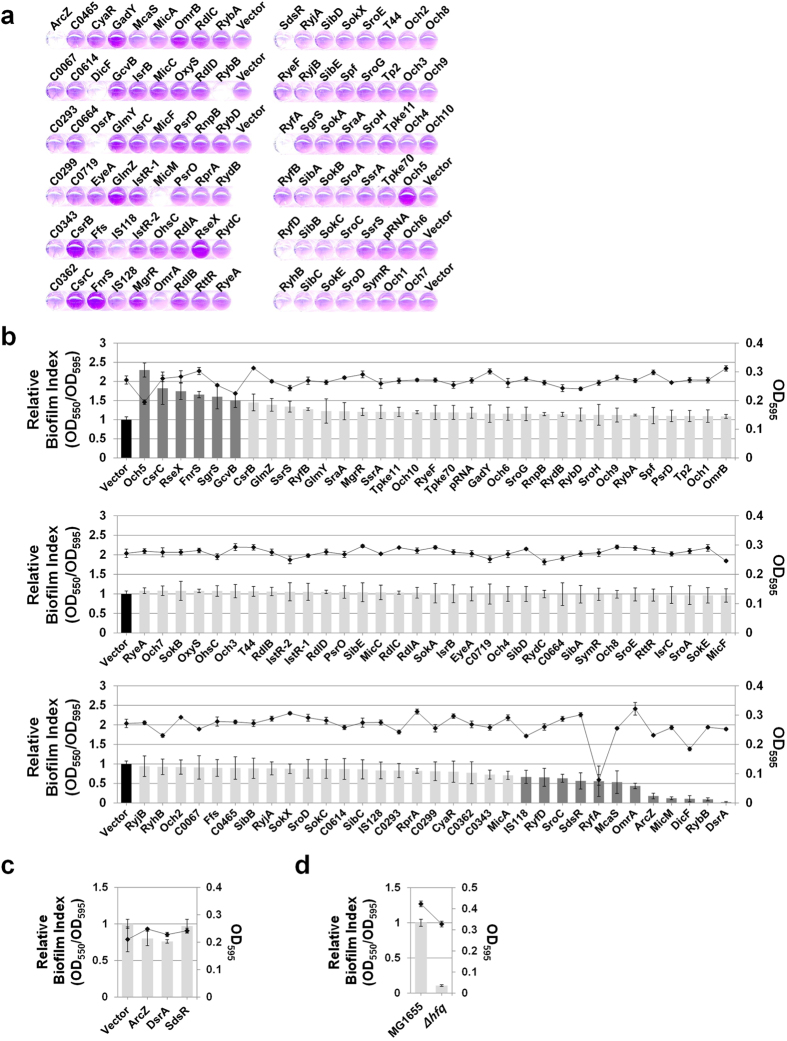
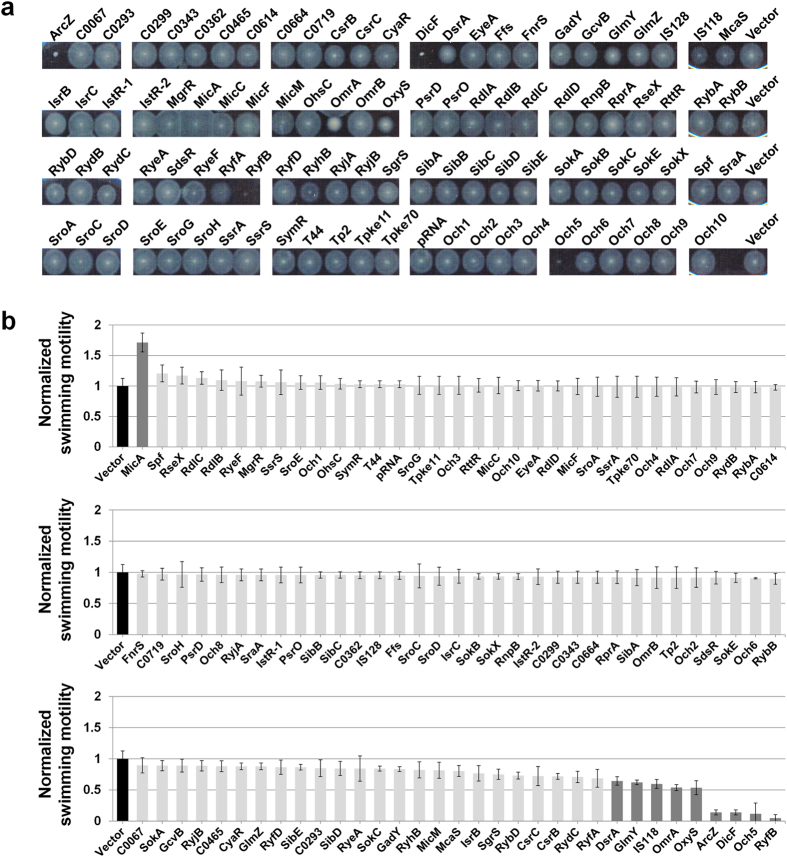
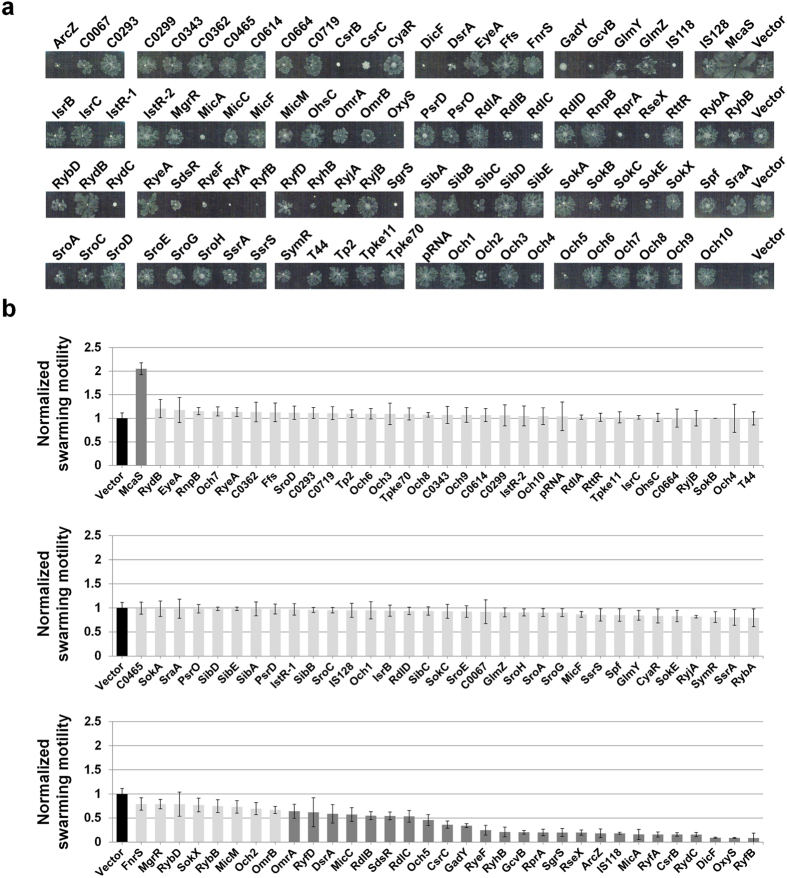
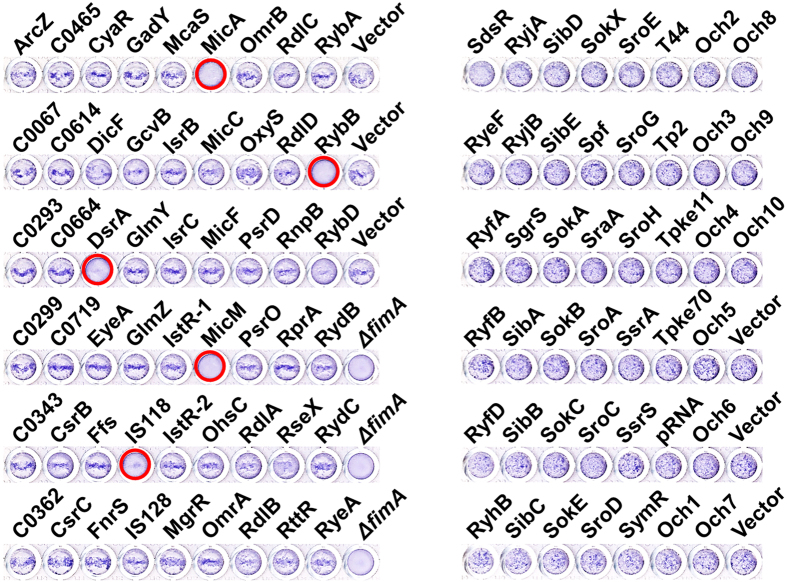
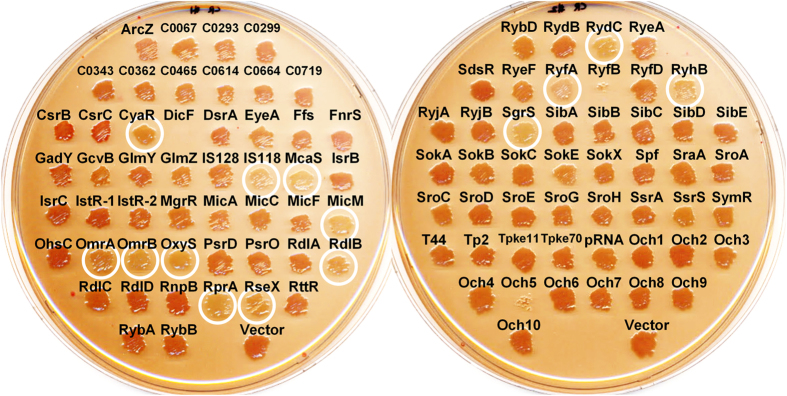
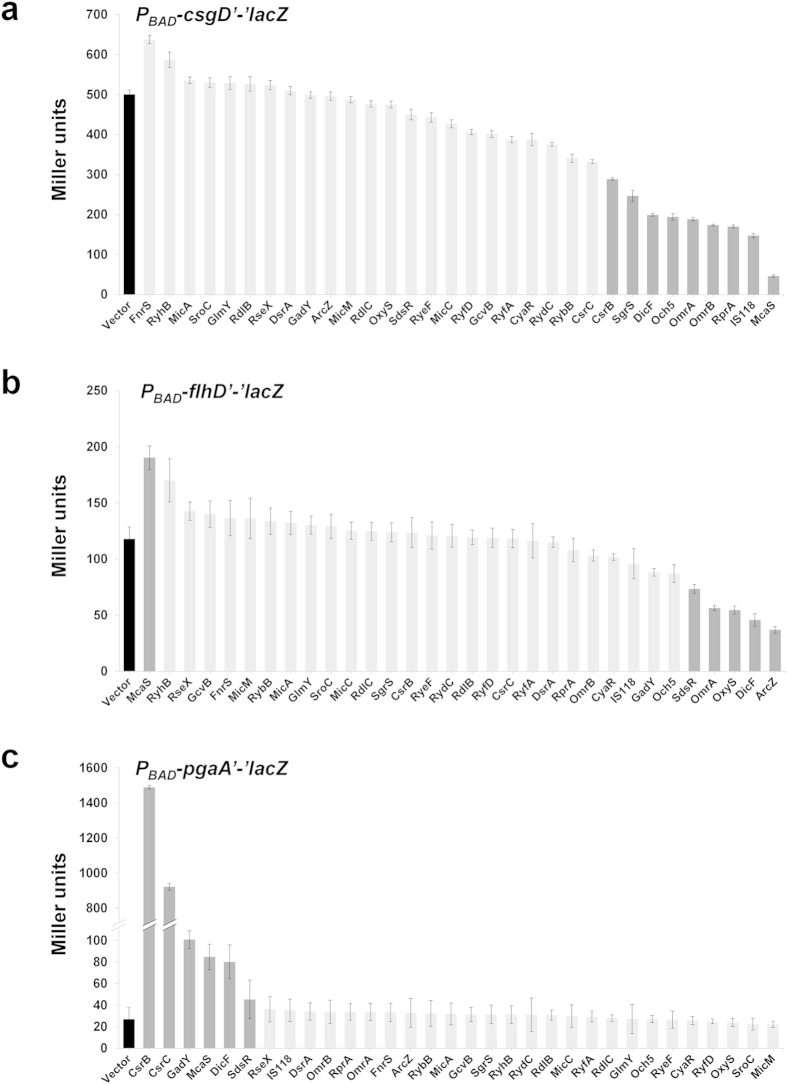
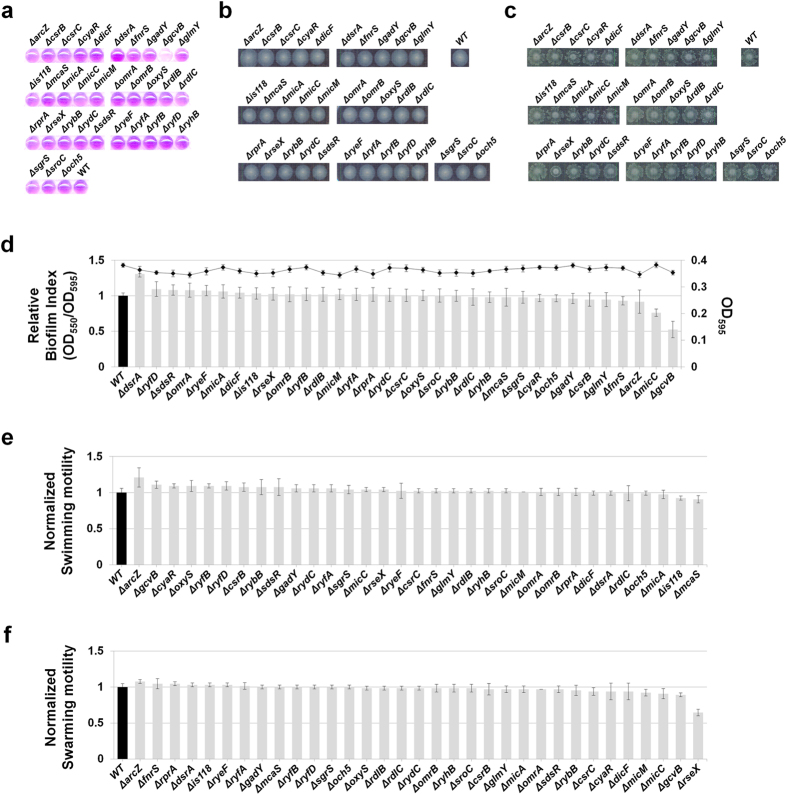
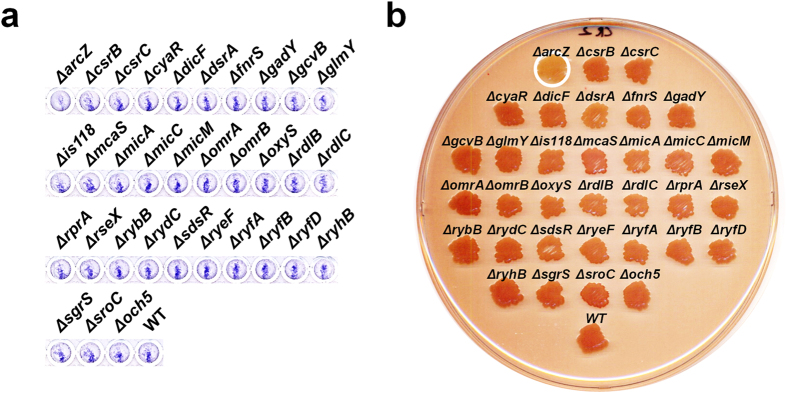
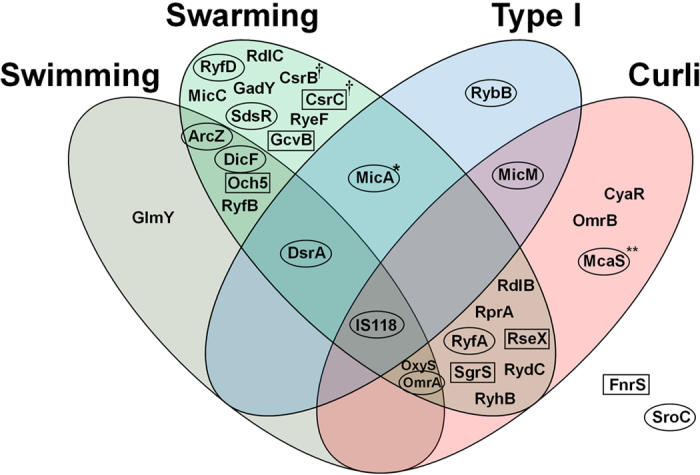
Bacterial small RNAs (sRNAs) are known regulators in many physiological processes. In Escherichia coli, a large number of sRNAs have been predicted, among which only about a hundred are experimentally validated. Despite considerable research, the majority of their functions remain uncovered. Therefore, collective analysis of the roles of sRNAs in specific cellular processes may provide an effective approach to identify their functions. Here, we constructed a collection of plasmids overexpressing 99 individual sRNAs, and analyzed their effects on biofilm formation and related phenotypes. Thirty-three sRNAs significantly affecting these cellular processes were identified. No consistent correlations were observed, except that all five sRNAs suppressing type I fimbriae inhibited biofilm formation. Interestingly, IS118, yet to be characterized, suppressed all the processes. Our data not only reveal potentially critical functions of individual sRNAs in biofilm formation and other phenotypes but also highlight the unexpected complexity of sRNA-mediated metabolic pathways leading to these processes.


Figures

Figure 1
Figure 1. E. coli small RNAs used in this study. sRNA-expressing plasmids were constructed for 99 experimentally validated sRNAs.
sRNAs whose functions were previously characterized are shown in gray. Full references for each sRNA were provided in Supplementary Table 1.
Figure 2
Figure 2. Northern blot analysis of overexpressed sRNAs. MG1655 cells containing each sRNA-expressing plasmid were grown to OD600 ~ 0.6, and induced with 1.0 mM IPTG for 20 min.
Total RNAs (10 μg) were subjected to northern blot. Membranes were probed with rnpBXb1 (a), specific oligonucleotide mixes (b), or each specific oligonucleotide (c). RNA sizes were estimated using Century marker (Ambion), indicated on the left. 5S rRNA stained with ethidium bromide was also used as a loading control. Overexpressed sRNAs are marked by arrowheads.
Figure 3
Figure 3. Effects of small RNA overexpression on biofilm formation in E. coli.
(a) To characterize the biofilm forming ability of E. coli overexpressing sRNAs, a collection of strains containing each sRNA-expressing plasmid were grown in LB containing 1 mM IPTG and 100 μg/mL ampicillin at 30 °C for 12 h, and the amount of biofilm attached to 96-well round bottom polystyrene microtiter plates was measured via crystal violet staining. (b) The level of biofilm formation (OD550) was expressed relative to cell growth (OD595), and termed ‘biofilm index’. The biofilm index value was normalized to control cells containing plasmid vector (pHMB1) and designated ‘relative biofilm index’. (c) Effects of ArcZ, DsrA, and SdsR sRNAs on biofilm formation in the MG1655Δhfq background. (d) Comparison of relative biofilm formation by MG1655 and MG1655Δhfq strains. Relative biofilm indexes are shown on a bar graph (axis on the left) and the growth of each strain as a line graph (axis on the right).
Figure 4
Figure 4. Effects of sRNA overexpression on swimming motility.
(a) Swimming motility was investigated on soft agar plates (0.3% Bacto Agar, 1% tryptone, 0.5% NaCl) containing 1 mM IPTG and 100 μg/mL ampicillin. Assays were performed at 30 °C for 12 h. A representative image of at least three independent experimental sets is shown. (b) The diameter of the swimming circle was compared to that of the control strain harboring the pHMB1 vector. Results are presented as the average of at least three separate experiments and error bars represent standard deviation. Normalized motility of the control strain is indicated with a black bar, and strains displaying >1.5-fold changes with a dark grey bar.
Figure 5
Figure 5. Effects of sRNA overexpression on swarming motility.
(a) Swarming motility was investigated on soft agar plates (0.6% Eiken Agar, 0.5% glucose, 1% tryptone, 0.5% yeast extract, 0.5% NaCl) containing 1 mM IPTG and 100 μg/mL ampicillin. Overnight cultures of MG1655 cells harboring each sRNA-expressing plasmid were inoculated onto plates and incubated at 37 °C for 16 h. A representative image of at least three independent experimental sets is shown. (b) The distance of the swarming branch was measured and compared to the distance of control strain harboring the pHMB1 vector. Results are presented as the average of at least three separate experiments and the error bars represent standard deviation. Normalized motility of the control strain is indicated with a black bar, and strains displaying >1.5-fold changes with a dark grey bar.
Figure 6
Figure 6. Effects of sRNA overexpression on type I fimbriae phenotypes.
Formation of mannose-specific type I fimbriae was determined by the ability of each strain to agglutinate yeast cells. Strains were grown in LB containing 1 mM IPTG and 100 μg/mL ampicillin without shaking at 37oC and mixed with the same volume of yeast suspension (0.5% w/v, PBS) in a 96-well titer plate. Crystal violet was added to enhance observation. The data are representative of at least three independent experiments. The ΔfimA strain was used as a type I fimbriae-deficient control. Strains that appeared type I fimbriae-deficient are indicated with circles.
Figure 7
Figure 7. Effects of sRNA overexpression on curli fimbriae phenotype.
Strains harboring the sRNA library were assayed on a Congo red agar plate (LB agar without NaCl containing 1 mM IPTG, 100 μg/mL ampicillin, 40 μg/mL Congo red, 20 μg/mL Coomassie blue) to evaluate expression of curli fimbriae. Overnight cultures were streaked on agar plates and grown at 28 °C for 48 h. Strains showing curli fimbriae deficiency are indicated with white circles.
Figure 8
Figure 8. Effects of overexpressed sRNAs on expression of csgD’-, flhD’-, and pgaA’-‘lacZ translational fusions.
E. coli GSO559 (PBAD-csgD’-‘lacZ) (a), GSO563 (PBAD-flhD’-‘lacZ) (b), and GSO567 (PBAD-pgaA’-‘lacZ ) (c) were treated with arabinose and IPTG. β-galactosidase activities were measured after the arabinose and IPTG induction. Cells overexpressing RyfB were not used for β-galactosidase due to their severe growth defect. Results are presented as the average of at least three independent experiments and error bars correspond to standard deviation. The control strains carrying the vector are indicated with a black bar, and strains displaying >1.5-fold changes with a dark grey bar.
Figure 9
Figure 9. Biofilm formation and swimming/swarming motility in strains lacking sRNAs.
Biofilm formation and swimming/swarming motility were analyzed in strains lacking each of 33 sRNAs, which were shown to significantly affect biofilm formation and related phenotypes. sRNA knock-out strains containing the RNA expression vector were tested under the same experimental conditions employed with sRNA-overexpressing cells. Biofilm formation (a,d), and swimming (b,e) and swarming motility (c,f).
Figure 10
Figure 10. Type I fimbriae and curli fimbriae formation in strains lacking sRNAs.
sRNA knock-out strains containing the RNA expression vector were tested under the same experimental conditions employed with sRNA-overexpressing cells. Type I fimbriae (a) and curli fimbriae (b).
Figure 11
Figure 11. Venn diagram of sRNAs differentially affecting biofilm formation and related phenotypes.
sRNAs that increase and decrease biofilm formation >1.5-fold are shown in boxes and ellipses, respectively. All sRNAs except for MicA and McaS in the Venn diagram inhibit one or more biofilm-related phenotypes. MicA that increases swimming motility >1.5-fold is marked ‘*’, McaS that increases swarming motility >1.5-fold ‘**’, and CsrB and CsrC that generate more reddish color on Congo red plates ‘†’. FnrS and SroC shown outside the Venn diagram affected biofilm formation positively and negatively, respectively, without affecting the biofilm-related phenotypes.

References

    1. Rivas E., Klein R. J., Jones T. A. & Eddy S. R. Computational identification of noncoding RNAs in E. coli by comparative genomics. Curr Biol. 11, 1369–1373 (2001). - PubMed
    1. Argaman L. et al. Novel small RNA-encoding genes in the intergenic regions of Escherichia coli. Curr Biol. 11, 941–950 (2001). - PubMed
    1. Chen S. et al. A bioinformatics based approach to discover small RNA genes in the Escherichia coli genome. Biosystems. 65, 157–177 (2002). - PubMed
    1. Vogel J. et al. RNomics in Escherichia coli detects new sRNA species and indicates parallel transcriptional output in bacteria. Nucleic Acids Res. 31, 6435–6443 (2003). - PMC - PubMed
    1. Zhang A. et al. Global analysis of small RNA and mRNA targets of Hfq. Mol Microbiol. 50, 1111–1124 (2003). - PubMed

Publication types

LinkOut - more resources