. 2015 Dec;12(6):066012.
doi: 10.1088/1741-2560/12/6/066012. Epub 2015 Oct 15.

Local field potential recordings in a non-human primate model of Parkinsons disease using the Activa PC + S neurostimulator

Affiliations

Local field potential recordings in a non-human primate model of Parkinsons disease using the Activa PC + S neurostimulator

Allison T Connolly et al. J Neural Eng. 2015 Dec.

Abstract

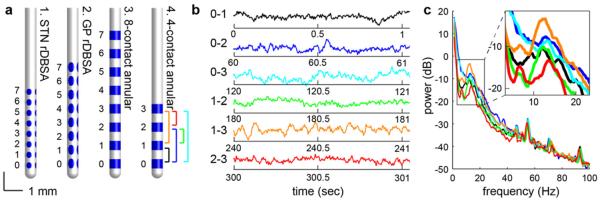
Objective: Using the Medtronic Activa® PC + S system, this study investigated how passive joint manipulation, reaching behavior, and deep brain stimulation (DBS) modulate local field potential (LFP) activity in the subthalamic nucleus (STN) and globus pallidus (GP).

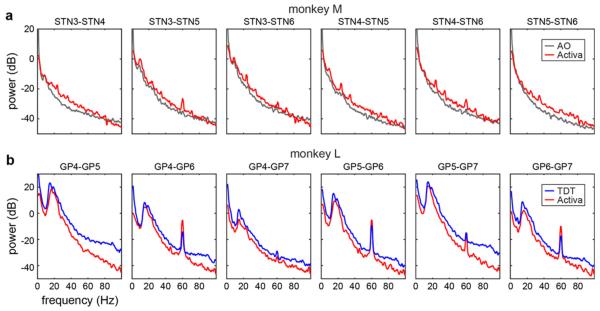
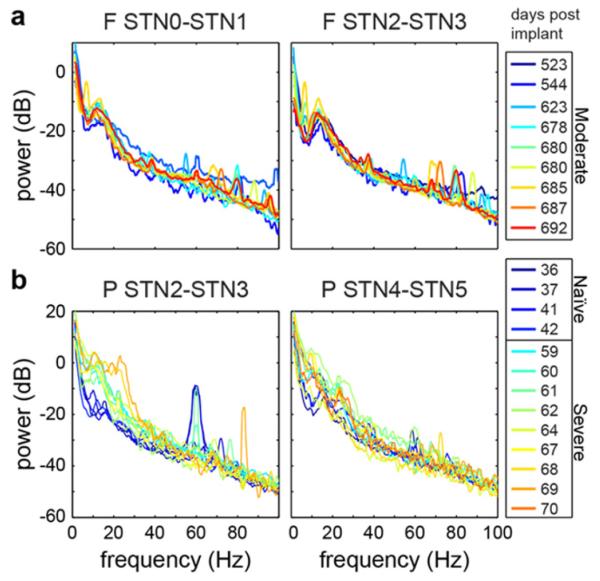
Approach: Five non-human primates were implanted unilaterally with one or more DBS leads. LFPs were collected in montage recordings during resting state conditions and during motor tasks that facilitate the expression of parkinsonian motor signs. These recordings were made in the naïve state in one subject, in the parkinsonian state in two subjects, and in both naïve and parkinsonian states in two subjects.

Main results: LFPs measured at rest were consistent over time for a given recording location and parkinsonian state in a given subject; however, LFPs were highly variable between subjects, between and within recording locations, and across parkinsonian states. LFPs in both naïve and parkinsonian states across all recorded nuclei contained a spectral peak in the beta band (10-30 Hz). Moreover, the spectral content of recorded LFPs was modulated by passive and active movement of the subjects' limbs. LFPs recorded during a cued-reaching task displayed task-related beta desynchronization in STN and GP. The bidirectional capabilities of the Activa® PC + S also allowed for recording LFPs while delivering DBS. The therapeutic effect of STN DBS on parkinsonian rigidity outlasted stimulation for 30-60 s, but there was no correlation with beta band power.

Significance: This study emphasizes (1) the variability in spontaneous LFPs amongst subjects and (2) the value of using the Activa® PC + S system to record neural data in the context of behavioral tasks that allow one to evaluate a subject's symptomatology.


Figures

Figure 1
Figure 1
(a) Four types of DBS leads were implanted in the five monkeys, denoted as leads 1–4 (here, and in subsequent figures). (b) Example LFP snippets from a single 60 s montage recording are shown from monkey F using lead 4. LFPs were sampled from each pair of leads in series, 0–1 (black), 0–2 (blue), 0–3 (cyan), 1–2 (green), 1–3 (orange), and 2–3 (red). Corresponding PSDs are shown in (c), and the inset highlights the variability in the spectral peak.
Figure 2
Figure 2
The LFP frequency content measured with the Activa® PC + S (red) and with commercial systems taken on the same day. LFPs were recorded from a DBS lead in the subthalamic nucleus (STN) of monkey M using the Alpha Omega SNR (AO, gray) and the Activa® PC + S (a). LFPs were recorded from a DBS lead in the globus pallidus (GP) of monkey L using the Tucker Davis Technologies RZ2 (TDT, blue) and with the Activa® PC + S (b).
Figure 3
Figure 3
Average power spectral densities across multiple montages for each DBS lead in each monkey. (a) PSDs recorded in the naïve state are on the left and (b) PSDs recorded after administration of MPTP are on the right. The subscript indicates the type of DBS lead implanted in the subject.
Figure 4
Figure 4
LFP frequency content was consistent across multiple recording sessions in monkey F (a) and monkey P (b). Spectral content differed between recording contacts in the same monkey, between monkeys, and between parkinsonian states.
Figure 5
Figure 5
LFPs recorded from monkey P during passive manipulation of the joints. Spectrograms show spectral changes that depended on the phase of the joint movement. (a) PSDs for one contact pair in the STN during manipulation of the joints. (b) Spectrograms of LFPs triggered to the maxima/minima of the joint angle during manipulation of the elbow, knee, and shoulder. Black outlined regions show time–frequency clusters that were significantly different from a bootstrapped population.
Figure 6
Figure 6
LFPs recorded from monkeys F and L during 278 and 194 trials of a cued-reaching task, respectively. (a) The task required the monkey to place its hand on a startpad and wait for a variable 1–1.5 s. After the presentation of a cue/target (blue circle) in a random location, the monkey reached out and touched the cue/target (green) and received a reward. (b), (c) For monkeys F and L, respectively, color plots show spectral modulation triggered to the time of cue presentation (left), the time when the hand left the startpad (middle), and the time when the target was touched (right) relative to the variable baseline. Synchronization relative to baseline was colored yellow/red and desynchronization was colored blue. Black outlined regions show time–frequency clusters that were significantly different from a bootstrapped population.
Figure 7
Figure 7
LFPs recorded from monkey F STN1-STN3 during monopolar stimulation through STN2 at rest. (a) Spectrogram of the LFP with stimulation off, during stimulation at increasing amplitudes (black bars), and during washout times. (b) The blue trace shows beta power (10–20 Hz) normalized by the power at rest before stimulation, and the red trace is the normalized beta power smoothed with a 5 s window. (c) PSD at baseline (black) and during stimulation at increasing amplitudes (colors) showed a spectral peak in the beta band (10–20 Hz) and a stimulation artifact at 25 Hz (arrow). (a)–(c) Data from a single day. (d) Boxplots of normalized beta power at increasing stimulation amplitudes recorded across four days. Asterisks (*) indicate conditions significantly different from stimulation off (0 V), as determined by an ANOVA and Tukey post-hoc test based on ranks. (e) Boxplots of normalized beta power during the 10 s washout period immediately following stimulation at increasing amplitudes.

References

    1. Afshar P, et al. A translational platform for prototyping closed-loop neuromodulation systems. Front. Neural Circuits. 2012;6:117. - PMC - PubMed
    1. Agnesi F, Connolly AT, Baker KB, Vitek JL, Johnson MD. Deep brain stimulation imposes complex informational lesions. PLoS One. 2013;8:e74462. - PMC - PubMed
    1. Alegre M, Alonso-Frech F, Rodriguez Oroz M C, Guridi J, Zamarbide I, Valencia M, Manrique M, Obeso JA, Artieda J. Movement-related changes in oscillatory activity in the human subthalamic nucleus: ipsilateral versus contralateral movements. Eur. J. Neurosci. 2005;22:2315–24. - PubMed
    1. Androulidakis AG, Mazzone P, Litvak V, Penny Dileone M, Gaynor LM, Tisch S, Di Lazzaro V, Brown P. Oscillatory activity in the pedunculopontine area of patients with Parkinson’s disease. Exp. Neurol. 2008;211:59–66. - PubMed
    1. Arvesen JN. Jackknifing $U$-statistics. Ann. Math. Stat. 1969;40:2076–100.

Publication types