

Far upstream element-binding protein 1 is a prognostic biomarker and promotes nasopharyngeal carcinoma progression
- PMID: 26469968
- PMCID: PMC4632288
- DOI: 10.1038/cddis.2015.258
Far upstream element-binding protein 1 is a prognostic biomarker and promotes nasopharyngeal carcinoma progression
Abstract
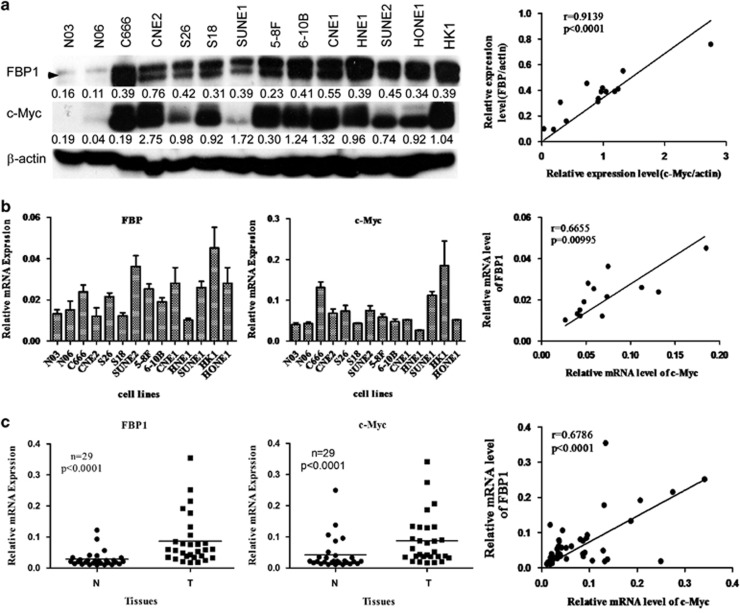
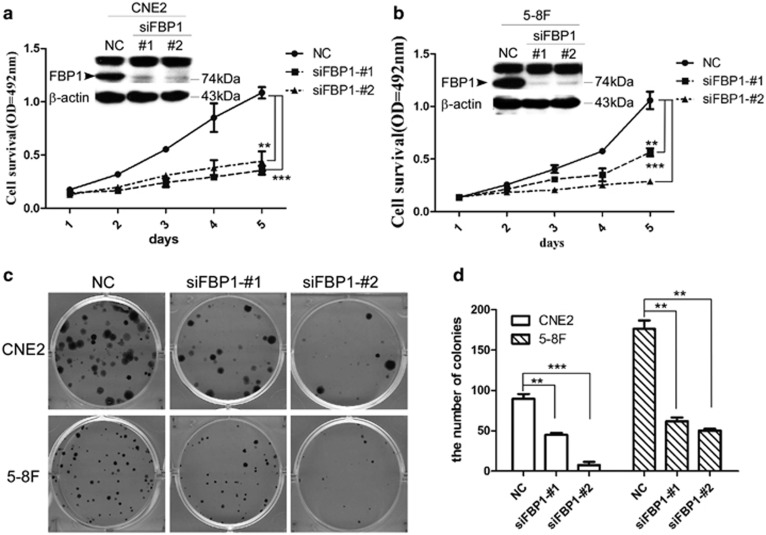
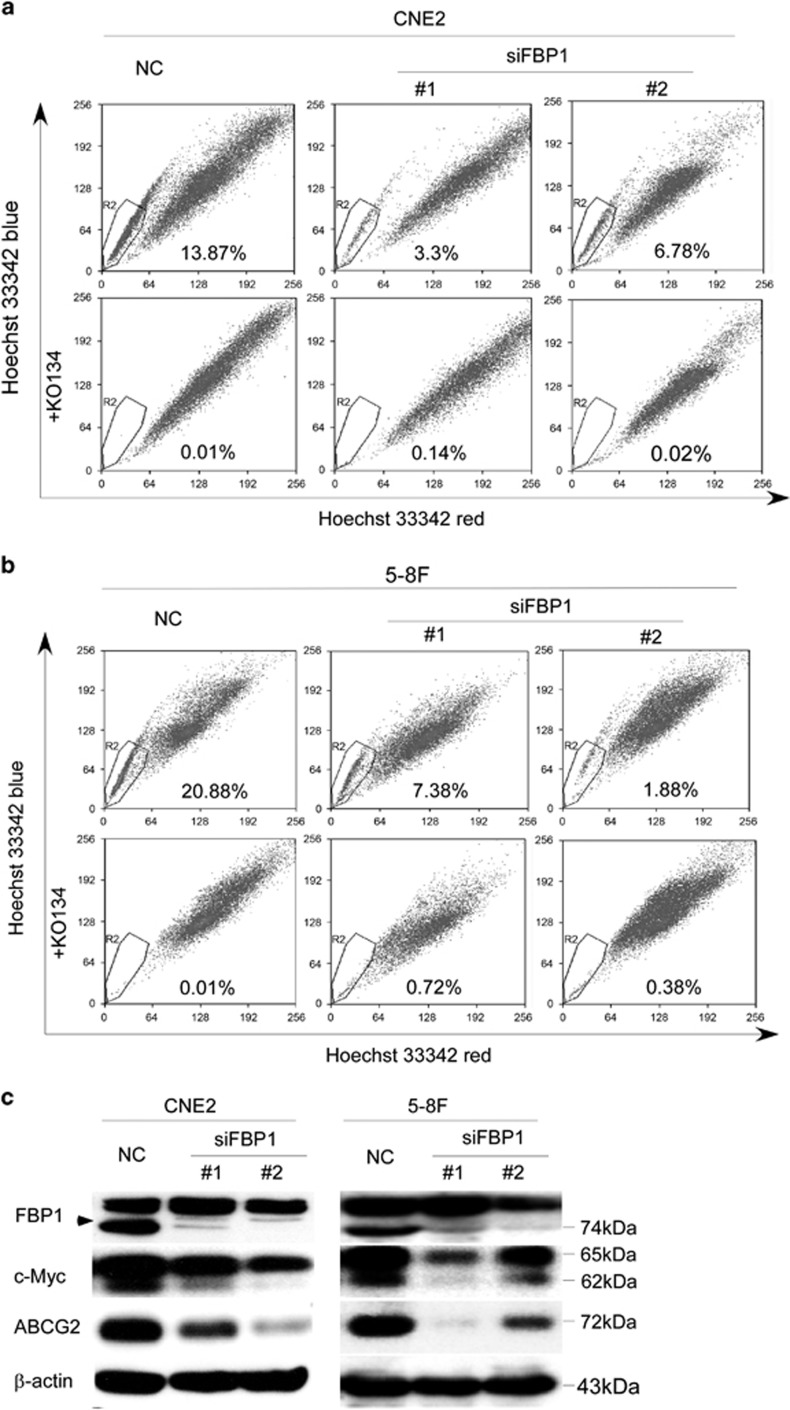
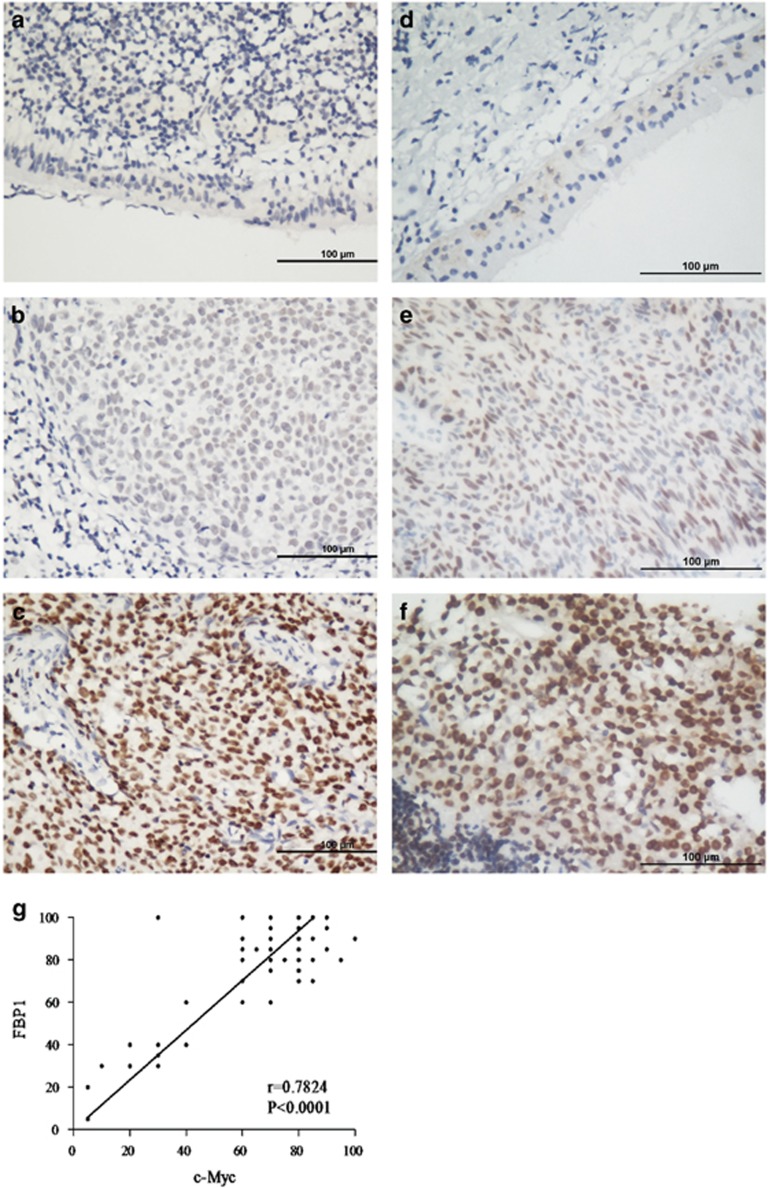
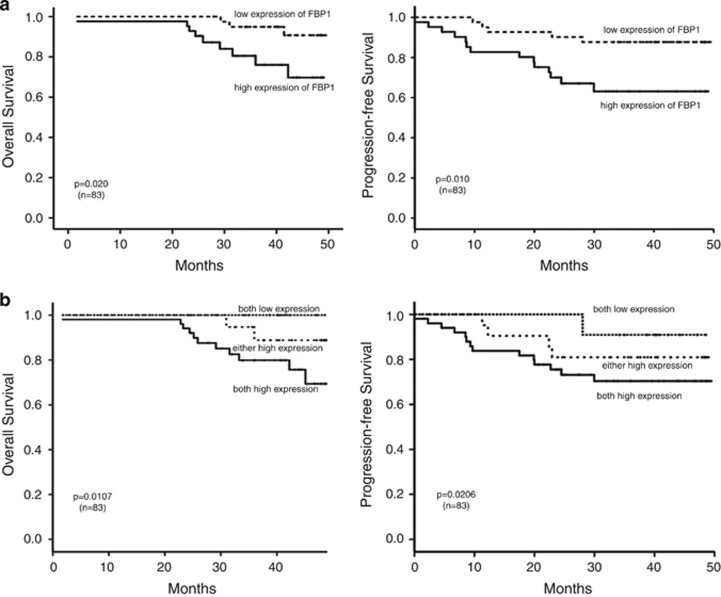
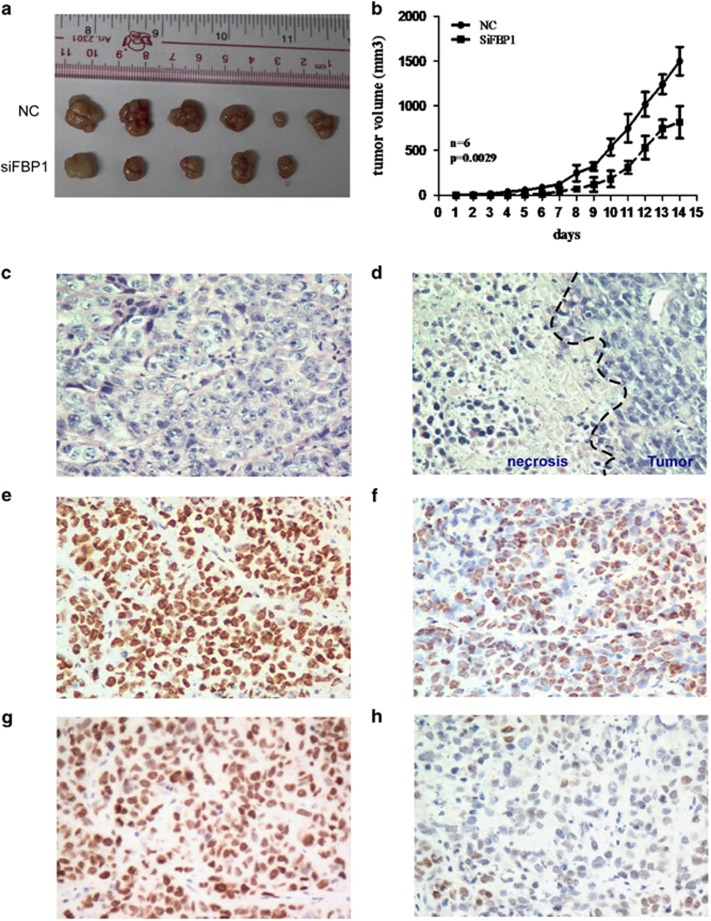
Nasopharyngeal carcinoma (NPC) is a malignant epithelial tumor with tremendous invasion and metastasis capacities, and it has a high incidence in southeast Asia and southern China. Previous studies identified that far upstream element-binding protein 1 (FBP1), a transcriptional regulator of c-Myc that is one of the most frequently aberrantly expressed oncogenes in various human cancers, including NPC, is an important biomarker for many cancers. Our study aimed to investigate the expression and function of FBP1 in human NPC. Quantitative real-time RT-PCR (qRT-PCR), western blot and immunohistochemical staining (IHC) were performed in NPC cells and biopsies. Furthermore, the effect of FBP1 knockdown on cell proliferation, colony formation, side population tests and tumorigenesis in nude mice were measured by MTT, clonogenicity analysis, flow cytometry and a xenograft model, respectively. The results showed that the mRNA and protein levels of FBP1, which are positively correlated with c-Myc expression, were substantially higher in NPC than that in nasopharyngeal epithelial cells. IHC revealed that the patients with high FBP1 expression had a significantly poorer prognosis compared with the patients with low expression (P=0.020). In univariate analysis, high FBP1 and c-Myc expression predicted poorer overall survival (OS) and poorer progression-free survival. Multivariate analysis indicated that high FBP1 and c-Myc expression were independent prognostic markers. Knockdown of FBP1 reduced cell proliferation, clonogenicity and the ratio of side populations, as well as tumorigenesis in nude mice. These data indicate that FBP1 expression, which is closely correlated with c-Myc expression, is an independent prognostic factor and promotes NPC progression. Our results suggest that FBP1 can not only serve as a useful prognostic biomarker for NPC but also as a potential therapeutic target for NPC patients.
Figures
Similar articles
-
Expression of far upstream element (FUSE) binding protein 1 in human glioma is correlated with c-Myc and cell proliferation.Mol Carcinog. 2015 May;54(5):405-15. doi: 10.1002/mc.22114. Epub 2013 Dec 17. Mol Carcinog. 2015. PMID: 24347226
-
High SRC-1 and Twist1 expression predicts poor prognosis and promotes migration and invasion by inducing epithelial-mesenchymal transition in human nasopharyngeal carcinoma.PLoS One. 2019 Apr 11;14(4):e0215299. doi: 10.1371/journal.pone.0215299. eCollection 2019. PLoS One. 2019. PMID: 30973923 Free PMC article.
-
Overexpression of CIP2A is an independent prognostic indicator in nasopharyngeal carcinoma and its depletion suppresses cell proliferation and tumor growth.Mol Cancer. 2014 May 19;13:111. doi: 10.1186/1476-4598-13-111. Mol Cancer. 2014. PMID: 24884612 Free PMC article.
-
Expression of chemokine receptor CXCR4 is closely correlated with clinical outcome in human nasopharyngeal carcinoma.Tumour Biol. 2016 May;37(5):6099-105. doi: 10.1007/s13277-015-4464-1. Epub 2015 Nov 26. Tumour Biol. 2016. PMID: 26611644
-
Far upstream element binding protein 1: a commander of transcription, translation and beyond.Oncogene. 2013 Jun 13;32(24):2907-16. doi: 10.1038/onc.2012.350. Epub 2012 Aug 27. Oncogene. 2013. PMID: 22926519 Free PMC article. Review.
Cited by
-
High expression of FUSE binding protein 1 in breast cancer stimulates cell proliferation and diminishes drug sensitivity.Int J Oncol. 2020 Aug;57(2):488-499. doi: 10.3892/ijo.2020.5080. Epub 2020 Jun 10. Int J Oncol. 2020. PMID: 32626933 Free PMC article.
-
The biogenesis and roles of extrachromosomal oncogene involved in carcinogenesis and evolution.Am J Cancer Res. 2020 Nov 1;10(11):3532-3550. eCollection 2020. Am J Cancer Res. 2020. PMID: 33294253 Free PMC article. Review.
-
RNA splicing alterations in lung cancer pathogenesis and therapy.Cancer Pathog Ther. 2023 Apr 28;1(4):272-283. doi: 10.1016/j.cpt.2023.04.004. eCollection 2023 Oct. Cancer Pathog Ther. 2023. PMID: 38327600 Free PMC article. Review.
-
Multiple Functions of Fubp1 in Cell Cycle Progression and Cell Survival.Cells. 2020 May 28;9(6):1347. doi: 10.3390/cells9061347. Cells. 2020. PMID: 32481602 Free PMC article.
-
Identification of methylated genes and miRNA signatures in nasopharyngeal carcinoma by bioinformatics analysis.Mol Med Rep. 2018 Apr;17(4):4909-4916. doi: 10.3892/mmr.2018.8487. Epub 2018 Jan 25. Mol Med Rep. 2018. PMID: 29393436 Free PMC article.
References
-
- 1Chang ET, Adami HO. The enigmatic epidemiology of nasopharyngeal carcinoma. Cancer Epidemiol Biomarkers Prev 2006; 15: 1765–1777. - PubMed
-
- 2Young LS, Rickinson AB. Epstein-Barr virus: 40 years on. Nat Rev Cancer 2004; 4: 757–768. - PubMed
-
- 3Kamran SC, Riaz N, Lee N. Nasopharyngeal carcinoma. Surg Oncol Clin N Am 2015; 24: 547–561. - PubMed
-
- 4Wei WI, Sham JS. Nasopharyngeal carcinoma. Lancet 2005; 365: 2041–2054. - PubMed
Publication types
MeSH terms
Substances
LinkOut - more resources
Full Text Sources
Other Literature Sources
Research Materials
Miscellaneous
