

Fine particulate matter (PM 2.5) in China at a city level
- PMID: 26469995
- PMCID: PMC4606739
- DOI: 10.1038/srep14884
Fine particulate matter (PM 2.5) in China at a city level
Abstract
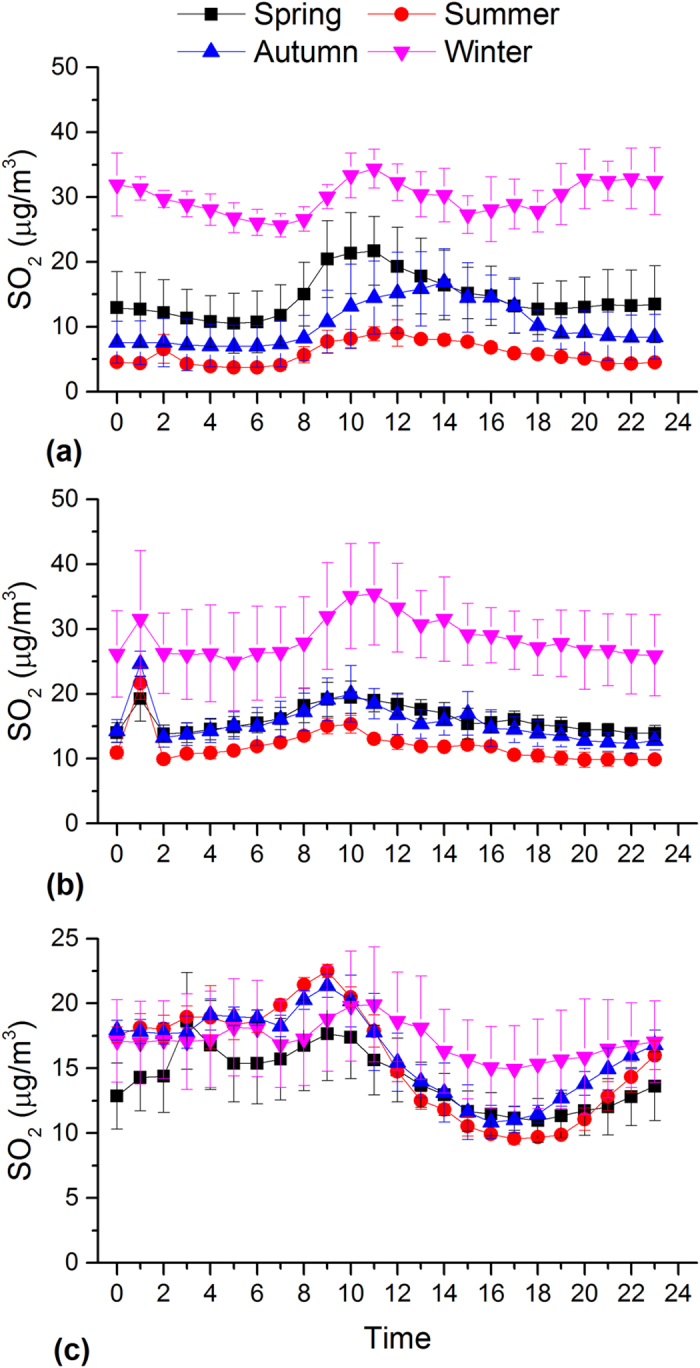
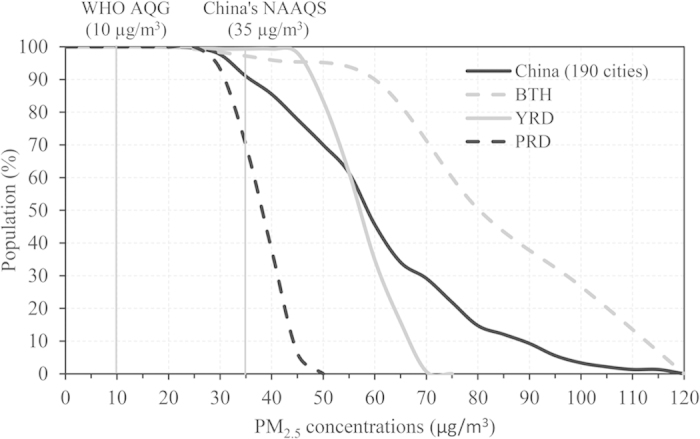
This study presents one of the first long term datasets including a statistical summary of PM2.5 concentrations obtained from one-year monitoring in 190 cities in China. We found only 25 out of 190 cities could meet the National Ambient Air Quality Standards of China, and the population-weighted mean of PM2.5 in Chinese cities are 61 μg/m(3), ~3 times as high as global population-weighted mean, highlighting a high health risk. PM2.5 concentrations are generally higher in north than in south regions due to relative large PM emissions and unfavorable meteorological conditions for pollution dispersion. A remarkable seasonal variability of PM2.5 is observed with the highest during the winter and the lowest during the summer. Due to the enhanced contributions from dust particles and open biomass burning, high PM2.5 abundances are also found in the spring (in Northwest and West Central China) and autumn (in East China), respectively. In addition, we found the lowest and highest PM2.5 often occurs in the afternoon and evening hours, respectively, associated with daily variation of the boundary layer depth and anthropogenic emissions. The diurnal distribution of the PM2.5-to-CO ratio consistently displays a pronounced peak during the afternoon periods, reflecting a significant contribution of secondary PM formation.
Figures


References
-
- Zhang R., Li Q. & Zhang R. Meteorological conditions for the persistent severe fog and haze event over eastern China in January 2013. SCIENCE CHINA Earth Sciences 57, 26–35 (2014).
-
- Zhang Y. L. et al. Fossil vs. non-fossil sources of fine carbonaceous aerosols in four Chinese cities during the extreme winter haze episode of 2013. Atmos. Chem. Phys. 15, 1299–1312 (2015).
-
- Zhang Q., Streets D. G., He K. & Klimont Z. Major components of China’s anthropogenic primary particulate emissions. Environ. Res. Lett. 2, 045027 (2007).
-
- Wang G. H., Kawamura K., Lee S., Ho K. F. & Cao J. J. Molecular, seasonal, and spatial distributions of organic aerosols from fourteen Chinese cities. Environ. Sci. Technol. 40, 4619–4625 (2006). - PubMed
-
- Cao J. J. et al. Spatial and seasonal distributions of carbonaceous aerosols over China. J. Geophys. Res. 112, D22S11 (2007).
Publication types
MeSH terms
Substances
LinkOut - more resources
Full Text Sources
Other Literature Sources
