. 2015 Dec 28;220(Pt A):253-264.
doi: 10.1016/j.jconrel.2015.10.016. Epub 2015 Oct 22.

CpG expedites regression of local and systemic tumors when combined with activatable nanodelivery

Affiliations

CpG expedites regression of local and systemic tumors when combined with activatable nanodelivery

Azadeh Kheirolomoom et al. J Control Release. .

Abstract

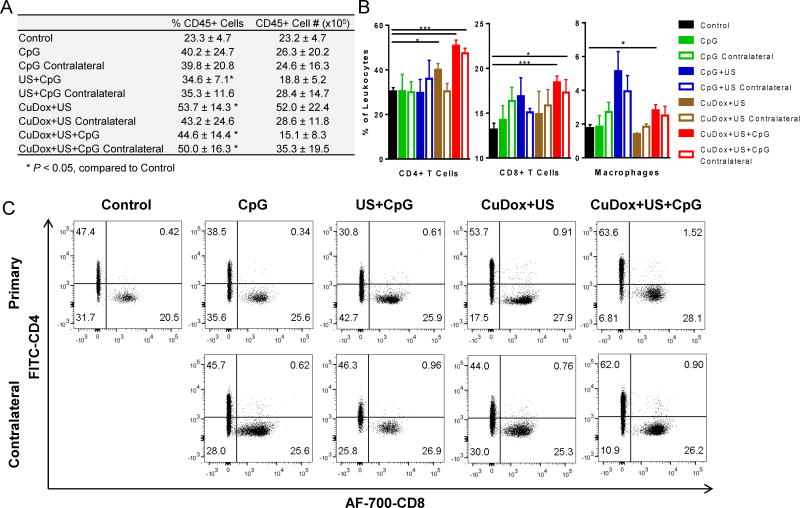
Ultrasonic activation of nanoparticles provides the opportunity to deliver a large fraction of the injected dose to insonified tumors and produce a complete local response. Here, we evaluate whether the local and systemic response to chemotherapy can be enhanced by combining such a therapy with locally-administered CpG as an immune adjuvant. In order to create stable, activatable particles, a complex between copper and doxorubicin (CuDox) was created within temperature-sensitive liposomes. Whereas insonation of the CuDox liposomes alone has been shown to produce a complete response in murine breast cancer after 8 treatments of 6 mg/kg delivered over 4 weeks, combining this treatment with CpG resolved local cancers within 3 treatments delivered over 7 days. Further, contralateral tumors regressed as a result of the combined treatment, and survival was extended in systemic disease. In both the treated and contralateral tumor site, the combined treatment increased leukocytes and CD4+ and CD8+ T-effector cells and reduced myeloid-derived suppressor cells (MDSCs). Taken together, the results suggest that this combinatorial treatment significantly enhances the systemic efficacy of locally-activated nanotherapy.

Keywords: CpG; Doxorubicin; Immunotherapy; Temperature-sensitive liposome; Ultrasound.


Conflict of interest statement

Conflict of Interest: The authors declare no competing financial interest.

Figures

Fig. 1
Fig. 1
CpG reduces tumor growth in directly-treated and contralateral tumors. A: schematic of the treatment protocol. B–D: tumor growth shown as a function of days over the 10-day, 3-dose treatment cycle and presented as percent tumor growth. Initial tumor diameter was 2–4 mm. The sample size for each group was: Control (n = 15), US (n = 3), CuDox (n = 8), CuDox+US (n = 9), CpG 60ug (n = 3), CpG 100ug (n = 3), US+CpG (n = 4), and CuDox+US+CpG (n = 9). E–I: Plots of individual tumor growth rates in response to each treatment over the 10-day, 3-dose treatment period. These data combine those tumors obtained from both the 10-day tumor growth study and the open-ended survival study. Each mouse was injected intravenously with either saline or CuDox-TSL (~6 mg Dox/kg body weight) and, for animals receiving US, one tumor per animal was insonified to release the drug. Animals receiving CuDox+US+CpG or US+CpG treatment received an intratumoral injection of 100 μg of CpG immediately after tumor insonation. Animals receiving CpG-only received an intratumoral injection of either 60 or 100 μg CpG. Red arrows indicate treatment days. Data are shown as mean ± SEM, * p < 0.05, ** p < 0.01, *** p < 0.001, One-way ANOVA with Tukey’s post-hoc correction (B and C, indicated significance is compared to control) or unpaired t test assuming unequal variance (D).
Fig. 1
Fig. 1
CpG reduces tumor growth in directly-treated and contralateral tumors. A: schematic of the treatment protocol. B–D: tumor growth shown as a function of days over the 10-day, 3-dose treatment cycle and presented as percent tumor growth. Initial tumor diameter was 2–4 mm. The sample size for each group was: Control (n = 15), US (n = 3), CuDox (n = 8), CuDox+US (n = 9), CpG 60ug (n = 3), CpG 100ug (n = 3), US+CpG (n = 4), and CuDox+US+CpG (n = 9). E–I: Plots of individual tumor growth rates in response to each treatment over the 10-day, 3-dose treatment period. These data combine those tumors obtained from both the 10-day tumor growth study and the open-ended survival study. Each mouse was injected intravenously with either saline or CuDox-TSL (~6 mg Dox/kg body weight) and, for animals receiving US, one tumor per animal was insonified to release the drug. Animals receiving CuDox+US+CpG or US+CpG treatment received an intratumoral injection of 100 μg of CpG immediately after tumor insonation. Animals receiving CpG-only received an intratumoral injection of either 60 or 100 μg CpG. Red arrows indicate treatment days. Data are shown as mean ± SEM, * p < 0.05, ** p < 0.01, *** p < 0.001, One-way ANOVA with Tukey’s post-hoc correction (B and C, indicated significance is compared to control) or unpaired t test assuming unequal variance (D).
Fig. 2
Fig. 2
Histology of tumors treated with CuDox+US+CpG after the 10-day, 3-dose treatment period. H&E of representative NDL tumors from the #4 inguinal mammary fat pads of mice treated with CuDox+US+CpG, CuDox+US, CpG only or CuDox only compared to control tumors. Whole tumor sections (right panels in each column) and the magnified views enclosed by black boxes (left panels in each column) are shown. Areas enclosed by the dotted lines indicate viable tumor. Scale bars correspond to 200 μm (magnified panels) and 2 mm (whole tumor panels).
Fig. 3
Fig. 3
Tumor immune cell profiles at the termination of the 2-dose treatment period. Entire inguinal fat pads containing tumor and lymph node were harvested from treated mice and stained for CD45, CD3, CD4, CD8, F4/80, CD11b and Gr-1 on day 7 after the start of treatment and compared to untreated control mice via flow cytometry analysis. A: The percentage and total number of live cells positive for CD45 (leukocytes), given as mean ± SD. B: Frequencies of CD4+ T cells (CD3+CD4+), CD8+ T cells (CD3+CD8+) and macrophages (CD11b+F4/80+Gr-1), given as percentages of total leukocytes. Data shown are mean + SEM. C: Flow cytometry plots displaying frequencies of CD45+CD3+ pre-gated cells staining positive for CD4 or CD8 in each treatment group. Numbers in quadrants represent the percentages of cells positive for the indicated markers. After CuDox-TSL were injected in the tail vein, one tumor site per mouse was directly treated by US and/or CpG injection (“primary”); the contralateral site was not directly treated. The sample size was: control (n = 6), CpG (n = 4), US+CpG (n = 4), CuDox+US (n = 4), CuDox+US+CpG (n = 4). * p < 0.05, *** p < 0.001, two-tailed unpaired t test assuming unequal variance and Sidak-Bonferroni correction for multiple comparisons. Each treatment is compared only to the control.
Fig. 4
Fig. 4
MDSCs and Tregs at the termination of treatment. A–C: Tumors/inguinal lymph nodes of treated mice were stained for CD45, CD11b and Ly6C/Ly6G (Gr-1) on day 7 after the start of treatment and analyzed via flow cytometry. A: Gated CD45+ cells are shown in the flow cytometry dot plots and display frequencies of MDSCs positive for CD11b and Ly6C/Ly6G (Gr-1) in each treatment group. Numbers in quadrants represent the percentages of cells positive for the indicated markers. After CuDox-TSL were injected in the tail vein, one tumor site per mouse was directly treated by US and/or CpG injection (“primary”); the contralateral site was not directly treated. B: Frequencies of MDSCs (CD11b+Gr-1+) given as a percentage of total leukocytes and C: as total numbers. D: Treg staining in histological sections of fat pads containing tumor and inguinal lymph node on day 10 after 3 treatments. Sections were stained with Foxp3 (brown). E: Treg number/mm2 in the periphery of tumors as quantified from histological sections. Data are shown as mean + SEM, * p < 0.05, two-tailed unpaired t test assuming unequal variance and Sidak-Bonferroni correction for multiple comparisons. Each treatment is compared only to the control. The sample size was: control (n = 6), CpG (n = 4), US+CpG (n = 4), CuDox+US (n = 4), CuDox+US+CpG (n = 4).
Fig. 4
Fig. 4
MDSCs and Tregs at the termination of treatment. A–C: Tumors/inguinal lymph nodes of treated mice were stained for CD45, CD11b and Ly6C/Ly6G (Gr-1) on day 7 after the start of treatment and analyzed via flow cytometry. A: Gated CD45+ cells are shown in the flow cytometry dot plots and display frequencies of MDSCs positive for CD11b and Ly6C/Ly6G (Gr-1) in each treatment group. Numbers in quadrants represent the percentages of cells positive for the indicated markers. After CuDox-TSL were injected in the tail vein, one tumor site per mouse was directly treated by US and/or CpG injection (“primary”); the contralateral site was not directly treated. B: Frequencies of MDSCs (CD11b+Gr-1+) given as a percentage of total leukocytes and C: as total numbers. D: Treg staining in histological sections of fat pads containing tumor and inguinal lymph node on day 10 after 3 treatments. Sections were stained with Foxp3 (brown). E: Treg number/mm2 in the periphery of tumors as quantified from histological sections. Data are shown as mean + SEM, * p < 0.05, two-tailed unpaired t test assuming unequal variance and Sidak-Bonferroni correction for multiple comparisons. Each treatment is compared only to the control. The sample size was: control (n = 6), CpG (n = 4), US+CpG (n = 4), CuDox+US (n = 4), CuDox+US+CpG (n = 4).
Fig. 5
Fig. 5
T-effector cell IFN-γ secretion in CuDox+US+CpG-treated tumor sites. Tumors/inguinal lymph nodes of treated mice were stained for CD45, CD3, CD4, CD8 and IFN-γ on day 7 after the start of treatment and compared to untreated control mice via flow cytometry. The sample size was: control (n = 6), CpG (n = 4), US+CpG (n = 4), CuDox+US (n = 4), CuDox+US+CpG (n = 4). A: Gated CD45+CD3+ cells are shown in the flow cytometry dot plots and display frequencies of cells double-positive for either CD4 and IFN-γ or CD8 and IFN-γ. Numbers in quadrants represent the percentages of cells positive for the mentioned markers. B: Frequencies of IFN-γ secreting CD4+ (CD3+CD4+IFN-γ+) and CD8+ (CD3+CD8+IFN-γ+) T cells given as a percentage of total leukocytes. Data are shown as mean + SEM, ** p < 0.01, *** p < 0.001, two-tailed unpaired t-test assuming unequal variance and Sidak-Bonferroni correction for multiple comparisons. Each treatment is compared only to the control.
Fig. 6
Fig. 6
In vivo treatment efficiency of the immune adjuvant, CpG, with and without CuDox+US or US application. Mice received 3 treatments over the course of 10 days and were then monitored for up to 62 days. The sample size for this study was: control (n = 4), CpG (n = 7), US+CpG (n = 4), CuDox+US+CpG (n = 4). A: Tumor growth is quantified as a function of days after the start of treatment over the open-ended survival study period. Initial tumor diameter was ~4 mm. Directly-treated CuDox+US+CpG tumors maintain regression after treatment completion for the entire 48-day tumor-growth study duration. B: Kaplan-Meier survival plot. Survival of mice receiving CuDox+US+CpG was extended over the study period compared to control mice (p = 0.024). C: Tumor/fat pad histology at the termination of the open-ended survival study. H&E of whole NDL tumor sections from mice receiving CuDox+US+CpG (100 μg directly-treated tumors (i–iv), and representative contralateral tumor (v)) or 100 μg CpG (directly-treated tumor (vi) and contralateral tumor (vii)) compared to representative control tumor (viii). Viable tumor cells were not detected in the directly-treated CuDox+US+CpG tumors but were observed in all other treatment groups. Scale bar corresponds to 3 mm. Yellow arrows indicate lymph nodes. Data are shown as mean + SEM, * p < 0.05, One-way ANOVA with Tukey’s post-hoc correction (A, day 20), *** p < 0.001, two-tailed unpaired t test (A, day 48). * p < 0.05, Log-rank statistics (B).
Fig. 6
Fig. 6
In vivo treatment efficiency of the immune adjuvant, CpG, with and without CuDox+US or US application. Mice received 3 treatments over the course of 10 days and were then monitored for up to 62 days. The sample size for this study was: control (n = 4), CpG (n = 7), US+CpG (n = 4), CuDox+US+CpG (n = 4). A: Tumor growth is quantified as a function of days after the start of treatment over the open-ended survival study period. Initial tumor diameter was ~4 mm. Directly-treated CuDox+US+CpG tumors maintain regression after treatment completion for the entire 48-day tumor-growth study duration. B: Kaplan-Meier survival plot. Survival of mice receiving CuDox+US+CpG was extended over the study period compared to control mice (p = 0.024). C: Tumor/fat pad histology at the termination of the open-ended survival study. H&E of whole NDL tumor sections from mice receiving CuDox+US+CpG (100 μg directly-treated tumors (i–iv), and representative contralateral tumor (v)) or 100 μg CpG (directly-treated tumor (vi) and contralateral tumor (vii)) compared to representative control tumor (viii). Viable tumor cells were not detected in the directly-treated CuDox+US+CpG tumors but were observed in all other treatment groups. Scale bar corresponds to 3 mm. Yellow arrows indicate lymph nodes. Data are shown as mean + SEM, * p < 0.05, One-way ANOVA with Tukey’s post-hoc correction (A, day 20), *** p < 0.001, two-tailed unpaired t test (A, day 48). * p < 0.05, Log-rank statistics (B).

References

    1. Hu Z, Yang XY, Liu Y, Sankin GN, Pua EC, Morse MA, Lyerly HK, Clay TM, Zhong P. Investigation of HIFU-induced anti-tumor immunity in a murine tumor model. Journal of Translational Medicine. 2007;5 - PMC - PubMed
    1. Liu F, Hu Z, Qiu L, Hui C, Li C, Zhong P, Zhang J. Boosting high-intensity focused ultrasound-induced anti-tumor immunity using a sparse-scan strategy that can more effectively promote dendritic cell maturation. Journal of Translational Medicine. 2010;8 - PMC - PubMed
    1. Xu ZL, Zhu XQ, Lu P, Zhou Q, Zhang J, Wu F. Activation of tumor-infiltating antigen presenting cells by high intensity focused ultrasound ablation of human breast cancer. Ultrasound in Medicine and Biology. 2009;35:50–57. - PubMed
    1. Unga J, Hashida M. Ultrasound induced cancer immunotherapy. Advanced drug delivery reviews. 2014;72:144–153. - PubMed
    1. Weigel BJ, Rodeberg DA, Krieg AM, Blazar BR. CpG oligodeoxynucleotides potentiate the antitumor effects of chemotherapy or tumor resection in an orthotopic murine model of rhabdomyosarcoma. Clinical cancer research : an official journal of the American Association for Cancer Research. 2003;9:3105–3114. - PubMed

Publication types

MeSH terms