

3DRobot: automated generation of diverse and well-packed protein structure decoys
- PMID: 26471454
- PMCID: PMC5006309
- DOI: 10.1093/bioinformatics/btv601
3DRobot: automated generation of diverse and well-packed protein structure decoys
Abstract
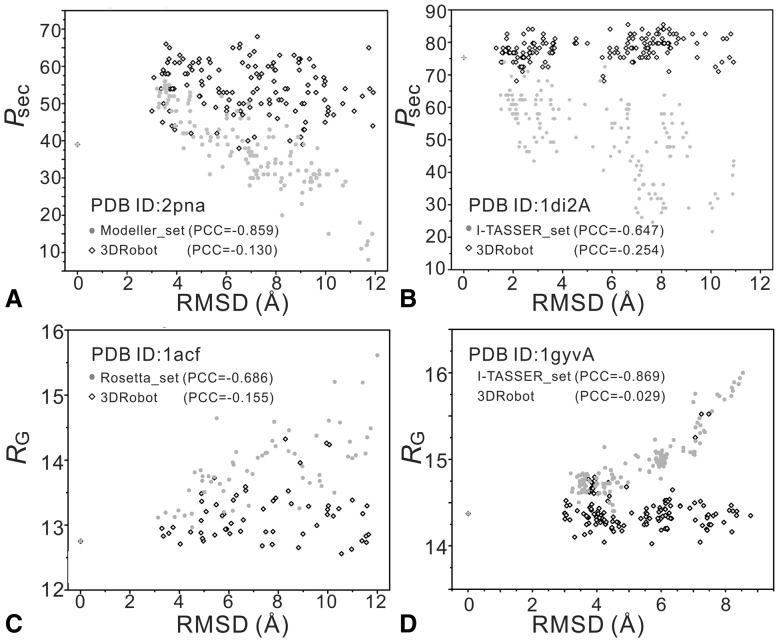
Motivation: Computationally generated non-native protein structure conformations (or decoys) are often used for designing protein folding simulation methods and force fields. However, almost all the decoy sets currently used in literature suffer from uneven root mean square deviation (RMSD) distribution with bias to non-protein like hydrogen-bonding and compactness patterns. Meanwhile, most protein decoy sets are pre-calculated and there is a lack of methods for automated generation of high-quality decoys for any target proteins.
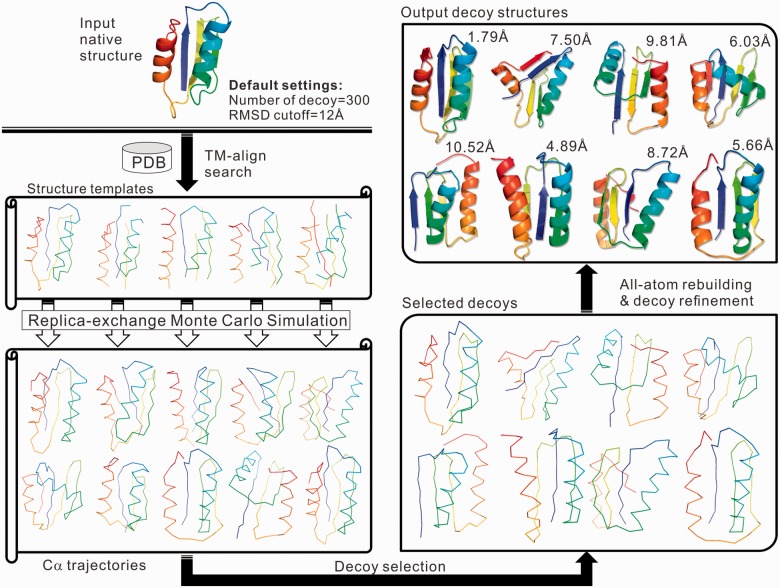
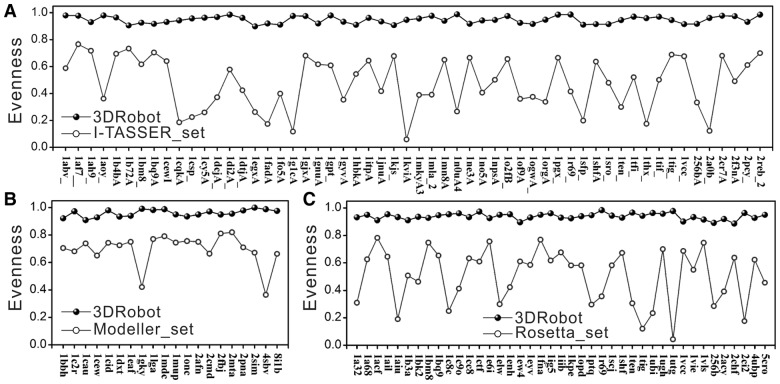
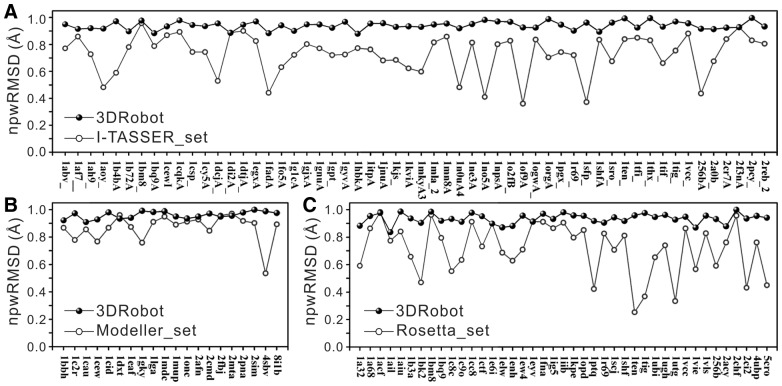
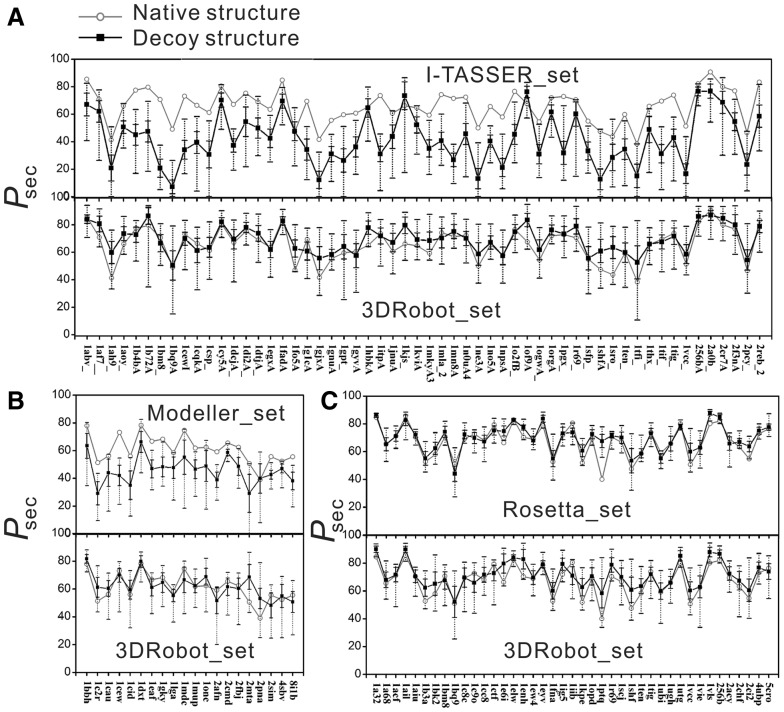
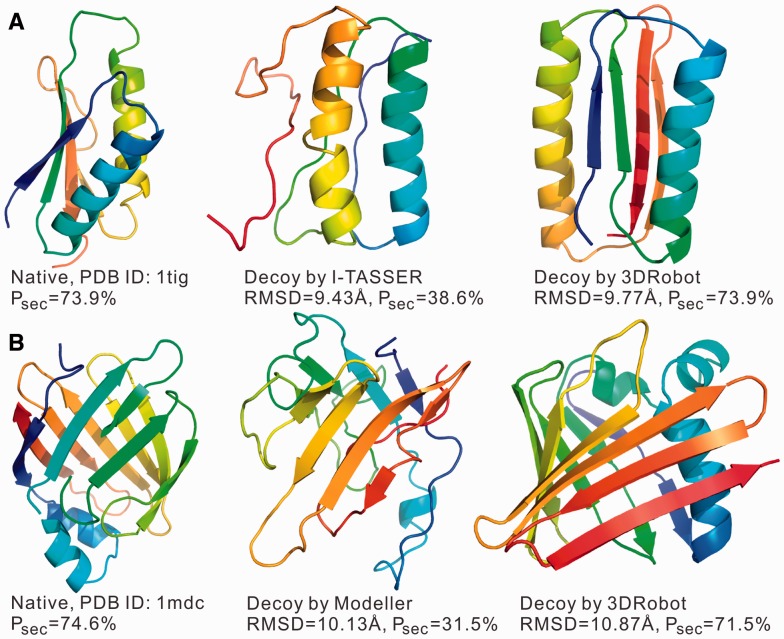
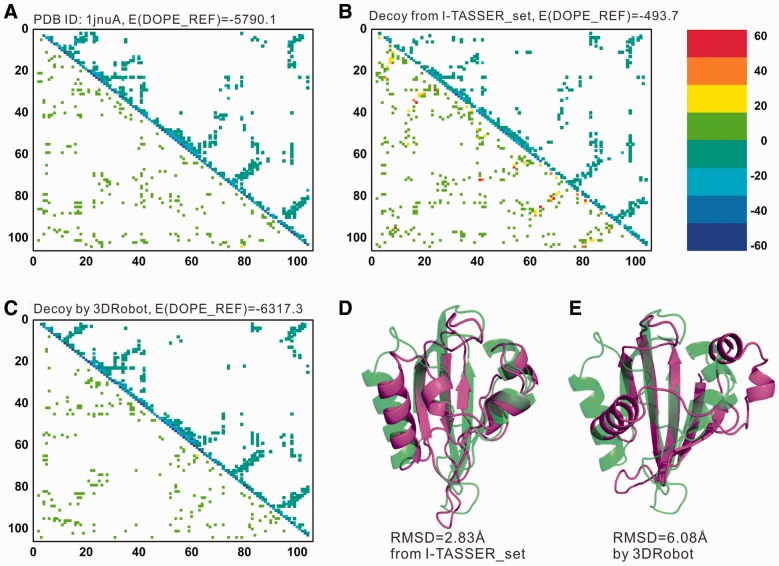
Results: We developed a new algorithm, 3DRobot, to create protein structure decoys by free fragment assembly with enhanced hydrogen-bonding and compactness interactions. The method was benchmarked with three widely used decoy sets from ab initio folding and comparative modeling simulations. The decoys generated by 3DRobot are shown to have significantly enhanced diversity and evenness with a continuous distribution in the RMSD space. The new energy terms introduced in 3DRobot improve the hydrogen-bonding network and compactness of decoys, which eliminates the possibility of native structure recognition by trivial potentials. Algorithms that can automatically create such diverse and well-packed non-native conformations from any protein structure should have a broad impact on the development of advanced protein force field and folding simulation methods. AVAILIABLITY AND IMPLEMENTATION: http://zhanglab.ccmb.med.umich.edu/3DRobot/
Contact: jiay@phy.ccnu.edu.cn; zhng@umich.edu
Supplementary information: Supplementary data are available at Bioinformatics online.
© The Author 2015. Published by Oxford University Press. All rights reserved. For Permissions, please e-mail: journals.permissions@oup.com.
Figures
Similar articles
-
TOUCHSTONE II: a new approach to ab initio protein structure prediction.Biophys J. 2003 Aug;85(2):1145-64. doi: 10.1016/S0006-3495(03)74551-2. Biophys J. 2003. PMID: 12885659 Free PMC article.
-
A homology/ab initio hybrid algorithm for sampling near-native protein conformations.J Comput Chem. 2013 Aug 15;34(22):1925-36. doi: 10.1002/jcc.23339. Epub 2013 Jun 3. J Comput Chem. 2013. PMID: 23728619
-
How well can we predict native contacts in proteins based on decoy structures and their energies?Proteins. 2003 Sep 1;52(4):598-608. doi: 10.1002/prot.10444. Proteins. 2003. PMID: 12910459
-
A decoy set for the thermostable subdomain from chicken villin headpiece, comparison of different free energy estimators.BMC Bioinformatics. 2005 Dec 14;6:301. doi: 10.1186/1471-2105-6-301. BMC Bioinformatics. 2005. PMID: 16354298 Free PMC article.
-
Amino acid network for the discrimination of native protein structures from decoys.Curr Protein Pept Sci. 2014;15(6):522-8. doi: 10.2174/1389203715666140724084709. Curr Protein Pept Sci. 2014. PMID: 25059328 Review.
Cited by
-
A Template-Based Protein Structure Reconstruction Method Using Deep Autoencoder Learning.J Proteomics Bioinform. 2016 Dec;9(12):306-313. doi: 10.4172/jpb.1000419. Epub 2016 Dec 12. J Proteomics Bioinform. 2016. PMID: 29081613 Free PMC article.
-
Protein model accuracy estimation based on local structure quality assessment using 3D convolutional neural network.PLoS One. 2019 Sep 5;14(9):e0221347. doi: 10.1371/journal.pone.0221347. eCollection 2019. PLoS One. 2019. PMID: 31487288 Free PMC article.
-
Using physical features of protein core packing to distinguish real proteins from decoys.Protein Sci. 2020 Sep;29(9):1931-1944. doi: 10.1002/pro.3914. Protein Sci. 2020. PMID: 32710566 Free PMC article.
-
DE-STRESS: a user-friendly web application for the evaluation of protein designs.Protein Eng Des Sel. 2021 Feb 15;34:gzab029. doi: 10.1093/protein/gzab029. Protein Eng Des Sel. 2021. PMID: 34908138 Free PMC article.
-
Deep Learning Enables Automatic Correction of Experimental HDX-MS Data with Applications in Protein Modeling.J Am Soc Mass Spectrom. 2024 Feb 7;35(2):197-204. doi: 10.1021/jasms.3c00285. Epub 2024 Jan 23. J Am Soc Mass Spectrom. 2024. PMID: 38262924 Free PMC article.
References
Publication types
MeSH terms
Substances
Grants and funding
LinkOut - more resources
Full Text Sources
Other Literature Sources
