. 2015 Oct 15;4(11):1481-9.
doi: 10.1242/bio.014159.

There are four dynamically and functionally distinct populations of E-cadherin in cell junctions

Affiliations

There are four dynamically and functionally distinct populations of E-cadherin in cell junctions

Zahra Erami et al. Biol Open. .

Abstract

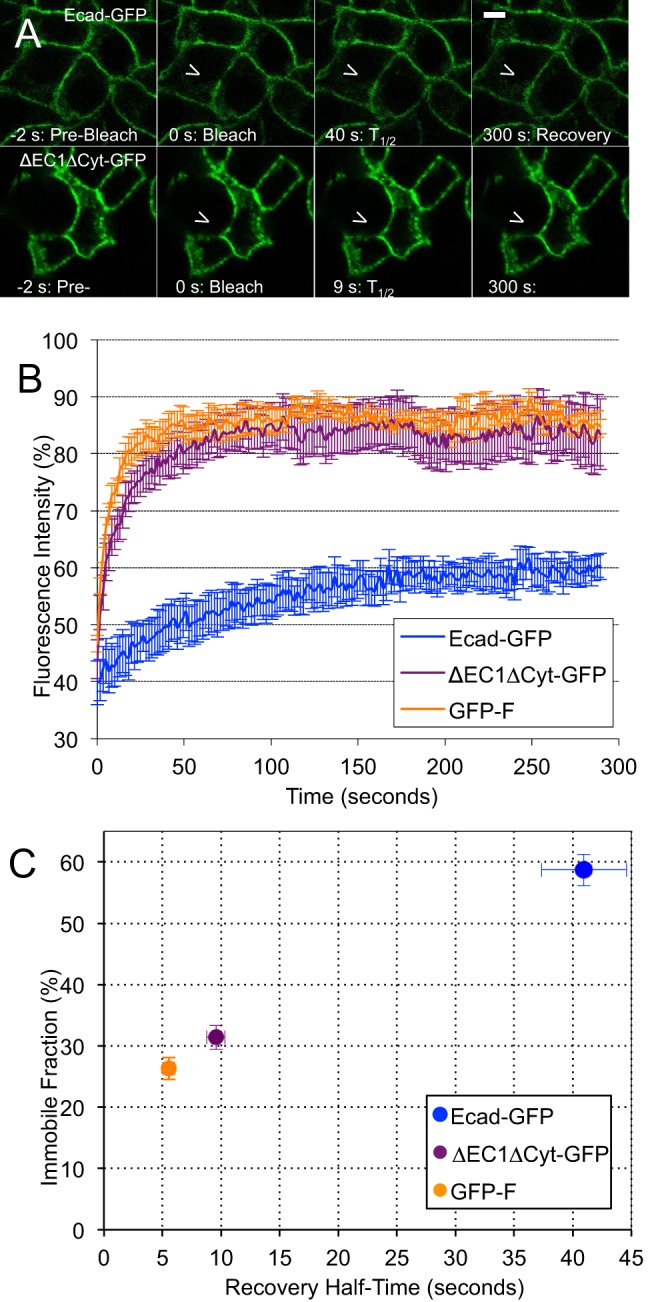
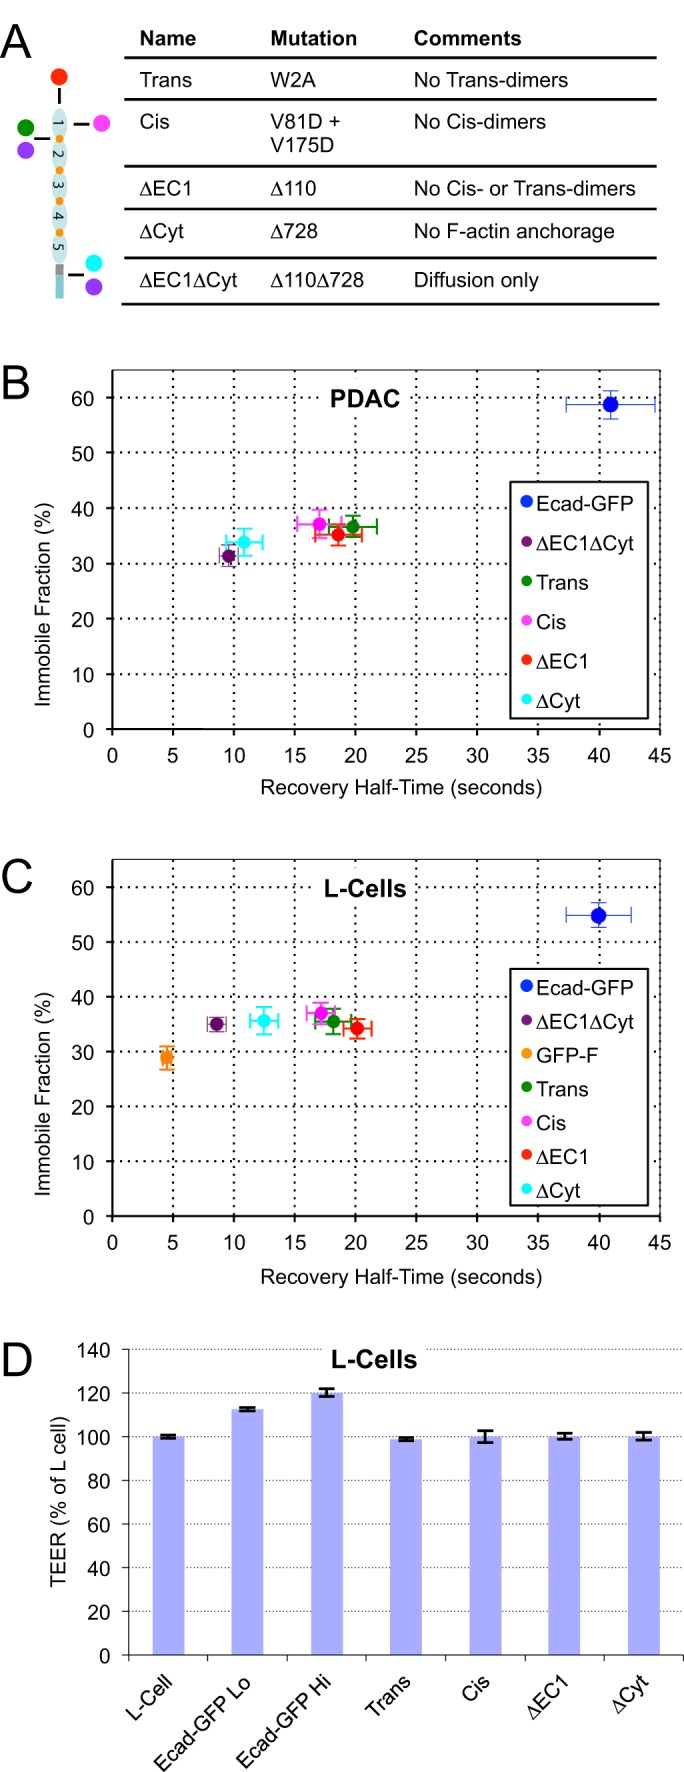
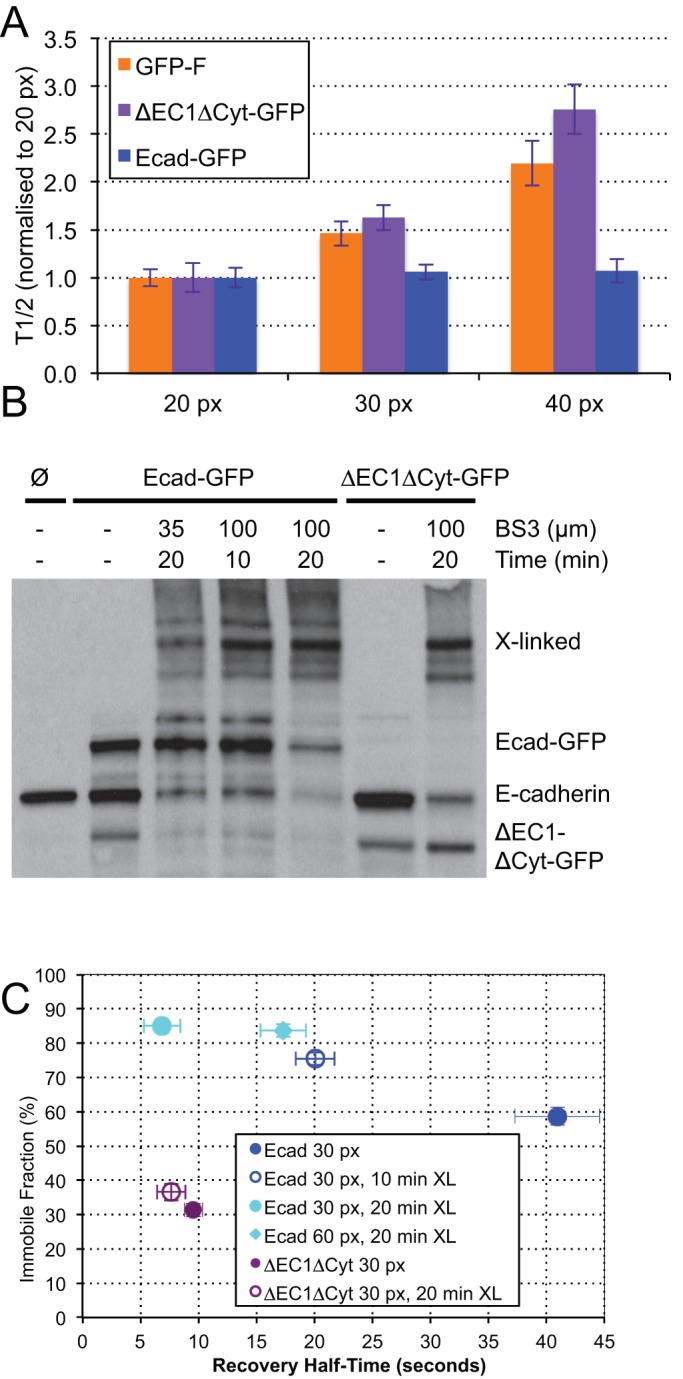
E-cadherin is a trans-membrane tumor suppressor responsible for epithelial cell adhesion. E-cadherin forms adhesive clusters through combined extra-cellular cis- and trans-interactions and intracellular interaction with the actin cytoskeleton. Here we identify four populations of E-cadherin within cell junctions based on the molecular interactions which determine their mobility and adhesive properties. Adhesive and non-adhesive populations of E-cadherin each consist of mobile and immobile fractions. Up to half of the E-cadherin immobilized in cell junctions is non-adhesive. Incorporation of E-cadherin into functional adhesions require all three adhesive interactions, with deletion of any one resulting in loss of effective cell-cell adhesion. Interestingly, the only interaction which could independently slow the diffusion of E-cadherin was the tail-mediated intra-cellular interaction. The adhesive and non-adhesive mobile fractions of E-cadherin can be distinguished by their sensitivity to chemical cross-linking with adhesive clusters. Our data define the size, mobility, and adhesive properties of four distinct populations of E-cadherin within cell junctions, and support association with the actin cytoskeleton as the first step in adhesion formation.

Keywords: Cell adhesion; E-cadherin; FRAP; Super-resolution microscopy.


Conflict of interest statement

Competing interests

The authors declare no competing or financial interests.

Figures

Fig. 1.
Fig. 1.
E-cadherin localizes in nano-scale clusters. (A) Ecad-GFP localization appears continuous in the junctions of pancreatic cancer cells when imaged using confocal microscopy. Bar: 10 µm. (B) Fixed cells were imaged by serial confocal sectioning before and after ROI photobleaching (top and bottom panels respectively, arrow in bottom panel highlights region of photobleaching). 3D data sets were reconstructed as projections to visualize the cell junction along the z, y, and x-axes. The x-axis projection was cropped to the photobleached region, and shows that junctions were vertical and did not undercut adjacent cells. Bar: 2 µm. (C) At higher resolution it was apparent that E-cadherin was localized in clusters. (D) Examination of cells expressing lower levels of Ecad-GFP revealed that E-cadherin clusters maintained the same average size and number of monomers per cluster, but that the spacing between clusters increased. In 3D-STORM images the z-position of each molecule is color-coded and its intensity indicates positional accuracy according to the look-up table in each panel. Color bar in lower left of panels indicates the z-position range from −375 to +375 nm (left to right) and probability per nm2 from 1.2×10⁻² to 1.4×10⁻⁵ (top to bottom). Bar in C,D: 200 nm.
Fig. 2.
Fig. 2.
Ecad-GFP is immobilized through adhesive and non-adhesive interactions at cell junctions. (A) FRAP analysis of PDAC cells expressing either Ecad-GFP (top row) or a mutant unable to form cis-, trans-, or actin interactions (ΔEC1ΔCyt-GFP, bottom row). Bar: 5 µm. (B) Average fluorescence recovery curves for Ecad-GFP, ΔEC1ΔCyt-GFP and GFP-F. (C) The half-time of recovery (T1/2) and immobile fraction (Fi) were derived from exponential functions fitted to individual FRAP curves, error bars represent s.e.m. Note that although the graph shows Fi and T1/2, T1/2 is actually a property of Fm. See supplementary material Table S2 for a complete list of FRAP parameters.
Fig. 3.
Fig. 3.
Inclusion of E-cadherin into stationary clusters requires cis-, trans-, and cytoplasmic interactions. (A) Schematic diagram and table of mutants. (B,C) FRAP analysis of wild-type Ecad-GFP and mutants expressed in PDAC (B) and L-cells (C). Deletion of any single interaction reduces Fi from the level of wild-type E-cadherin (∼60%) to the level of the non-interacting mutant ΔEC1ΔCyt (∼30%), indicating that all three interactions, cis-, trans-, and cytoplasmic, are required for inclusion of Ecad-GFP into stationary adhesive clusters. Those mutants retaining actin association (trans-, cis-, and ΔEC1 mutants) recover more slowly than mutants lacking the cytoplasmic domain (ΔEC1ΔCyt, and ΔCyt). Retention of cis- and trans- interactions by the ΔCyt mutant did not significantly slow its recovery compared to the ΔEC1ΔCyt mutant. Values for Ecad-GFP and ΔEC1ΔCyt are included from Fig. 2C for comparison; see supplementary material Table S2 for list of all FRAP parameters. (D) TEER measured in L-cells expressing low and high levels of wild-type E-cadherin, and E-cadherin mutants. Note that none of the mutants were able to increase the effective cell adhesion strength as assessed by electrical resistance above the level of L-cells, which did not express E-cadherin. N=3 for each condition; error bars represent s.e.m.
Fig. 4.
Fig. 4.
E-cadherin expression level affects monomer dynamics. (A,B) Estimation of junctional integrity and cell adhesion strength using TEER (A) and Dispase (B) assays. N=3 for each; error bars represent s.e.m. (C) Schematic diagram of different types of cell junctions assayed by FRAP, showing junctions between Ecad-GFP Hi cells (Hi), between Ecad-GFP Lo cells (Lo), between Ecad-GFP Hi cells and the parental cell line (P) expressing endogenous E-cadherin, and between Ecad-GFP Hi cells and L cells (Ø) expressing no E-cadherin. (D) Fi of Ecad-GFP is the same in Ecad-GFP Hi and Ecad-GFP Lo cells (blue and green circles respectively), however T1/2 is shorter for Ecad-GFP Lo cells. The level of Ecad-GFP expression in the neighboring cell of a junction also affects E-cadherin dynamics. When FRAP is measured between cells expressing high levels of Ecad-GFP and no Ecad-GFP (black circles) both T1/2 and Fi are significantly reduced. Fi and T1/2 are further decreased in the absence of trans-dimer formation (red circle). Value for Ecad-GFP is included from Fig. 2C for comparison; see supplementary material Table S2 for list of all FRAP values. Error bars represent s.e.m.
Fig. 5.
Fig. 5.
Crosslinking reveals fast and slow recovering populations. (A) FRAP analysis of the effect of ROI size on T1/2. (B) Western blot probed with anti-E-cadherin antibody demonstrating effects of BS3 treatment. PDAC cells express endogenous E-cadherin, whereas Ecad-GFP cells express endogenous and GFP-labeled protein. Treatment for 20 min in 35 µM BS3 or 10 min in 100 µM BS3 inefficiently cross-linked E-cadherin, whereas 20 min in 100 µM BS3 cross-linked the majority of endogenous and GFP-labeled E-cadherin on the cell surface, as evidenced by the reduction in monomeric E-cadherin. Treatment for 20 min in 100 µM BS3 was unable to cross-link ΔEC1ΔCyt-GFP. The band in lane 2 which runs in the position of ΔEC1ΔCyt-GFP is most likely a degradation product of E-cadherin because it does not blot for GFP. (C) FRAP analysis showing the effects of cross-linking and ROI size. Cross-linking of ΔEC1ΔCyt-GFP had no effect on its mobility. In contrast, the Fi of Ecad-GFP cross-linked with BS3 for 20 min increased from 60% to 85% and the T1/2 decreased from 40 s to 7 s. To confirm that the recovery of Ecad-GFP had become diffusion coupled following cross-linking, the ROI diameter was doubled from 30 to 60 pixels, which significantly increased the recovery half-time. Cross-linking PDAC cells for 10 min in 100 µm BS3 only partially shifted the FRAP parameters towards diffusion uncoupled recovery. Values for Ecad-GFP and ΔEC1ΔCyt are included from Fig. 2C for comparison; see supplementary material Table S2 for list of all FRAP values. A,C: error bars represent s.e.m.
Fig. 6.
Fig. 6.
Schematic diagram showing distribution and dynamics of four E-cadherin populations within the ROI of a FRAP experiment. Non-adhesive immobile monomers (purple) are trapped through non-specific interaction with the cortical cytoskeleton. Non-adhesive mobile monomers (red) are able to move but do not bind to complexes. Adhesive immobile monomers (blue) remain stationary, possibly by virtue of being trapped within cis-strands. Adhesive mobile monomers (cyan) are in dynamic equilibrium with stationary complexes and alternate between transient binding and diffusion.

References

    1. Adams C. L., Chen Y.-T., Smith S. J. and Nelson W. J. (1998). Mechanisms of epithelial cell-cell adhesion and cell compaction revealed by high-resolution tracking of E-cadherin-green fluorescent protein. J. Cell Biol. 142, 1105-1119. 10.1083/jcb.142.4.1105 - DOI - PMC - PubMed
    1. Barry A. K., Tabdili H., Muhamed I., Wu J., Shashikanth N., Gomez G. A., Yap A. S., Gottardi C. J., de Rooij J., Wang N. et al. (2014). alpha-catenin cytomechanics--role in cadherin-dependent adhesion and mechanotransduction. J. Cell Sci. 127, 1779-1791. 10.1242/jcs.139014 - DOI - PMC - PubMed
    1. Boggon T. J., Murray J., Chappuis-Flament S., Wong E., Gumbiner B. M. and Shapiro L. (2002). C-cadherin ectodomain structure and implications for cell adhesion mechanisms. Science 296, 1308-1313. 10.1126/science.1071559 - DOI - PubMed
    1. Brasch J., Harrison O. J., Honig B. and Shapiro L. (2012). Thinking outside the cell: how cadherins drive adhesion. Trends Cell Biol. 22, 299-310. 10.1016/j.tcb.2012.03.004 - DOI - PMC - PubMed
    1. Bulinski J. C., Odde D. J., Howell B. J., Salmon T. D. and Waterman-Storer C. M. (2001). Rapid dynamics of the microtubule binding of ensconsin in vivo. J. Cell Sci. 114, 3885-3897. - PubMed