

Characterization and quantification of proteins secreted by single human embryos prior to implantation
- PMID: 26471863
- PMCID: PMC4644378
- DOI: 10.15252/emmm.201505344
Characterization and quantification of proteins secreted by single human embryos prior to implantation
Abstract
The use of in vitro fertilization (IVF) has revolutionized the treatment of infertility and is now responsible for 1-5% of all births in industrialized countries. During IVF, it is typical for patients to generate multiple embryos. However, only a small proportion of them possess the genetic and metabolic requirements needed in order to produce a healthy pregnancy. The identification of the embryo with the greatest developmental capacity represents a major challenge for fertility clinics. Current methods for the assessment of embryo competence are proven inefficient, and the inadvertent transfer of non-viable embryos is the principal reason why most IVF treatments (approximately two-thirds) end in failure. In this study, we investigate how the application of proteomic measurements could improve success rates in clinical embryology. We describe a procedure that allows the identification and quantification of proteins of embryonic origin, present in attomole concentrations in the blastocoel, the enclosed fluid-filled cavity that forms within 5-day-old human embryos. By using targeted proteomics, we demonstrate the feasibility of quantifying multiple proteins in samples derived from single blastocoels and that such measurements correlate with aspects of embryo viability, such as chromosomal (ploidy) status. This study illustrates the potential of high-sensitivity proteomics to measure clinically relevant biomarkers in minute samples and, more specifically, suggests that key aspects of embryo competence could be measured using a proteomic-based strategy, with negligible risk of harm to the living embryo. Our work paves the way for the development of "next-generation" embryo competence assessment strategies, based on functional proteomics.
Keywords: blastocoel; gene expression; human embryo; in vitro fertilization; proteomics.
© 2015 The Authors. Published under the terms of the CC BY 4.0 license.
Figures
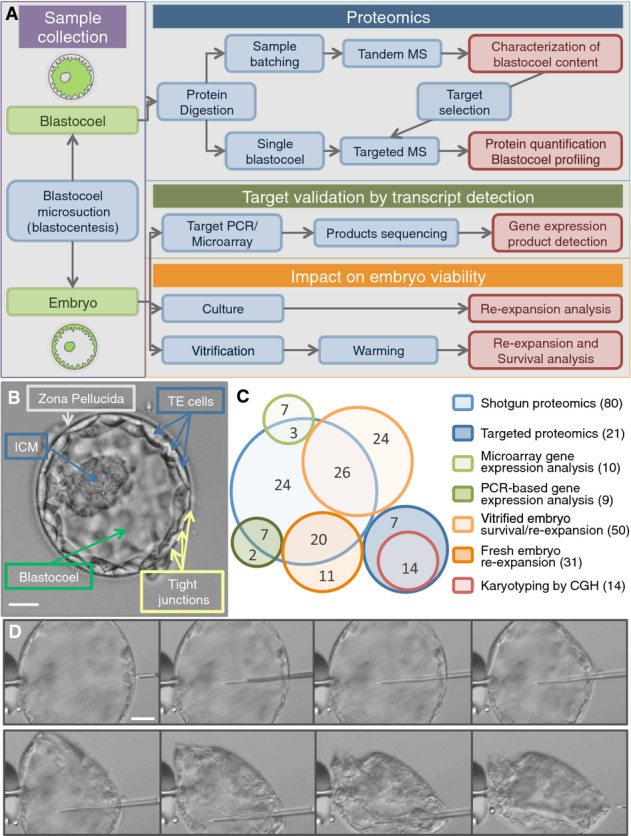
Study workflow and integration of proteomic, genomic, and embryology experiments.
The human embryo developed to the blastocyst stage. Five days after fertilization, a human blastocyst shows an inner cell mass (ICM) that will later develop into all the embryonic tissues and a trophectoderm (TE) that will form the extra-embryonic tissues (e.g., the placenta). TE cells are connected and held together by tight junctions that help to contain the fluid within the blastocoel cavity (blastosol). At this stage, the embryo is usually surrounded by a shell of oocyte-derived glycoproteins, the zona pellucida, from which it will “hatch” prior to implantation. Scale bar: 50 μm.
Embryo usage map. Each circle represents the embryo samples used in specific experimental set (blue, proteomics; orange, embryology; green, gene expression; and red, cytogenetics). Total number per technique is shown in brackets in the legend. In the circles, numbers correspond to the sample used for multiple experiments.
Sequence of photographs showing progression of the microsuction procedure (blastocentesis). Scale bar: 50 μm.
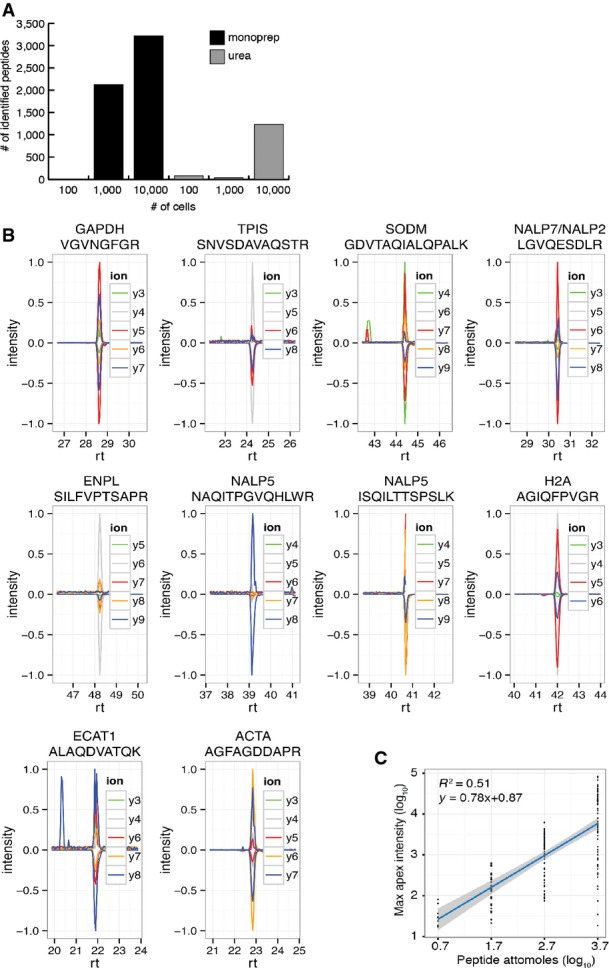
Number of peptides identified using different sample preparation methods (black: solvent-based, MonoPrep; gray: urea-based, standard) on cytosolic lysates of HeLa cells at different concentrations (100, 1,000 and 10,000 cells corresponding to an estimated protein amount of 8, 80 and 800 ng, respectively).
Validation of ten SRM assays on samples of five blastocoels. Batched samples obtained from 5 blastocoels were spiked with isotopically labeled versions of the target peptides. SRM assays were manually validated on the basis of the co-elution and relative intensities of at least 4 transitions per assay. Transition traces are displayed using their relative intensities (with the intensity of the highest transition per assay being set to 1). Positive values are used for endogenous peptides, while negative values are used for reference (synthetic) peptides. Horizontal axis displays peptide retention time (rt) in minutes.
Intensity calibration curve derived from 76 absolutely quantified (AQUA) peptides measured at different concentrations. The linear regression between log10-transformed maximum apex intensity (derived from the maximum of the most intense transition trace) and log10-transformed attomoles of peptide injected was used to transform SRM-derived peptide intensities for blastocoel proteins into absolute abundances.
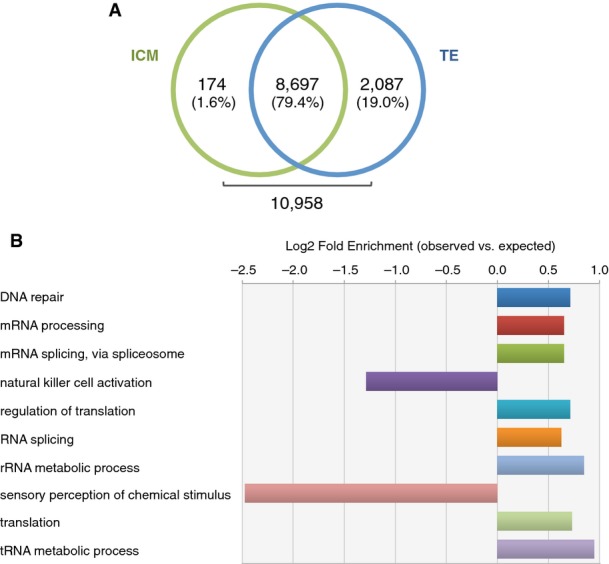
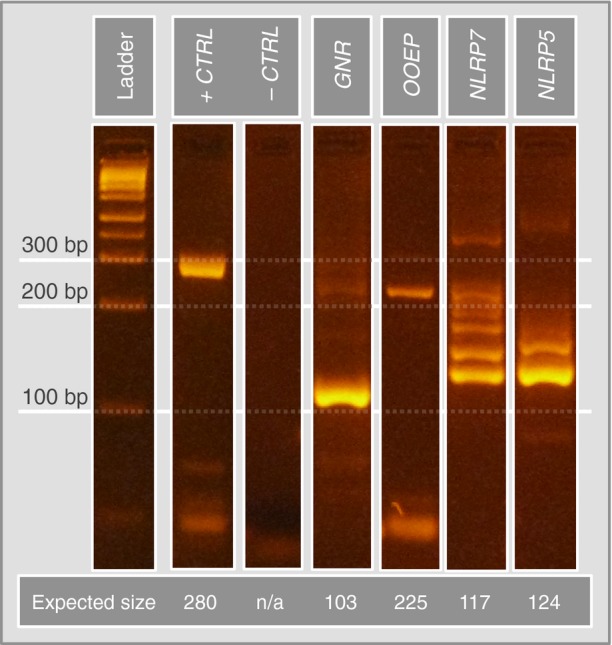
Actively transcribed genes in ICM (green) and TE (blue) cells. No transcript showed significant differential expression.
Blastocyst gene expression investigated using Panther database statistical overrepresentation test comparing global blastocyst transcript list to the default human whole-genome list, which included all genes present in the Panther database. Only biological processes of actively transcribed genes in the human blastocyst with fold enrichment < 0.5 and > 1.5 and P-value < 0.01 are shown. Bar lengths are displayed as Log2 of the ratio between observed and expected number of genes for each category. Raw data and P-values for each category are shown in Table EV3.
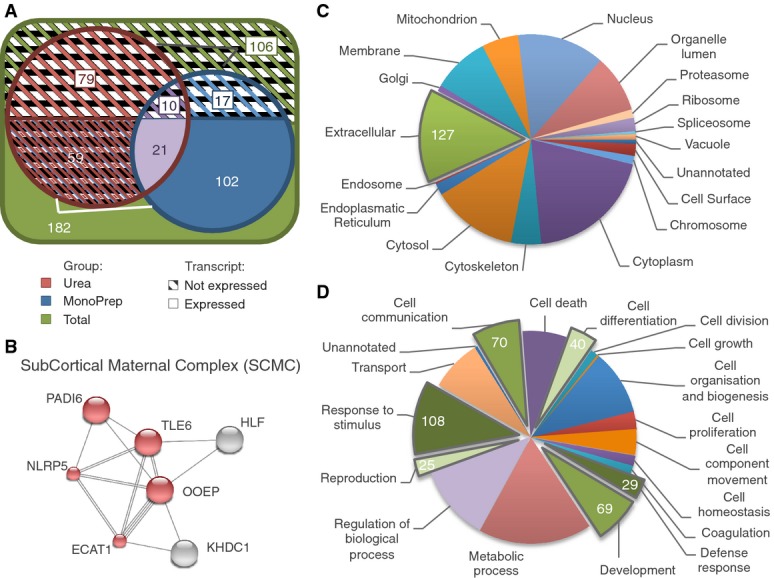
A About 182 proteins identified from the blastocoel fluid had corresponding mRNA transcripts detected in embryos. The total number of proteins identified according to type of sample preparation method used is shown (red, urea; blue, MonoPrep; purple, shared; green, total). Full and barred sections refer to proteins confirmed and unconfirmed by gene expression of whole human blastocysts using microarrays, respectively.
B The subcortical maternal complex (SCMC) is shown as an example of embryo-specific proteins identified. Complex subunits identified with mass spectrometry (MS) are shown in red, and protein interactions were derived from STRING (Jensen et al, 2009). Multiple lines indicate the existence of different evidences in the STRING database supporting the interaction.
C, D Gene Ontology (GO) classification indicating subcellular localization (C) and function (D) of the 182 blastocoel proteins identified by MS and validated with gene expression analysis. In (C), proteins localized in the extracellular space were highlighted as potentially involved in autocrine or paracrine signaling. In (D), groups with functions associated with embryo development and implantation processes were highlighted. GO annotations were obtained using Protein Center software (Thermo Fisher, USA). Note: Most proteins have multiple annotations.
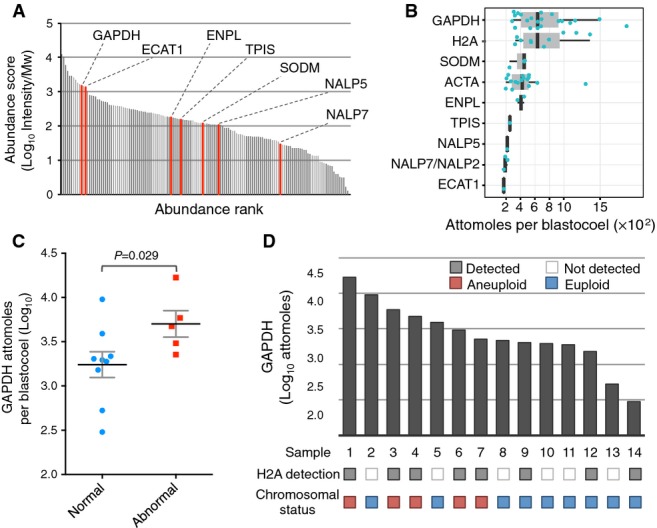
Protein abundance profile of 20 pooled blastocoels. SRM assays were developed for the proteins shown in red.
Summary of estimated protein abundances from measurements of 9 targets in 21 single blastocoel fluids. Absolute protein amounts were estimated from peptide intensities upon calibration using a set of absolutely quantified (AQUA) peptides (FigEV1B, see Materials and Methods for details). Blue dots correspond to individual data points. Black vertical bars indicate median values. Grey boxes show inter quartile ranges (IQR, Q3–Q1). Whiskers show Q1–1.5×IQR and Q3+1.5×IQR ranges.
GAPDH abundances per single blastocoel grouped based on embryo chromosomal status. P-values were calculated with Mann–Whitney U-test. Black bar: mean value; gray bars: SEM.
Measurements of GAPDH and detection of H2A family proteins in samples derived from 14 single blastocoels and chromosomal status of the embryo. The presence or absence of embryo aneuploidy was assessed by aCGH.
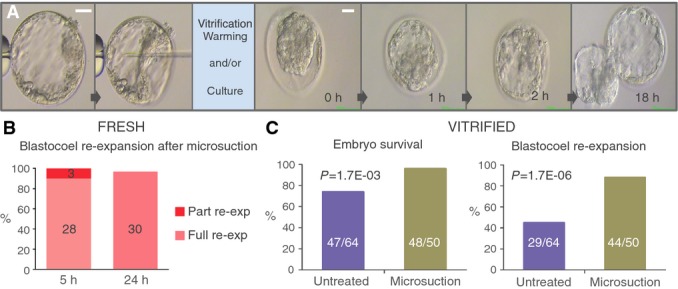
Time-lapse photography of a human blastocyst collapsed using microsuction prior to cryopreservation or culture (left) and subsequent re-expansion to normal morphology (right). Scale bars: 50 μm.
Re-expansion rates of human blastocysts treated with microsuction prior to incubation for 5 and 24 h.
Embryo survival (left) and full re-expansion (right) rates in human blastocysts treated with microsuction or untreated prior to vitrification/warming and culture for 5 h. P-values calculated using two-tailed Fisher’s exact test (C.I. 95%).
References
-
- Akoury E, Zhang L, Ao A, Slim R. NLRP7 and KHDC3L, the two maternal-effect proteins responsible for recurrent hydatidiform moles, co-localize to the oocyte cytoskeleton. Hum Reprod. 2015;30:159–169. - PubMed
-
- Bevilacqua E, Paulesu L, Ferro EAV, Ietta F, Faria MR, Lorenzon AR, Costa AF, Martucci M. Review: putative roles for the macrophage migratory inhibitory factor at the maternal fetal interface. Placenta. 2014;35(Suppl):S51–S56. - PubMed
-
- Chen S-U, Lee T-H, Lien Y-R, Tsai Y-Y, Chang L-J, Yang Y-S. Microsuction of blastocoelic fluid before vitrification increased survival and pregnancy of mouse expanded blastocysts, but pretreatment with the cytoskeletal stabilizer did not increase blastocyst survival. Fertil Steril. 2005;84(Suppl 2):1156–1162. - PubMed
Publication types
MeSH terms
Substances
Grants and funding
LinkOut - more resources
Full Text Sources
Other Literature Sources
Molecular Biology Databases
