. 2015 Dec;35(12):1031-9.
doi: 10.1016/j.nutres.2015.09.003. Epub 2015 Sep 7.

Sarcopenia, sarcopenic obesity, and functional impairments in older adults: National Health and Nutrition Examination Surveys 1999-2004

Affiliations

Sarcopenia, sarcopenic obesity, and functional impairments in older adults: National Health and Nutrition Examination Surveys 1999-2004

John A Batsis et al. Nutr Res. 2015 Dec.

Abstract

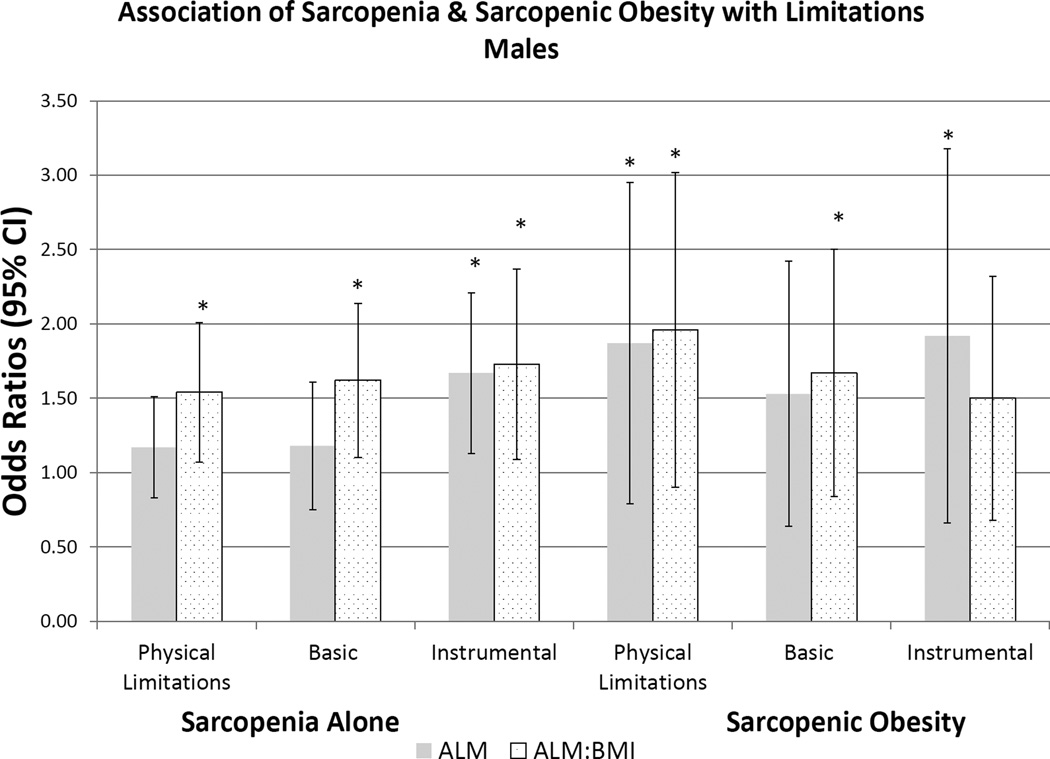
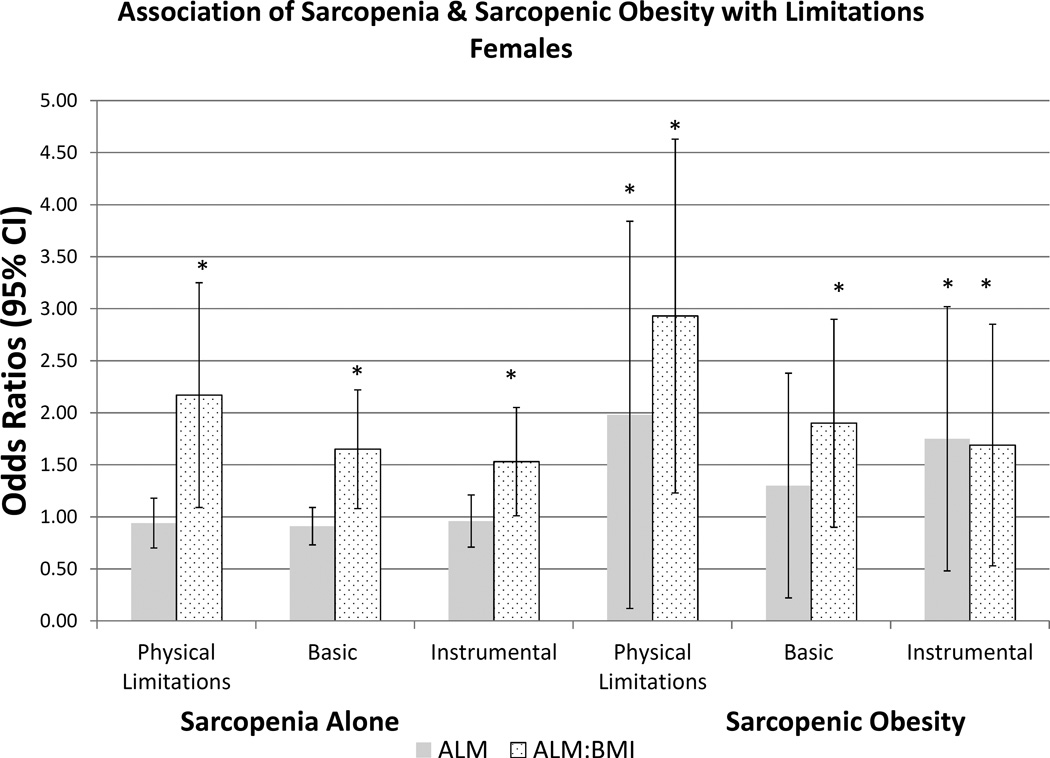
The Foundation for the National Institutes of Health Sarcopenia Project validated cutpoints for appendicular lean mass (ALM) to identify individuals with functional impairment. We hypothesized that the prevalence of sarcopenia and sarcopenic obesity would be similar based on the different Foundation for the National Institutes of Health criteria, increase with age, and be associated with risk of impairment limitations. We identified 4984 subjects at least 60 years of age from the National Health and Nutrition Examination Surveys 1999-2004. Sarcopenia was defined using ALM (men <19.75 kg, women <15.02 kg) and ALM adjusted for body mass index (BMI; men <0.789 kg/m2, women <0.512 kg/m2). Sarcopenic obesity is defined as subjects fulfilling the criteria for sarcopenia and obesity by body fat (men ≥25%, women ≥35%). Prevalence rates of both sarcopenia and sarcopenic obesity were evaluated with respect to sex, age category (60-69, 70-79, and >80 years) and race. We assessed the association of physical limitations, basic and instrumental activities of daily living and sarcopenia status. The mean age was 70.5 years in men and 71.6 years in women. Half (50.8%; n = 2531) were female, and mean BMI was 28 kg/m2 in both sexes. Appendicular lean mass was higher in men than in women (24.1 vs. 16.3; P < .001), but fat mass was lower (30.9 vs. 42.0; P < .001). In men, sarcopenia prevalence was 16.0% and 27.8% using the ALM and ALM/BMI criteria. In women, prevalence was 40.5% and 19.3% using the ALM and ALM/BMI criteria. Sarcopenia was associated with a 1.10 (0.86-1.41) and 0.93 (0.74-1.16), and 1.46 (1.10-1.94), and 2.13 (1.41-3.20) risk of physical limitations using the ALM and ALM/BMI definitions in men and women, respectively. Prevalence of sarcopenia and sarcopenic obesity varies greatly, and a uniform definition is needed to identify and characterize these high-risk populations.

Keywords: Body fat; Epidemiology; Function; Obesity; Sarcopenia.


Figures

Figure 1
Figure 1
a-legend: Association of Physical Limitations, Basic and Instrumental Activities of Daily Living with Definition of Sarcopenia in Males. Multivariable logistic regression estimates are represented as Odds Ratios (95% Confidence Intervals). The primary predictor was sarcopenia (yes/no) and sarcopenic obesity (yes/no), respectfully. Referent Category is ‘no sarcopenia’ based on Foundation for the National Institutes for Health definitions, Appendicular Lean Muscle (ALM) cutoffs of: <19.75kg in males and <15.02kg in females; ALM/BMI cutoffs of <0.789kg in men and <0.512 in females. Separate models were created for the primary outcomes of Physical Limitations, Basic ADLs, and Instrumental ADLs. Model 3 is represented, adjusted age, race, smoking status (current, former, never), diabetes and arthritis. * - indicates statistical significance b-legend: Association of Physical Limitations, Basic and Instrumental Activities of Daily Living with Definition of Sarcopenia in Females. Multivariable logistic regression estimates are represented as Odds Ratios (95% Confidence Intervals). The primary predictor was sarcopenia (yes/no) and sarcopenic obesity (yes/no), respectfully. Referent Category is ‘no sarcopenia’ based on Foundation for the National Institutes for Health definitions, Appendicular Lean Muscle (ALM) cutoffs of: <19.75kg in males and <15.02kg in females; ALM/BMI cutoffs of <0.789kg in men and <0.512 in females. Separate models were created for the primary outcomes of Physical Limitations, Basic ADLs, and Instrumental ADLs. Model 3 is represented, adjusted age, race, smoking status (current, former, never), diabetes and arthritis. * - indicates statistical significance
Figure 1
Figure 1
a-legend: Association of Physical Limitations, Basic and Instrumental Activities of Daily Living with Definition of Sarcopenia in Males. Multivariable logistic regression estimates are represented as Odds Ratios (95% Confidence Intervals). The primary predictor was sarcopenia (yes/no) and sarcopenic obesity (yes/no), respectfully. Referent Category is ‘no sarcopenia’ based on Foundation for the National Institutes for Health definitions, Appendicular Lean Muscle (ALM) cutoffs of: <19.75kg in males and <15.02kg in females; ALM/BMI cutoffs of <0.789kg in men and <0.512 in females. Separate models were created for the primary outcomes of Physical Limitations, Basic ADLs, and Instrumental ADLs. Model 3 is represented, adjusted age, race, smoking status (current, former, never), diabetes and arthritis. * - indicates statistical significance b-legend: Association of Physical Limitations, Basic and Instrumental Activities of Daily Living with Definition of Sarcopenia in Females. Multivariable logistic regression estimates are represented as Odds Ratios (95% Confidence Intervals). The primary predictor was sarcopenia (yes/no) and sarcopenic obesity (yes/no), respectfully. Referent Category is ‘no sarcopenia’ based on Foundation for the National Institutes for Health definitions, Appendicular Lean Muscle (ALM) cutoffs of: <19.75kg in males and <15.02kg in females; ALM/BMI cutoffs of <0.789kg in men and <0.512 in females. Separate models were created for the primary outcomes of Physical Limitations, Basic ADLs, and Instrumental ADLs. Model 3 is represented, adjusted age, race, smoking status (current, former, never), diabetes and arthritis. * - indicates statistical significance

References

    1. Lubitz J, Cai L, Kramarow E, Lentzner H. Health, life expectancy, and health care spending among the elderly. N Engl J Med. 2003;349:1048–1055. - PubMed
    1. Dunlop DD, Hughes SL, Manheim LM. Disability in activities of daily living: patterns of change and a hierarchy of disability. Am J Public Health. 1997;87:378–383. - PMC - PubMed
    1. Gill TM, Gahbauer EA, Murphy TE, Han L, Allore HG. Risk factors and precipitants of long-term disability in community mobility: a cohort study of older persons. Ann Intern Med. 2012;156:131–140. - PMC - PubMed
    1. Guralnik JM, LaCroix AZ, Branch LG, Kasl SV, Wallace RB. Morbidity and disability in older persons in the years prior to death. Am J Public Health. 1991;81:443–447. - PMC - PubMed
    1. Jette AM, Branch LG. Impairment and disability in the aged. J Chronic Dis. 1985;38:59–65. - PubMed

Publication types

MeSH terms