. 2015 Oct 27;6(33):34859-74.
doi: 10.18632/oncotarget.5414.

Targeting EMP3 suppresses proliferation and invasion of hepatocellular carcinoma cells through inactivation of PI3K/Akt pathway

Affiliations

Targeting EMP3 suppresses proliferation and invasion of hepatocellular carcinoma cells through inactivation of PI3K/Akt pathway

Yi-Hsien Hsieh et al. Oncotarget. .

Abstract

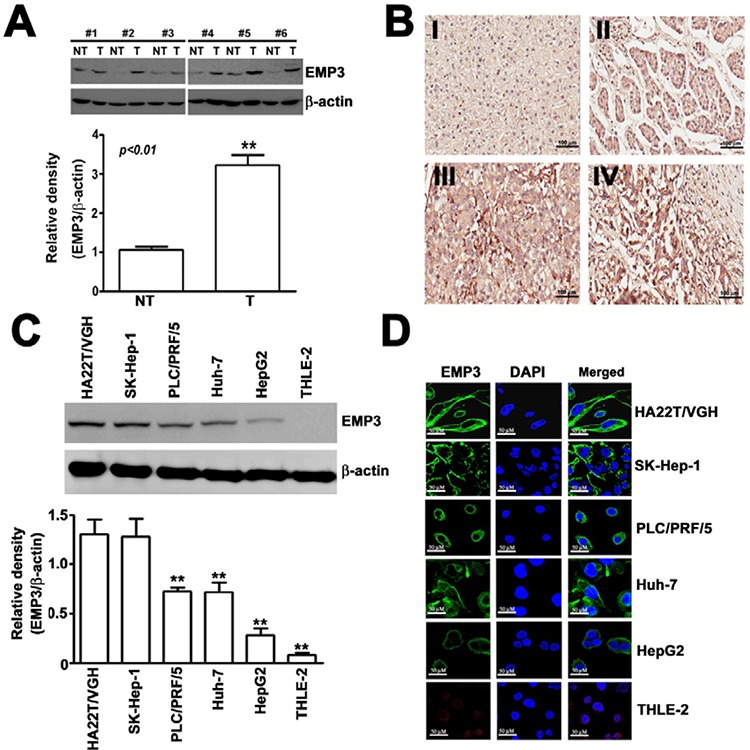
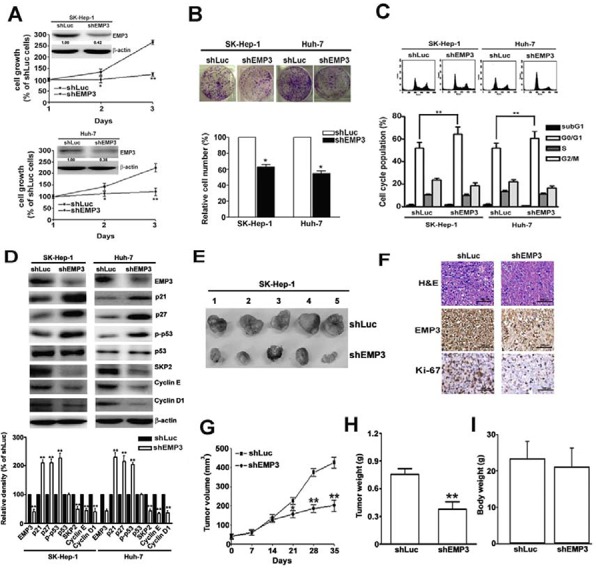
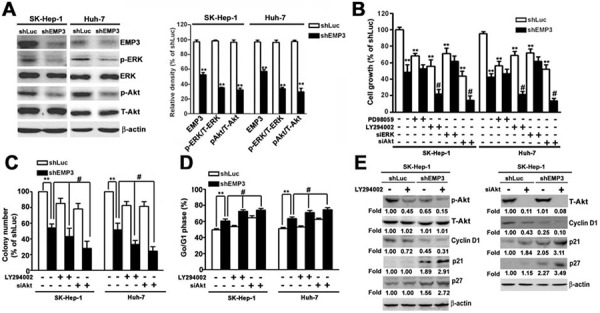
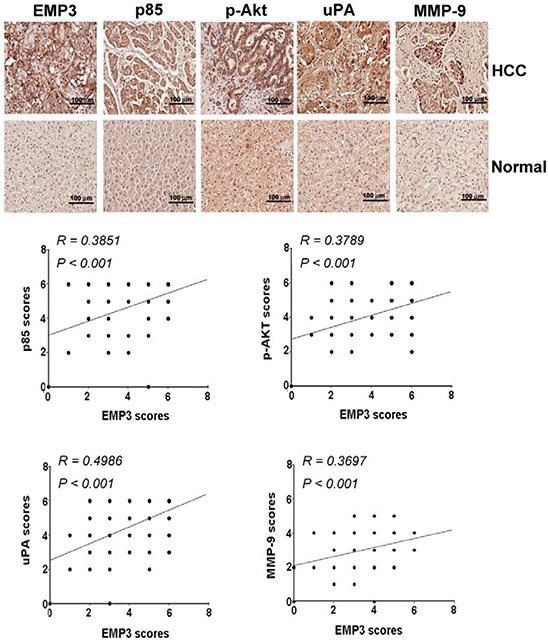
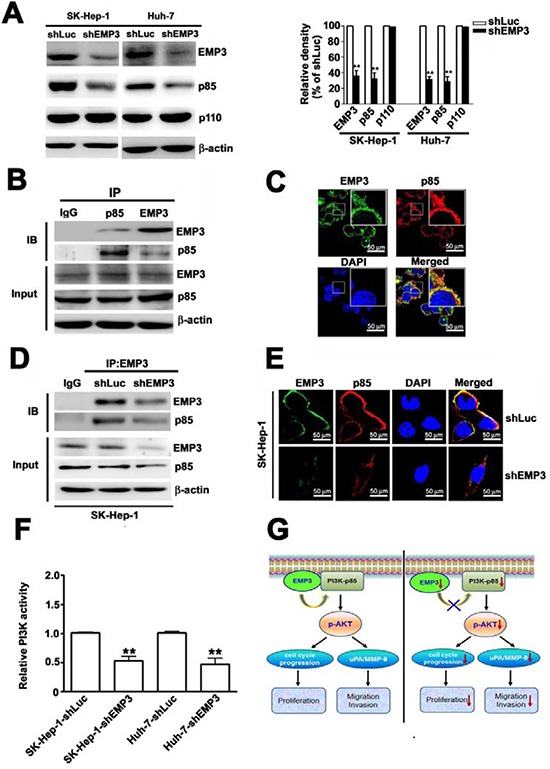
Epithelial membrane protein-3 (EMP3), a typical member of the epithelial membrane protein (EMP) family, is epigenetically silenced in some cancer types, and has been proposed to be a tumor suppressor gene. However, its effects on tumor suppression are controversial and its roles in development and malignancy of hepatocellular carcinoma (HCC) remain unclear. In the present study, we found that EMP3 was highly expressed in the tumorous tissues comparing to the matched normal tissues, and negatively correlated with differentiated degree of HCC patients. Knockdown of EMP3 significantly reduced cell proliferation, arrested cell cycle at G1 phase, and inhibited the motility and invasiveness in accordance with the decreased expression and activity of urokinase plasminogen activator (uPA) and matrix metalloproteinase 9 (MMP-9) in HCC cells. The in vivo tumor growth of HCC was effectively suppressed by knockdown of EMP3 in a xenograft mouse model. The EMP3 knockdown-reduced cell proliferation and invasion were attenuated by inhibition of phosphatidylinositol 3-kinase (PI3K) or knockdown of Akt, and rescued by overexpression of Akt in HCC cells. Clinical positive correlations of EMP3 with p85 regulatory subunit of PI3K, p-Akt, uPA, as well as MMP-9 were observed in the tissue sections from HCC patients. Here, we elucidated the tumor progressive effects of EMP3 through PI3K/Akt pathway and uPA/MMP-9 cascade in HCC cells. The findings provided a new insight into EMP3, which might be a potential molecular target for diagnosis and treatment of HCC.

Keywords: epithelial membrane protein-3; hepatocellular carcinoma; invasion; migration; proliferation.


Conflict of interest statement

CONFLICTS OF INTEREST

There is no conflicts of interest.

Figures

Figure 1
Figure 1. EMP3 is highly expressed in tissue sections from HCC patients and in HCC cell lines
A. The expression of EMP3 was examined by immunoblotting. Upper panel: the representative results of the amounts of EMP3 in paired non-tumorous (NT) and tumorous (T) tissue samples from clinical HCC patients. Lower plot: the relative amounts of EMP3 normalized by β-actin from 16 NT/T paired HCC tissues. **, P < 0.01, compared with that of the non-tumorous (NT) tissues. B. The representative IHC staining of EMP3 from normal tissues (I) and different differentiated HCC tumorous (II-IV). Scale bars = 100 μm. C. The protein expression levels of EMP3 in different differentiated HCC cell lines, including poor differentiated HA22T/VGH and SK-Hep-1, and moderate differentiated PLC/PRF/5 and Huh-7, well differentiated HepG2 cells, and normal hepatic THLE-2 cells. The bottom plot was the quantitative amounts of EMP3 normalized by β-actin in each cell line from three independent experiments. D. The IF staining of EMP3 (green color) and DAPI staining of nucleus (blue color) in each cell line. Scale bars = 50 μm. Data are presented as the mean ± SE of at least three independent experiments. **, p < 0.01.
Figure 2
Figure 2. Knockdown of EMP3 suppresses cell proliferation, cell cycle progression, and tumor growth of HCC
A. Inserted plot: the amounts of EMP3 determined by immunoblotting in the shLu- and shEMP3-SK-Hep-1 and Huh-7 cells. The cell growth curve of each infected cell line was determined by MTT assay. B. The clonogenic ability of each infected cell line was examined by colony formation assay. The bottom plot was the quantitative results comparing to that of shLuc-infected cells. C. Upper plot: the representative results of cell cycle distribution determined by flow cytometer. The bottom plot was the percentage of cell distribution at sub-G1, G1, S, and G2/M phases of shLuc or shEMP3 cells. D. The expression of EMP3 and cell cycle related proteins as indicated were determined by immunoblotting. The relative amount of each protein comparing to that in shLuc cells was shown in the bottom. Nude mice were subcutaneously inoculated with 5 × 10⁶ shLuc- or shEMP3-cells and the tumor volume was measured at indicated time intervals. The representative results of tumor mass in each group were shown in E. The representative results of IHC staining against EMP3 and Ki-67 and hematoxylin and eosin (H & E) staining of tissue sections were shown in F. Scale bars = 100 μm. G. The volume and H. weight of tumor mass, and I. the body weight from 5 mice were shown, respectively. Data are presented as the mean ± SE of at least three independent experiments. *, p < 0.05; **, p < 0.01.
Figure 3
Figure 3. Knockdown of EMP3 inhibits the abilities of migration and invasion of HCC cells through down-regulation of MMP-9 and uPA
A. Upper plot: the representative results of the in vitro migration and invasion assay. Lower plot: the relative abilities of migration and invasion of shEMP3 cells was compared to that of shLuc cells. B. The protein expressions of EMP3, MMP-9, and uPA were examined by immunoblotting. β-actin was an internal control. The relative amount of indicated protein was shown in the bottom plot from 3 independent experiments. C. Upper panel: the proteolytic activity was examined by zymography. Lower plot: the relative density of proteolytic band of MMP-9, MMP-2, and uPA from 3 independent experiments. D. The IF staining of EMP3 (green), MMP-9 (red), and uPA (red) and DAPI staining of nucleus (blue color) in each cell line. Scale bars = 50 μm. Data are presented as the mean ± SE of at least three independent experiments. **, p < 0.01.
Figure 4
Figure 4. Knockdown of EMP3 suppresses cell proliferation of HCC cells mainly through inactivation of PI3K/Akt pathway
A. The expressions of indicated proteins were examined by immunoblotting. The relative amounts of indicated proteins in shEMP3 cells comparing to that in shLuc-infected cells were shown in the right plot. B. Cells were treated with or without 30 μM of PD98059 (a MEK inhibitor), or 30 μM of LY294002 (a PI3K inhibitor) for 2 h, or transfected with siRNA towards ERK or Akt, and then the cell growth was determined by MTT assay. C. Cells were treated with or without 30 μM of LY294002, or transfected with siRNA towards Akt. The clonogenic ability was examined by colony formation assay. The bottom plot was the quantitative results. D. Cell cycle was determined by flow cytometer. The percentage of cells distributed at G1 phase. The expressions of indicated proteins were examined by immunoblotting in E. Data are presented as the mean ± SE of at least three independent experiments. *, p < 0.05, **, p < 0.01 compared to the expression levels in shLuc cells; #, p < 0.01 compared to the expression levels in untreated shEMP3 cells.
Figure 5
Figure 5. PI3K/Akt pathway regulates MMP-9 and uPA in EMP3-mediated cell migration and invasion of HCC cells
A, B. Cells were treated with or without 30 μM of LY294002 for 2 h. C, D. Cells were silenced by the siRNAs against mock (neo) or Akt (siAkt). E, F. Cells were transfected and overexpressed with mock (neo) or HA-tagged Akt (HA-Akt) plasmid. The migratory and invasive abilities were examined in A, C, and E. The upper plots were the representative results of the in vitro cell migration and invasion assay. The relative abilities of migration and invasion were shown in the lower plots. B, D, F. The expressions of indicated proteins were determined by immunoblotting. Data are presented as the mean ± SE of at least three independent experiments. **, p < 0.01 comparing to that of shLuc cells; #, p < 0.01 comparing to that of untreated shEMP3 cells.
Figure 6
Figure 6. The clinical relevance of EMP3 to p85/p-Akt and uPA/MMP-9 in HCC patients
A. The indicated protein amounts of the tissue sections from HCC patients were examined by IHC staining and scored from 0 to 8 according to their color density. The upper plots were representative results of IHC staining against indicated proteins. The lower plots were the statistical analysis of the correlation of EMP3 expression with p85, Akt, uPA and MMP-9 expression in HCC tissues. Scale bars = 100 μm.
Figure 7
Figure 7. Knockdown of EMP3 reduces the expression and activity of PI3K in SK-Hep-1 cells and the proposed roles of EMP3 in HCC proliferation and invasion
A. The protein amounts of EMP3, p85 regulatory subunit and p110 catalytic subunit of PI3K, and β-actin were determined by immunoblotting. The quantitative amounts of indicated proteins were shown in the right plot. B. The association between EMP3 and p85 in SK-Hep-1 cells was examined by the reciprocal immunoprecipitation (IP) / immunoblotting (IB) with anti-EMP3 and anti-p85 antibodies as indicated in the upper panel. The lower panel showed the input of the indicated protein in cell lysate. C. The localization of EMP3 (green) and p85 (red) in SK-Hep-1 cells were determined by IF staining. The cell nucleus was stained with DAPI (blue). D. The association of EMP3 and p85 in shLuc-SK-Hep-1 cells and in shEMP3-SK-Hep-1 cells were examined by IP/IB against EMP3 and p85, respectively. The lower panel showed the input of the indicated protein in cell lysate. E. The localization of EMP3 (green) and p85 (red) were determined by IF staining and cell nucleus was stained with DAPI (blue) in SK-Hep-1 cells. F. The relative kinase activity of PI3K was shown. G. The role of EMP3 in cell proliferation and invasion of HCC was illustrated. Left plot: EMP3 associates with PI3K-p85 involved in activation of PI3K/Akt pathway to promote cell cycle progression and proliferation, and also to enhance uPA/MMP-9 required for migration and invasion in HCC cells. Right plot: targeting EMP3 with shRNA to decrease the level of EMP3 results in reduction of PI3K-p85 and inactivation of PI3K/Akt, which contribute to inhibition of cell proliferation and suppression of migration and invasion by down-regulation of uPA/MMP-9 cascade in HCC cells. Data are presented as the mean ± SE of at least three independent experiments. **, p < 0.01. Scale bars = 50 μm.

References

    1. El-Serag HB, Rudolph KL. Hepatocellular carcinoma: epidemiology and molecular carcinogenesis. Gastroenterology. 2007;132:2557–2576. - PubMed
    1. El-Serag HB. Hepatocellular carcinoma. The New England journal of medicine. 2011;365:1118–1127. - PubMed
    1. Lencioni R, Chen XP, Dagher L, Venook AP. Treatment of intermediate/advanced hepatocellular carcinoma in the clinic: how can outcomes be improved? The oncologist. 2010;15:42–52. - PubMed
    1. Yoo DJ, Kim KM, Jin YJ, Shim JH, Ko GY, Yoon HK, Sung KB, Lee JL, Kang YK, Lim YS, Lee HC, Chung YH, Lee YS, Suh DJ. Clinical outcome of 251 patients with extrahepatic metastasis at initial diagnosis of hepatocellular carcinoma: does transarterial chemoembolization improve survival in these patients? Journal of gastroenterology and hepatology. 2011;26:145–154. - PubMed
    1. Chaffer CL, Weinberg RA. A perspective on cancer cell metastasis. Science. 2011;331:1559–1564. - PubMed

Publication types

MeSH terms

Substances