. 2016 Jan;25(1):174-9.
doi: 10.1158/1055-9965.EPI-15-0921. Epub 2015 Oct 15.

Contributions of Subtypes of Non-Hodgkin Lymphoma to Mortality Trends

Affiliations

Contributions of Subtypes of Non-Hodgkin Lymphoma to Mortality Trends

Nadia Howlader et al. Cancer Epidemiol Biomarkers Prev. 2016 Jan.

Abstract

Background: Non-Hodgkin lymphoma (NHL) comprises distinct tumor subtypes. Although mortality from NHL overall has changed dramatically in the United States over time, little is known about trends for subtypes, because death certificates do not record this information.

Methods: Using data from U.S. Surveillance, Epidemiology, and End Results (SEER) areas, we assessed NHL mortality rates and mapped NHL deaths to incident NHL cases in SEER cancer registries. This allowed us to evaluate population-level mortality trends attributed to specific NHL subtypes (incidence-based mortality; IBM). We also describe NHL incidence and survival after NHL diagnosis by calendar year. We used Joinpoint to identify years when IBM and incidence rate trends changed slope.

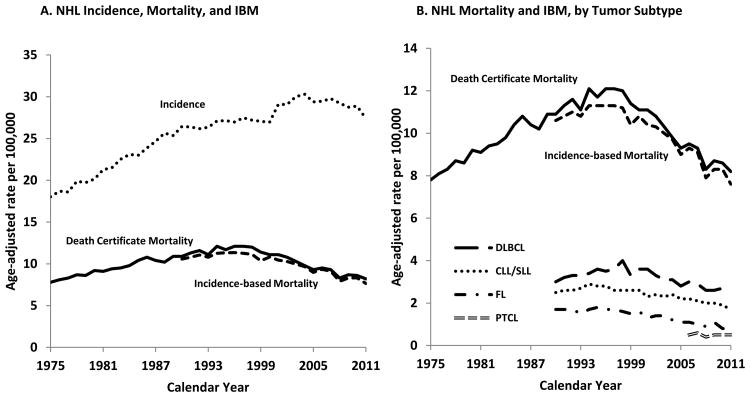
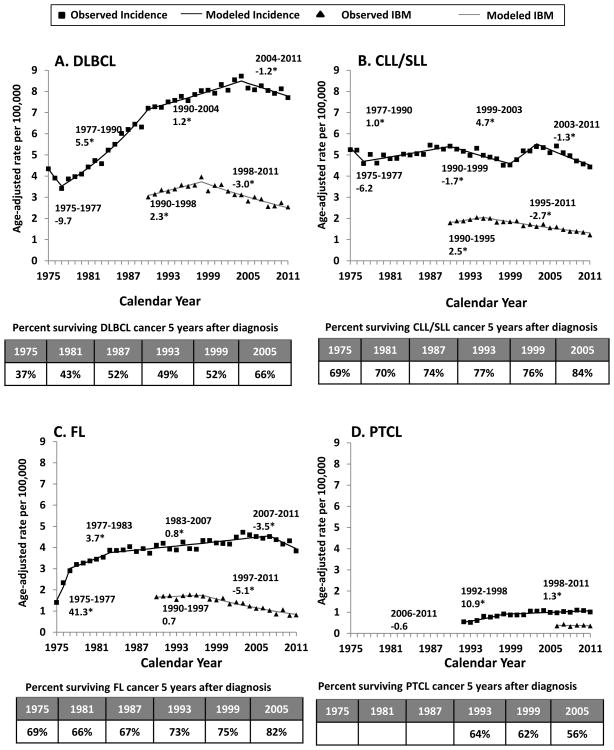
Results: Overall NHL mortality rates increased during 1975-1997, peaking at 10.9 per 100,000 person-years, then decreased subsequently in 1997-2011. Overall IBM rates mirror this trend during 1990-2011. For B-cell NHL subtypes, IBM rates decreased beginning in the mid-1990s, with yearly declines of -3.0% for diffuse large B-cell lymphoma (DLBCL), -2.7% for chronic lymphocytic leukemia/small lymphocytic lymphoma (CLL/SLL), and -5.3% for follicular lymphoma. Incidence rates for these subtypes did not decrease until after 2003. Corresponding 5-year cancer-specific survival increased dramatically over time for DLBCL (from 37%-66%), CLL/SLL (69%-84%), and follicular lymphoma (69%-82%). IBM for peripheral T-cell lymphoma was flat during 2006-2011, although incidence increased.

Conclusions: Mortality due to three common B-cell NHL subtypes has fallen over time in the United States.

Impact: This decline reflects better survival after NHL diagnosis, likely from improved therapies, because the decline in NHL incidence occurred later.


Conflict of interest statement

The authors have no conflict of interest to declare.

Figures

Figure 1
Figure 1. Non-Hodgkin Lymphoma (NHL) Incidence, Death Certificate Mortality, and Incidence-based Mortality (IBM) Rates. SEER-9, 1975-2011
In panel A, results are shown for NHL death certificate mortality (black solid line), IBM (black dashed line, starting in 1990), and incidence (black dotted line). In panel B, the results for NHL death certificate mortality and IBM are presented again along with the IBM for four NHL subtypes: DLBCL (big dashed line), CLL/SLL (dotted dashed line), FL (dashed followed by dotted line), and PTCL (grey dashed line). Note that the vertical axis differs in panels A and B. Results are shown for SEER-9 registries. See Supplemental Figure 1 legend for a description of these registries and codes for NHL mortality and IBM CODs.
Figure 2
Figure 2. Non-Hodgkin Lymphoma (NHL) Incidence, Incidence-based Mortality (IBM), and Survival Trends
Results are shown for DLBCL (panel A), CLL/SLL (panel B), FL (panel C), and PTCL (panel D). For each panel, we show age-adjusted incidence rates in black (observed rates as squares, modeled rates as lines) and age-adjusted IBM rates in black (observed rates as triangles, and modeled rates as lines). Incidence rates were adjusted for reporting delays. The line segments of each curve were selected using the Joinpoint program, and the numbers on the graph indicate the slopes of each line segment denoted as annual percent change (APC). Asterisks (*) are used to denote APCs that are significantly different from zero (p-value <0.05). We also show 5-year age-standardized cancer-specific survival according to year of NHL diagnosis in a table at the bottom of each panel. Results are shown for SEER-9 registries. The following ICD-O-3 histology codes were used to define each of the four main subtypes: DLBCL (9678, 9679, 9680, 9684, 9688, 9712, 9737-9738), CLL/SLL (9670, 9823), FL (9690, 9691, 9695, 9698), and PTCL (9675, 9702, 9705, 9708, 9714, 9716, 9717, 9718, 9709, 9726). See Supplemental Figure 1 legend for a description of these registries and codes for NHL mortality and IBM CODs.

References

    1. Jaffe ESHN, Stein H, Vardiman JW, editors. World Health Organization Classification of Tumours Pathology and Genetics of Tumours of Haematopoietic and Lymphoid Tissues. Lyon, France: IARC Press; 2001.
    1. Morton LM, Turner JJ, Cerhan JR, Linet MS, Treseler PA, Clarke CA, et al. Proposed classification of lymphoid neoplasms for epidemiologic research from the Pathology Working Group of the International Lymphoma Epidemiology Consortium (InterLymph) Blood. 2007;110:695–708. - PMC - PubMed
    1. Morton LM, W S, Devesa SS, et al. Lymphoma incidence patterns by WHO subtype in the United States, 1992-2001. Blood. 2006;107:265–76. - PMC - PubMed
    1. Willett EV, Morton LM, Hartge P, Becker N, Bernstein L, Boffetta P, et al. Non-Hodgkin lymphoma and obesity: A pooled analysis from the InterLymph Consortium. International Journal of Cancer. 2008;122:2062–70. - PMC - PubMed
    1. Howlader N, Noone Anne-Michelle, Krapcho M. SEER Cancer Statistics Review (CSR) 1975-2011. available from: http://seer.cancer.gov/csr/1975_2011/

Publication types

MeSH terms