

Advanced Glycation End Products Affect Osteoblast Proliferation and Function by Modulating Autophagy Via the Receptor of Advanced Glycation End Products/Raf Protein/Mitogen-activated Protein Kinase/Extracellular Signal-regulated Kinase Kinase/Extracellular Signal-regulated Kinase (RAGE/Raf/MEK/ERK) Pathway
- PMID: 26472922
- PMCID: PMC4653677
- DOI: 10.1074/jbc.M115.669499
Advanced Glycation End Products Affect Osteoblast Proliferation and Function by Modulating Autophagy Via the Receptor of Advanced Glycation End Products/Raf Protein/Mitogen-activated Protein Kinase/Extracellular Signal-regulated Kinase Kinase/Extracellular Signal-regulated Kinase (RAGE/Raf/MEK/ERK) Pathway
Abstract
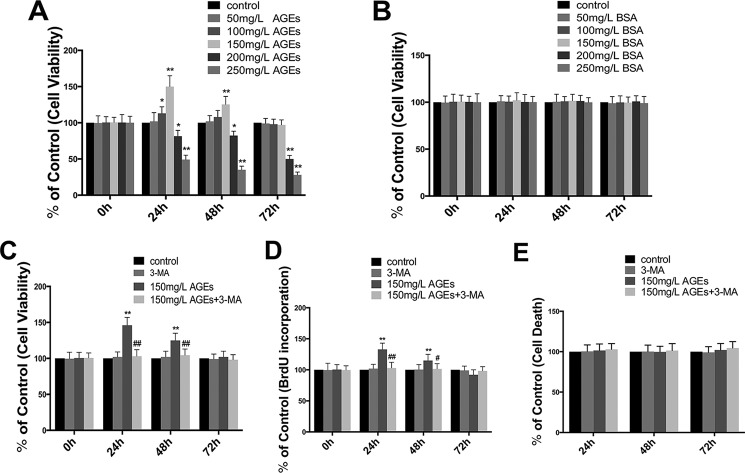
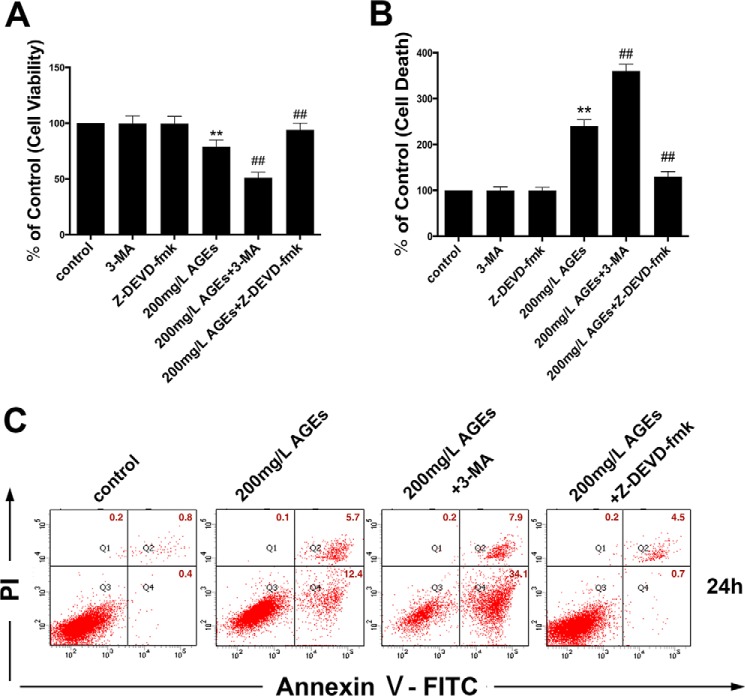
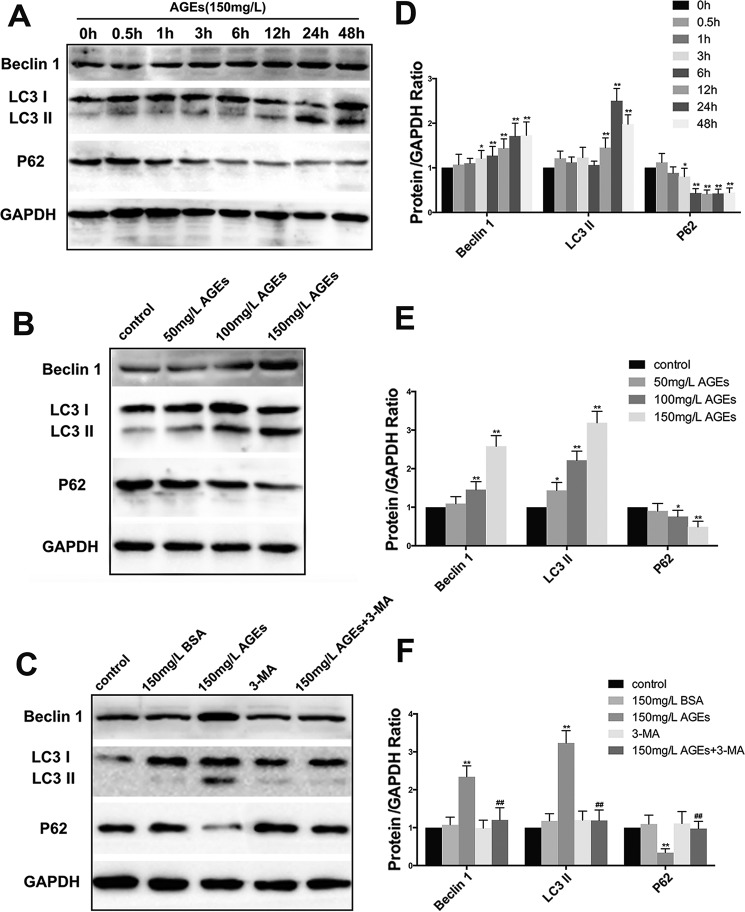
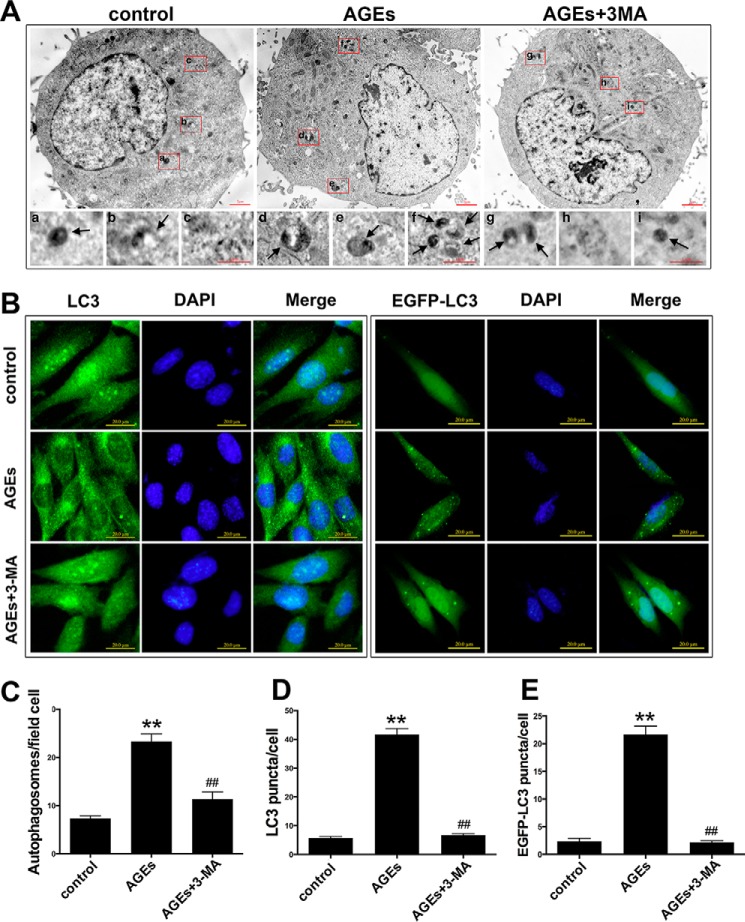
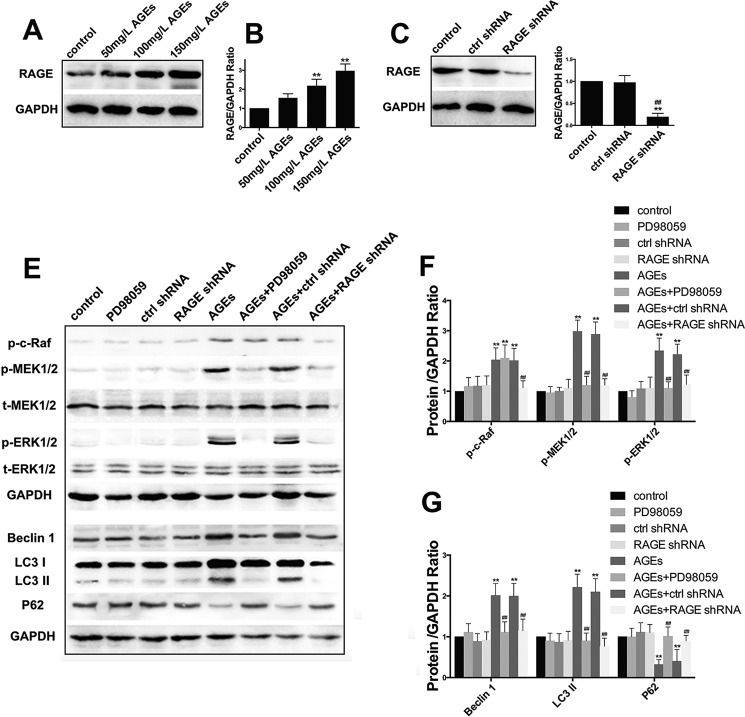
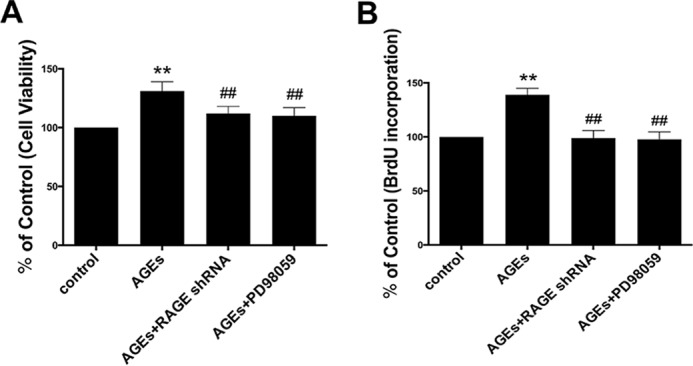
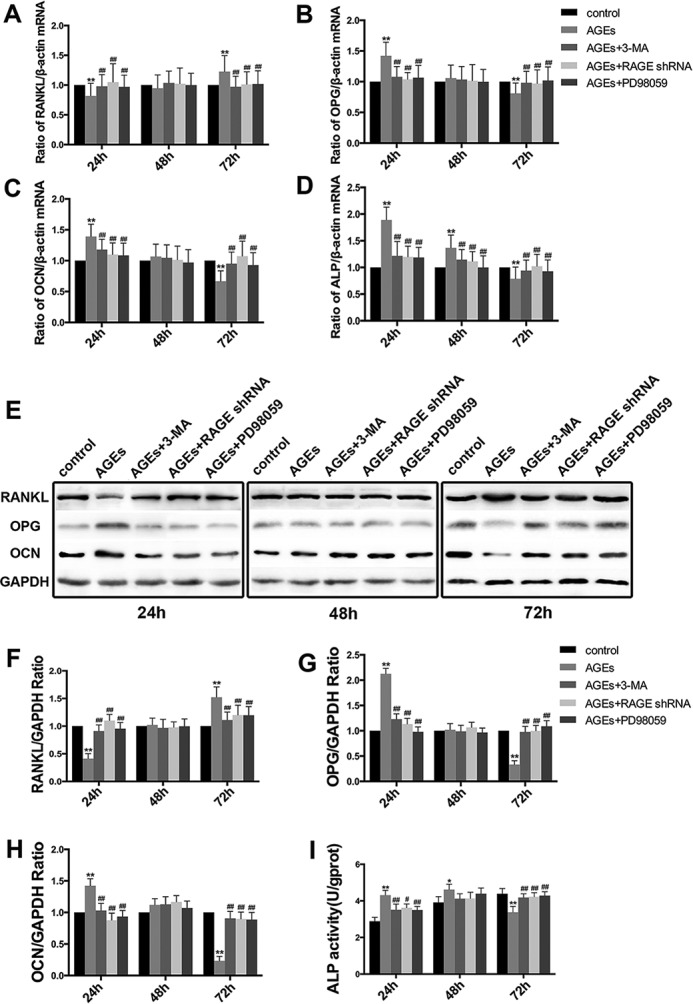
The interaction between advanced glycation end products (AGEs) and receptor of AGEs (RAGE) is associated with the development and progression of diabetes-associated osteoporosis, but the mechanisms involved are still poorly understood. In this study, we found that AGE-modified bovine serum albumin (AGE-BSA) induced a biphasic effect on the viability of hFOB1.19 cells; cell proliferation was stimulated after exposure to low dose AGE-BSA, but cell apoptosis was stimulated after exposure to high dose AGE-BSA. The low dose AGE-BSA facilitates proliferation of hFOB1.19 cells by concomitantly promoting autophagy, RAGE production, and the Raf/MEK/ERK signaling pathway activation. Furthermore, we investigated the effects of AGE-BSA on the function of hFOB1.19 cells. Interestingly, the results suggest that the short term effects of low dose AGE-BSA increase osteogenic function and decrease osteoclastogenic function, which are likely mediated by autophagy and the RAGE/Raf/MEK/ERK signal pathway. In contrast, with increased treatment time, the opposite effects were observed. Collectively, AGE-BSA had a biphasic effect on the viability of hFOB1.19 cells in vitro, which was determined by the concentration of AGE-BSA and treatment time. A low concentration of AGE-BSA activated the Raf/MEK/ERK signal pathway through the interaction with RAGE, induced autophagy, and regulated the proliferation and function of hFOB1.19 cells.
Keywords: advanced glycation end products (AGEs); autophagy; cell proliferation; extracellular-signal-regulated kinase (ERK); osteoblast; receptor for advanced glycation end products (RAGE).
© 2015 by The American Society for Biochemistry and Molecular Biology, Inc.
Figures
Similar articles
-
Advanced glycation end-products (AGEs) induce concerted changes in the osteoblastic expression of their receptor RAGE and in the activation of extracellular signal-regulated kinases (ERK).Mol Cell Biochem. 2003 Aug;250(1-2):1-10. doi: 10.1023/a:1024934008982. Mol Cell Biochem. 2003. PMID: 12962137
-
Advanced glycation endproducts increase proliferation, migration and invasion of the breast cancer cell line MDA-MB-231.Biochim Biophys Acta. 2015 Mar;1852(3):429-41. doi: 10.1016/j.bbadis.2014.12.009. Epub 2014 Dec 13. Biochim Biophys Acta. 2015. PMID: 25514746
-
Advanced-glycation-end-product-cholesterol-aggregated-protein accelerates the proliferation of mesangial cells mediated by transforming-growth-factor-beta 1 receptors and the ERK-MAPK pathway.Eur J Pharmacol. 2011 Dec 15;672(1-3):159-68. doi: 10.1016/j.ejphar.2011.09.185. Epub 2011 Oct 2. Eur J Pharmacol. 2011. PMID: 21989075
-
Unraveling the interplay between RAS/RAF/MEK/ERK signaling pathway and autophagy in cancer: From molecular mechanisms to targeted therapy.Biochem Pharmacol. 2023 Nov;217:115842. doi: 10.1016/j.bcp.2023.115842. Epub 2023 Oct 5. Biochem Pharmacol. 2023. PMID: 37802240 Review.
-
Role of advanced glycation end products in cellular signaling.Redox Biol. 2014 Jan 9;2:411-29. doi: 10.1016/j.redox.2013.12.016. eCollection 2014. Redox Biol. 2014. PMID: 24624331 Free PMC article. Review.
Cited by
-
Effects of GLP-1 receptor analogue liraglutide and DPP-4 inhibitor vildagliptin on the bone metabolism in ApoE-/- mice.Ann Transl Med. 2019 Aug;7(16):369. doi: 10.21037/atm.2019.06.74. Ann Transl Med. 2019. PMID: 31555683 Free PMC article.
-
Impact of Type 2 Diabetes Mellitus and Antidiabetic Medications on Bone Metabolism.Curr Diab Rep. 2020 Nov 27;20(12):78. doi: 10.1007/s11892-020-01361-5. Curr Diab Rep. 2020. PMID: 33247351 Review.
-
A Novel Approach: Investigating the Intracellular Clearance Mechanism of Glyceraldehyde-Derived Advanced Glycation End-Products Using the Artificial Checkpoint Kinase 1 d270KD Mutant as a Substrate Model.Cells. 2023 Dec 14;12(24):2838. doi: 10.3390/cells12242838. Cells. 2023. PMID: 38132156 Free PMC article.
-
Insight into the roles of melatonin in bone tissue and bone‑related diseases (Review).Int J Mol Med. 2021 May;47(5):82. doi: 10.3892/ijmm.2021.4915. Epub 2021 Mar 24. Int J Mol Med. 2021. PMID: 33760138 Free PMC article. Review.
-
Cadmium affects autophagy in the human intestinal cells Caco-2 through ROS-mediated ERK activation.Cell Biol Toxicol. 2023 Jun;39(3):945-966. doi: 10.1007/s10565-021-09655-4. Epub 2021 Sep 28. Cell Biol Toxicol. 2023. PMID: 34580807 Free PMC article.
References
-
- Vestergaard P. (2007) Discrepancies in bone mineral density and fracture risk in patients with type 1 and type 2 diabetes–a meta-analysis. Osteoporos. Int. 18, 427–444 - PubMed
-
- Pietschmann P., Patsch J. M., and Schernthaner G. (2010) Diabetes and bone. Horm. Metab. Res. 42, 763–768 - PubMed
-
- de Liefde I. I., van der Klift M., de Laet C. E., van Daele P. L., Hofman A., and Pols H. A. (2005) Bone mineral density and fracture risk in type-2 diabetes mellitus: the Rotterdam Study. Osteoporos. Int. 16, 1713–1720 - PubMed
-
- Goh S. Y., and Cooper M. E. (2008) Clinical review: the role of advanced glycation end products in progression and complications of diabetes. J. Clin. Endocrinol. Metab. 93, 1143–1152 - PubMed
Publication types
MeSH terms
Substances
LinkOut - more resources
Full Text Sources
Research Materials
Miscellaneous
