. 2015 Dec 11;290(50):29717-31.
doi: 10.1074/jbc.M115.680934. Epub 2015 Oct 15.

Functional Dynamics Revealed by the Structure of the SufBCD Complex, a Novel ATP-binding Cassette (ABC) Protein That Serves as a Scaffold for Iron-Sulfur Cluster Biogenesis

Affiliations

Functional Dynamics Revealed by the Structure of the SufBCD Complex, a Novel ATP-binding Cassette (ABC) Protein That Serves as a Scaffold for Iron-Sulfur Cluster Biogenesis

Kei Hirabayashi et al. J Biol Chem. .

Abstract

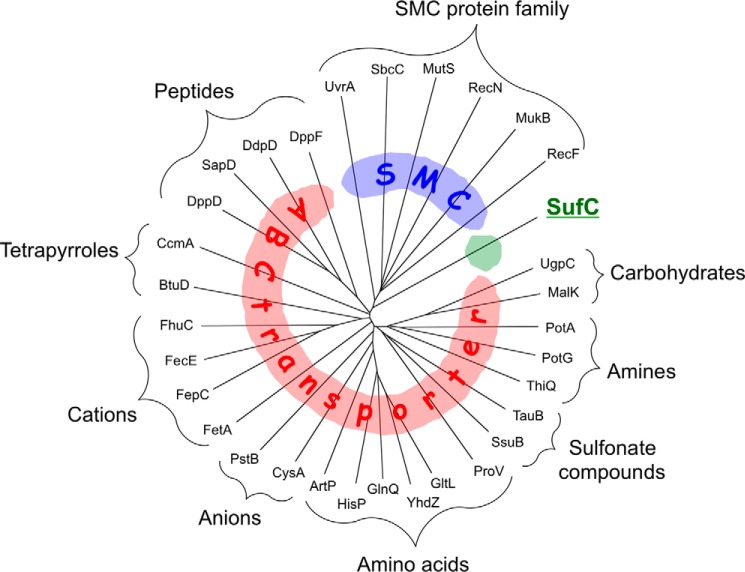
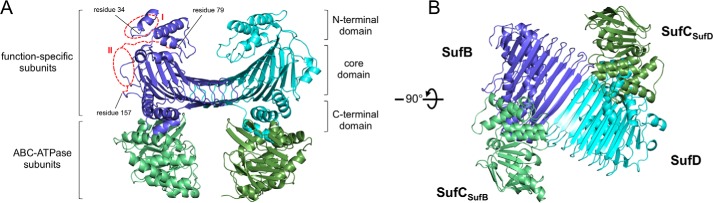
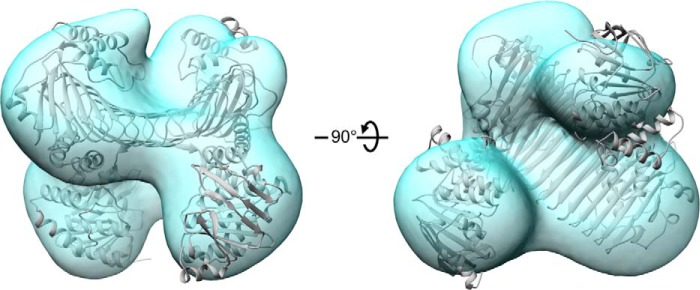
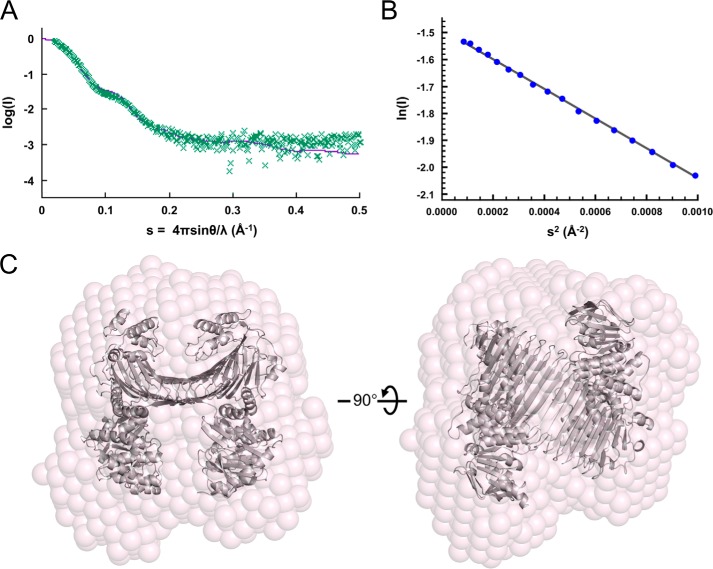
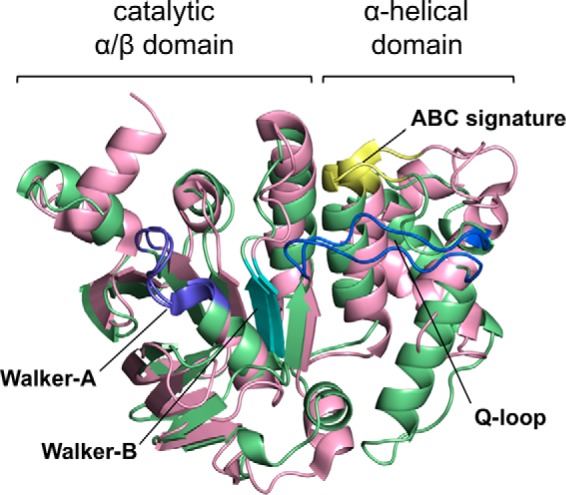
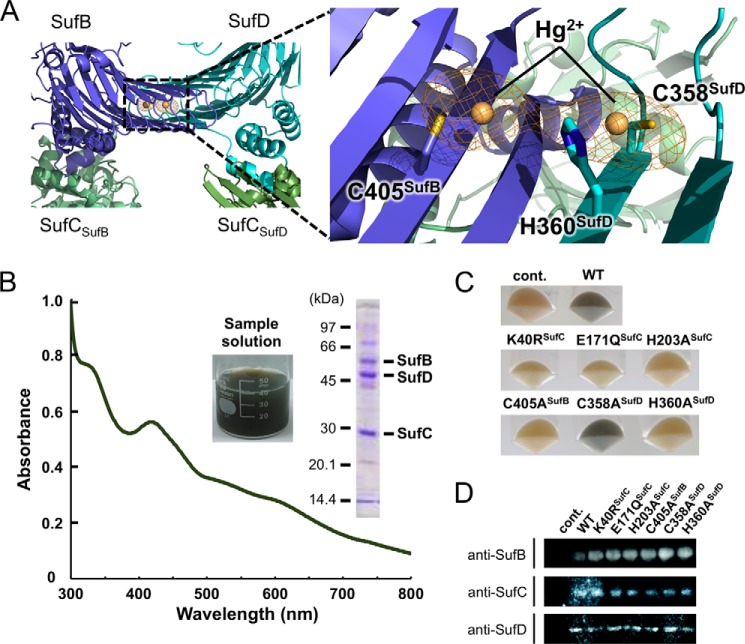
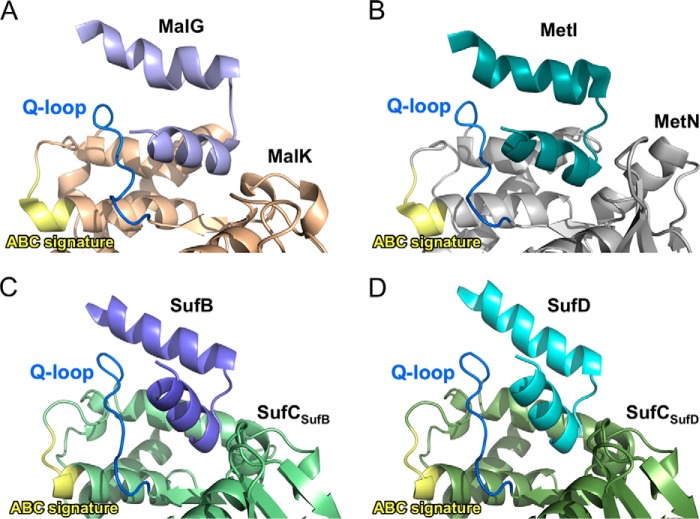
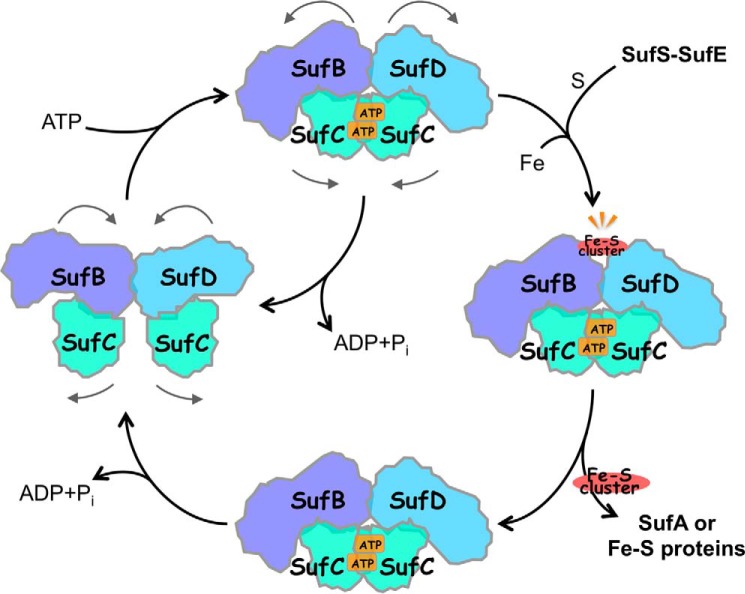
ATP-binding cassette (ABC)-type ATPases are chemomechanical engines involved in diverse biological pathways. Recent genomic information reveals that ABC ATPase domains/subunits act not only in ABC transporters and structural maintenance of chromosome proteins, but also in iron-sulfur (Fe-S) cluster biogenesis. A novel type of ABC protein, the SufBCD complex, functions in the biosynthesis of nascent Fe-S clusters in almost all Eubacteria and Archaea, as well as eukaryotic chloroplasts. In this study, we determined the first crystal structure of the Escherichia coli SufBCD complex, which exhibits the common architecture of ABC proteins: two ABC ATPase components (SufC) with function-specific components (SufB-SufD protomers). Biochemical and physiological analyses based on this structure provided critical insights into Fe-S cluster assembly and revealed a dynamic conformational change driven by ABC ATPase activity. We propose a molecular mechanism for the biogenesis of the Fe-S cluster in the SufBCD complex.

Keywords: ABC ATPase; ABC transporter; ATPase; Suf machinery; conformational change; iron-sulfur protein; x-ray crystallography.


Figures

FIGURE 1.
FIGURE 1.
Dendrogram of ABC ATPases from E. coli. Among the 32 proteins, SufC belongs to clades of neither the ABC transporter nor the SMC family.
FIGURE 2.
FIGURE 2.
Overall structure of the SufBCD complex from E. coli. A, ribbon representation of the crystal structure of the SufBCD complex. Individual subunits are shown in purple (SufB), cyan (SufD), and green (SufC). The two disordered regions of SufB: residues 1–33 (region I) and 80–156 (region II), are depicted by the red dotted lines and ovals. B, view rotated by 90° about the horizontal axis relative to A.
FIGURE 3.
FIGURE 3.
Three-dimensional reconstruction image of the SufBCD complex obtained by electron microscopy. Left panel, ribbon representation of the crystal structure of the SufBCD complex (gray) is superimposed on the transparent EM structure (light blue). Right panel, view rotated by 90° about the horizontal axis relative to the left panel.
FIGURE 4.
FIGURE 4.
SAXS analyses of the SufBCD complex. A, comparison of the crystal structure and SAXS result. Experimental x-ray scattering curve from the SufBCD complex (green dotted line) and the theoretical curve estimated from the crystal structure (purple solid line) are shown. B, the Guinier plots for the low angle region of the experimental scattering curve at (A). Its linearity indicates the absence of protein aggregation. C, molecular modeling of the SufBCD complex in solution. Left panel, ribbon representation of the crystal structure of the SufBCD complex (gray) is superimposed on the transparent ab initio dummy atom model (pink). Right panel, view rotated by 90° about the horizontal axis relative to the left panel.
FIGURE 5.
FIGURE 5.
Superposition of the overall structures of E. coli SufC and HlyB (Protein Data Bank code 1MT0). Green and light pink denote the SufC and HlyB structures, respectively. Motifs conserved in ABC ATPases are depicted by different colors: purple (Walker A motif), cyan (Walker B motif), yellow (ABC signature motif), and blue (Q-loop).
FIGURE 6.
FIGURE 6.
Sequence alignment of SufC with various ABC ATPases from E. coli: HisP, BtuD, and MalK as ABC transporters and UvrA as a SMC protein. Red and yellow indicate identical and similar residues, respectively. Secondary structures of SufC are shown above the alignment with spirals (α-helices) and arrows (β-strands). Motifs conserved in ABC ATPases are shown below the alignment. Residues 737–792 in UvrA, an unrelated region, are omitted from the sequence.
FIGURE 7.
FIGURE 7.
Structural changes and rearrangements of the ATP-binding pocket in SufC. Comparison of the active site structures of SufC among the SufC monomer (Protein Data Bank code 2D3W) (A), the SufCSufB subunit (B), and the SufCSufD subunit (C). The orientation and color coding for the conserved motifs in ABC ATPases are the same as in Fig. 5. Lys-152, Glu-171, and His-203 residues are shown in the stick models, and FoFc maps omitting the side chains of these residues, contoured at 2.0 σ (orange), are overlaid on the stick models. The red broken line in A indicates a salt bridge.
FIGURE 8.
FIGURE 8.
In vitro ATPase activity measurements of the SufBCD complex. Percentages indicate the ratios relative to wild-type complex (∼0.07 μmol of ATP hydrolyzed min−1 mg−1). Error bars, S.D. (n = 3).
FIGURE 9.
FIGURE 9.
Mutational analyses of the SufC protein. A, comparison of the expression in wild-type and mutant SufC proteins by immunoblot analysis using an antibody against SufC. In the cell, the wild-type and SufC variants are expressed equally. B–E, comparison of the size exclusion chromatograms of the native SufBCD complex (B) and the SufC mutant complex of K40R (C), E171Q (D), and H203A (E). These SufC mutants form a stable SufB1-SufC2-SufD1 complex similar to the wild-type complex. Elution curves from the gel filtration column (Sephacryl S-200) are monitored by the absorbance at 280 nm. The inset shows SDS-PAGE analysis of each peak fraction.
FIGURE 10.
FIGURE 10.
Phenotypic characterization of the SufC mutations. Growth of the mutant cells (Δisc Δsuf) indicates complementation for the loss of sufC. A, site-directed mutants K40R, E171Q, and H203A of SufC cannot complement the E. coli UT109 mutant strain, indicating these residues are indispensable for in vivo Fe-S cluster biosynthesis. B, Site-directed mutants Y86C, C167A, and Y86C/C167A of SufC can complement mutant cells, indicating that these mutations do not affect the in vivo Fe-S cluster biosynthesis.
FIGURE 11.
FIGURE 11.
Disulfide cross-linking analyses of the mutated SufBCD complex. A, dimeric structure of ABC ATPase HlyB (H662A) (Protein Data Bank code 1XEF). Light pink and orange indicate individual subunits. Pink and red denote bound ATPs with van der Waals surfaces and Mg2+ ions, respectively. B, putative dimer model of SufC. Tyr-86 residues are depicted with their van der Waals surfaces. C, disulfide bond formation between two mutated SufC subunits in the SufBCD complex detected by native PAGE/Western blot analyses using antibodies against SufB, SufC, and SufD. D, nonreducing SDS-PAGE/Western blot analyses using an antibody against SufC.
FIGURE 12.
FIGURE 12.
Fluorescent labeling analyses of the mutated SufBCD complex. A, ANS detects exposure of hydrophobic regions in SufB-SufD protomers. B, exposure of Cys-405 of SufB located inside the heterodimer interface between the SufB and SufD protomers under the cross-linked conditions detected by the DACM assays.
FIGURE 13.
FIGURE 13.
In vivo Fe-S cluster formation on the SufBCD complex. A, anomalous difference map for Hg2+ ion (contoured at 6.0 σ) in the Hg derivative of the SufBCD complex. A square highlights the binding site of Hg2+, of which the right panel shows a close-up view. Two Hg2+ ions bound to Cys-405 in SufB and Cys-358 in SufD are adjacent to His-360. These residues are depicted with a stick model, and Hg2+ ions are shown as orange balls. B, UV-visible absorption spectrum of the SufBCD complex at an early purification stage. The inset shows the sample solution and SDS-PAGE analysis of the partially purified SufBCD complex used in this measurement. C, colors of the harvested host cells overproducing the SufBCD complex and its variants. The blackish-green color represents the in vivo Fe-S cluster formation on the SufBCD complex. D, comparison of the expression level of SuB/SufC/SufD among the cells harboring the wild-type plasmid or the various mutant plasmids by immunoblot analyses using antibodies against SufB, SufC, and SufD. cont., control.
FIGURE 14.
FIGURE 14.
Comparison of the transmission interface in the SufBCD complex and ABC proteins from E. coli. A–D, close-up views of the interface between the substrate/function-specific subunit and the ABC ATPase subunit in the resting (inward-facing) state of MalFGK maltose transporter (Protein Data Bank code 3FH6) (A), the inward-facing state of the MetNI methionine transporter (Protein Data Bank code 3DHW) (B), and the resting state of the SufBCD complex at the SufB-SufC interface (C) and the SufD-SufC interface (D). Each subunit in the complex is depicted in a different color. Substrate/function-specific subunit is displayed only for the two short helix-turn-helix involved in the interaction. Color coding for the conserved motifs in ABC ATPases is the same as in Fig. 5.
FIGURE 15.
FIGURE 15.
Proposed mechanism of Fe-S cluster biogenesis for the SufBCD complex. Biogenesis cycle starts (at left) in the resting state in which SufC is ready for ATP binding. Upon binding of ATP, SufC forms a head to tail dimer. Consequently, the Fe-S cluster binding site between the SufB and SufD interface is exposed to the surface. Nascent Fe-S cluster is built/transferred and ATP is hydrolyzed, restoring the SufBCD complex to its resting state.

References

    1. Higgins C. F. (1992) ABC transporters: from microorganisms to man. Annu. Rev. Cell Biol. 8, 67–113 - PubMed
    1. Schmitt L., and Tampé R. (2002) Structure and mechanism of ABC transporters. Curr. Opin. Struct. Biol. 12, 754–760 - PubMed
    1. Locher K. P., Lee A. T., and Rees D. C. (2002) The E. coli BtuCD structure: a framework for ABC transporter architecture and mechanism. Science 296, 1091–1098 - PubMed
    1. Hopfner K. P., and Tainer J. A. (2003) Rad50/SMC proteins and ABC transporters: unifying concepts from high-resolution structures. Curr. Opin. Struct. Biol. 13, 249–255 - PubMed
    1. Holland I. B., and Blight M. A. (1999) ABC-ATPases, adaptable energy generators fuelling transmembrane movement of a variety of molecules in organisms from bacteria to humans. J. Mol. Biol. 293, 381–399 - PubMed

Publication types

MeSH terms

Substances

LinkOut - more resources