. 2015 Oct 15;2(5):ENEURO.0076-15.2015.
doi: 10.1523/ENEURO.0076-15.2015. eCollection 2015 Sep.

Single-Trial Event-Related Potential Correlates of Belief Updating(1,2,3)

Affiliations

Single-Trial Event-Related Potential Correlates of Belief Updating(1,2,3)

Daniel Bennett et al. eNeuro. .

Abstract

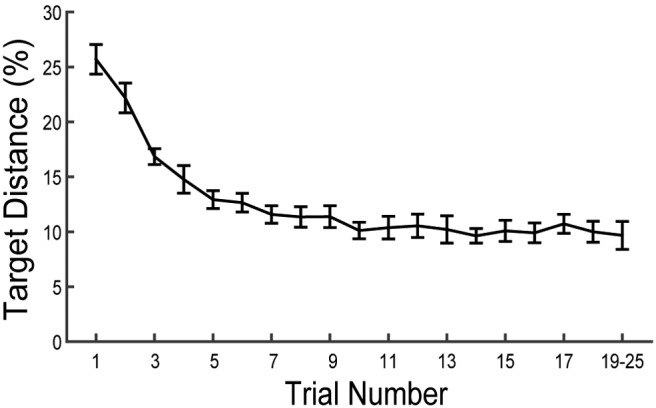
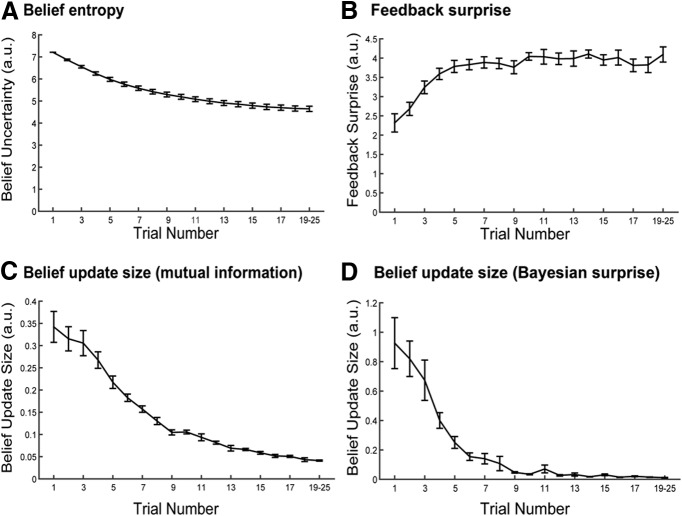
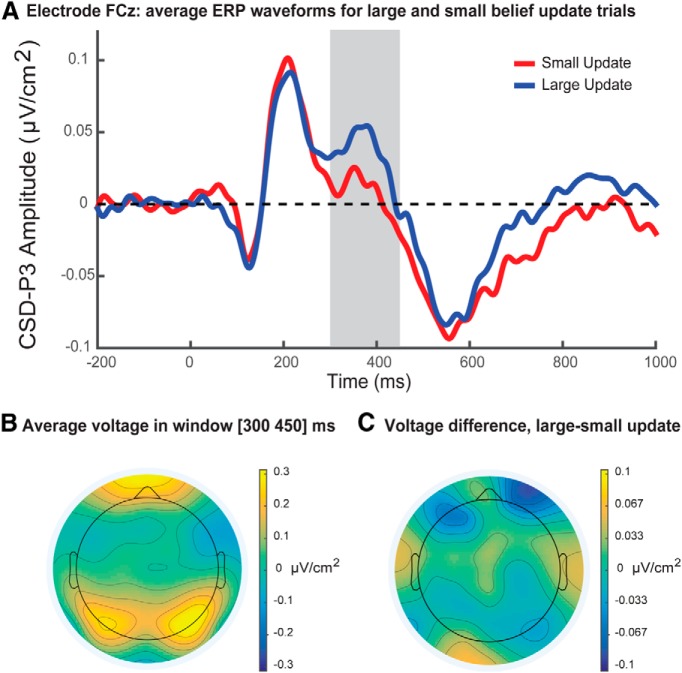
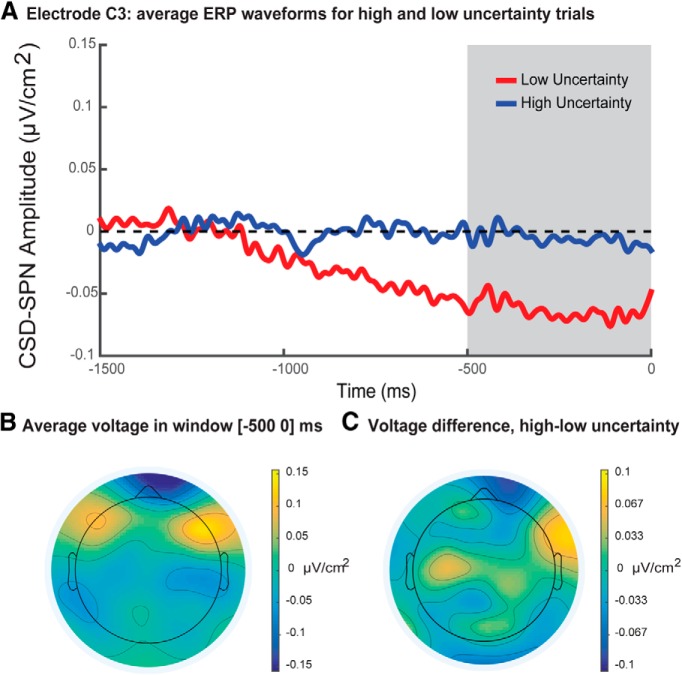
Belief updating-the process by which an agent alters an internal model of its environment-is a core function of the CNS. Recent theory has proposed broad principles by which belief updating might operate, but more precise details of its implementation in the human brain remain unclear. In order to address this question, we studied how two components of the human event-related potential encoded different aspects of belief updating. Participants completed a novel perceptual learning task while electroencephalography was recorded. Participants learned the mapping between the contrast of a dynamic visual stimulus and a monetary reward and updated their beliefs about a target contrast on each trial. A Bayesian computational model was formulated to estimate belief states at each trial and was used to quantify the following two variables: belief update size and belief uncertainty. Robust single-trial regression was used to assess how these model-derived variables were related to the amplitudes of the P3 and the stimulus-preceding negativity (SPN), respectively. Results showed a positive relationship between belief update size and P3 amplitude at one fronto-central electrode, and a negative relationship between SPN amplitude and belief uncertainty at a left central and a right parietal electrode. These results provide evidence that belief update size and belief uncertainty have distinct neural signatures that can be tracked in single trials in specific ERP components. This, in turn, provides evidence that the cognitive mechanisms underlying belief updating in humans can be described well within a Bayesian framework.

Keywords: P3; SPN; belief updating; computational modeling; learning; single-trial.


Figures

Figure 1.
Figure 1.
A, Following a self-paced button press, a checkerboard stimulus was presented whose contrast changed linearly. The participant could at any time select the contrast displayed on screen by pressing a button with the right index finger. The trial continued until a button was pressed or until stimulus duration exceeded 30 s. Following the participant’s choice, the selected contrast remained on screen for 2 s, after which time the monetary reward associated with the chosen contrast was displayed for 2.5 s. In the event that no button was pressed within 30 s, feedback was a message reminding the participant of the task instructions. B, Two demonstrative examples of stimulus contrast as a function of elapsed time. Example trial 1 (blue) has an initial contrast of 63%, is initially increasing, and has a half-cycle period of 9 s. Example trial 2 (red) has an initial contrast of 39%, is initially decreasing, and has a half-cycle period of 6 s. The checkerboard stimulus phase reversed at a rate of 12 Hz. C, Functional mapping between the contrast difference from target and monetary reward. The mapping was a symmetrical triangular function with a center of 0% contrast difference, a half-width of 15% contrast difference, and a height of 25 cents. As such, the received reward was maximal when the participant responded at the target contrast and decreased linearly with increasing difference of chosen contrast from the target. The reward was 0 for responses at >15% distance. Feedback received was rounded to the nearest whole-cent value.
Figure 2.
Figure 2.
Mean accuracy as a function of within-block trial number across participants. Accuracy is presented as the absolute difference of chosen and target contrasts, where lower differences indicate better task performance. Error bars represent the SEM. Note that the number of trials per block varied across blocks and participants, and as a result some participants did not complete >19 trials in any block. This confound limited the interpretability of accuracy data for trial numbers >20, and the final data point of the series therefore represents mean accuracy across trials 19–25 for each participant.
Figure 3.
Figure 3.
Computational belief variables as a function of trial number. A, Belief entropy. B, Feedback surprise. C, Belief update size measured as mutual information (see Eq. 14). D, Belief update size measured as Bayesian surprise (see Eq. 15). Note that the number of trials per block varied across blocks and participants, and, as a result, some participants did not complete >19 trials in any block. This confound limited the interpretability of computational belief variables for trial numbers >20, and the final data point of the each series therefore represents a mean across trials 19–25 for each participant. Error bars represent the SEM.
Figure 4.
Figure 4.
P3 analysis. A, Median split waveforms for 200–1000 ms following visual presentation of feedback. The P3 regression analysis window is indicated by the gray bar. ERP waveforms were low-pass filtered at 30 Hz for display purposes only. B, Mean voltage topography during the P3 analysis window from 300 to 450 ms following visual presentation of feedback (time = 0). C, Topography of the mean voltage difference between large and small belief update trials across participants during P3 analysis window. A median split was used to divide trials into two bins for each participant, corresponding to large and small belief updates according to model-derived estimates. This median split was for display purposes only and was not used in the main regression analysis, which was based on single-trial amplitudes.
Figure 5.
Figure 5.
Stimulus-preceding negativity analysis. A, Median split waveforms for 0–1500 ms prior to the visual presentation of feedback. The SPN regression analysis window from 0 to 500 ms preceding feedback is indicated by the gray bar. ERP waveforms were low-pass filtered at 30 Hz for display purposes only. B, Mean voltage topography during SPN analysis window from 0 to 500 ms prior to visual presentation of feedback (time = 0). C, Topography of the mean voltage difference between high and low uncertainty trials across participants during the SPN analysis window. A median split was used to divide trials into two bins for each participant, corresponding to high and low belief uncertainty according to model-derived estimates. This median split was for display purposes only and was not used in the main regression analysis, which was based on single-trial amplitudes.

References

    1. Achtziger A, Alós-Ferrer C, Hügelschäfer S, Steinhauser M (2014) The neural basis of belief updating and rational decision making. Soc Cogn Affect Neurosci 9:55-62. 10.1093/scan/nss099 - DOI - PMC - PubMed
    1. Achtziger A, Alós-Ferrer C, Hügelschäfer S, Steinhauser M (2015) Higher incentives can impair performance: neural evidence on reinforcement and rationality. Soc Cogn Affect Neurosci. Advance online publication. Retrieved 4 October 2015. doi:10.1093/scan/nsv036. - DOI - PMC - PubMed
    1. Baldi P, Itti L (2010) Of bits and wows: a Bayesian theory of surprise with applications to attention. Neural Netw 23:649-666. 10.1016/j.neunet.2009.12.007 - DOI - PMC - PubMed
    1. Begleiter H, Porjesz B, Chou C, Aunon J (1983) P3 and stimulus incentive value. Psychophysiology 20:95-101. - PubMed
    1. Behrens TE, Woolrich MW, Walton ME, Rushworth MF (2007) Learning the value of information in an uncertain world. Nat Neurosci 10:1214-1221. 10.1038/nn1954 - DOI - PubMed

LinkOut - more resources