

Stimulus competition mediates the joint effects of spatial and feature-based attention
- PMID: 26473316
- PMCID: PMC5077277
- DOI: 10.1167/15.14.7
Stimulus competition mediates the joint effects of spatial and feature-based attention
Abstract
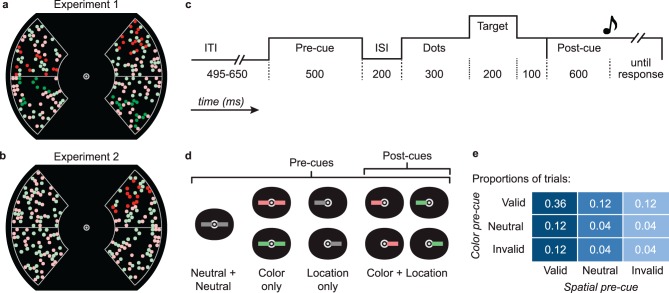
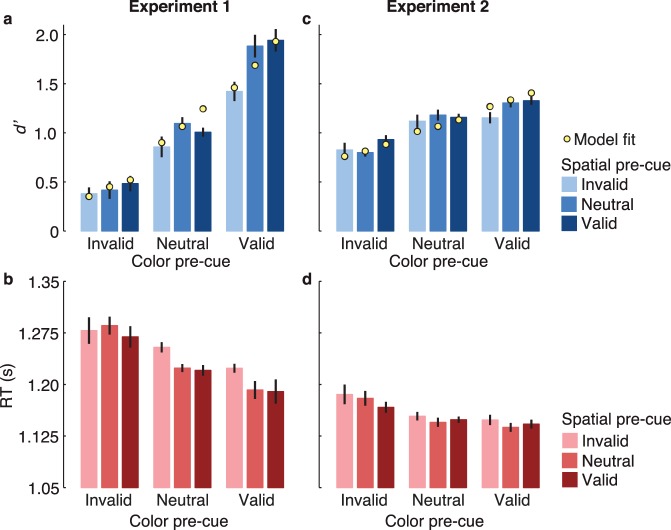
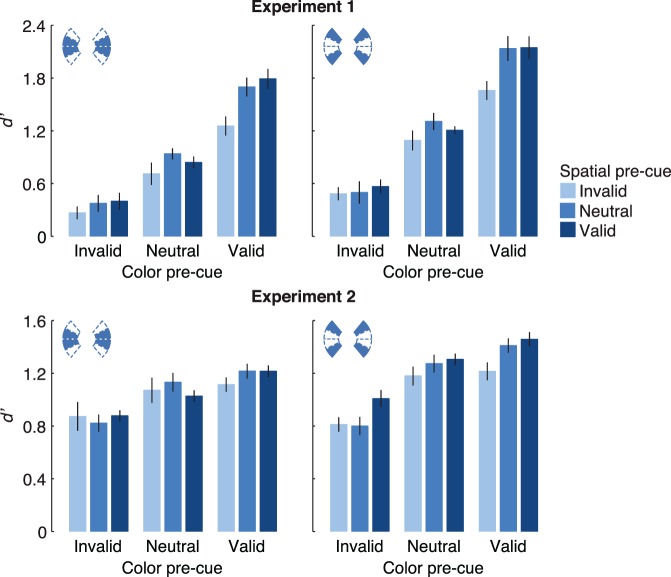
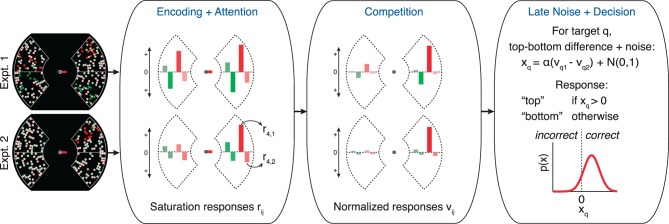
Distinct attentional mechanisms enhance the sensory processing of visual stimuli that appear at task-relevant locations and have task-relevant features. We used a combination of psychophysics and computational modeling to investigate how these two types of attention--spatial and feature based--interact to modulate sensitivity when combined in one task. Observers monitored overlapping groups of dots for a target change in color saturation, which they had to localize as being in the upper or lower visual hemifield. Pre-cues indicated the target's most likely location (left/right), color (red/green), or both location and color. We measured sensitivity (d') for every combination of the location cue and the color cue, each of which could be valid, neutral, or invalid. When three competing saturation changes occurred simultaneously with the target change, there was a clear interaction: The spatial cueing effect was strongest for the cued color, and the color cueing effect was strongest at the cued location. In a second experiment, only the target dot group changed saturation, such that stimulus competition was low. The resulting cueing effects were statistically independent and additive: The color cueing effect was equally strong at attended and unattended locations. We account for these data with a computational model in which spatial and feature-based attention independently modulate the gain of sensory responses, consistent with measurements of cortical activity. Multiple responses then compete via divisive normalization. Sufficient competition creates interactions between the two cueing effects, although the attentional systems are themselves independent. This model helps reconcile seemingly disparate behavioral and physiological findings.
Figures
Similar articles
-
The impact of probabilistic feature cueing depends on the level of cue abstraction.Exp Brain Res. 2016 Mar;234(3):685-94. doi: 10.1007/s00221-015-4487-2. Epub 2015 Nov 19. Exp Brain Res. 2016. PMID: 26586268
-
Top-down matching singleton cues have no edge over top-down matching nonsingletons in spatial cueing.Psychon Bull Rev. 2019 Feb;26(1):241-249. doi: 10.3758/s13423-018-1499-5. Psychon Bull Rev. 2019. PMID: 29959614 Free PMC article.
-
Graded Neuronal Modulations Related to Visual Spatial Attention.J Neurosci. 2016 May 11;36(19):5353-61. doi: 10.1523/JNEUROSCI.0192-16.2016. J Neurosci. 2016. PMID: 27170131 Free PMC article.
-
The attentional effects of single cues and color singletons on visual sensitivity.J Exp Psychol Hum Percept Perform. 2014 Apr;40(2):639-52. doi: 10.1037/a0033775. Epub 2013 Jul 22. J Exp Psychol Hum Percept Perform. 2014. PMID: 23875570 Free PMC article.
-
The role of top-down spatial attention in contingent attentional capture.Psychophysiology. 2016 May;53(5):650-62. doi: 10.1111/psyp.12615. Epub 2016 Feb 16. Psychophysiology. 2016. PMID: 26879628
Cited by
-
Foveal vision anticipates defining features of eye movement targets.Elife. 2022 Sep 9;11:e78106. doi: 10.7554/eLife.78106. Elife. 2022. PMID: 36082940 Free PMC article.
-
Space- and feature-based attention operate both independently and interactively within latent components of perceptual decision making.J Vis. 2023 Jan 3;23(1):12. doi: 10.1167/jov.23.1.12. J Vis. 2023. PMID: 36656593 Free PMC article.
-
Spatial and Feature-selective Attention Have Distinct, Interacting Effects on Population-level Tuning.J Cogn Neurosci. 2022 Jan 5;34(2):290-312. doi: 10.1162/jocn_a_01796. J Cogn Neurosci. 2022. PMID: 34813647 Free PMC article.
-
Differential impact of exogenous and endogenous attention on the contrast sensitivity function across eccentricity.J Vis. 2020 Jun 3;20(6):11. doi: 10.1167/jov.20.6.11. J Vis. 2020. PMID: 32543651 Free PMC article.
-
The time course of feature-selective attention inside and outside the focus of spatial attention.Proc Natl Acad Sci U S A. 2024 Apr 16;121(16):e2309975121. doi: 10.1073/pnas.2309975121. Epub 2024 Apr 8. Proc Natl Acad Sci U S A. 2024. PMID: 38588433 Free PMC article.
References
-
- Alais, D.,, Blake R. (1999). Neural strength of visual attention gauged by motion adaptation. Nature Neuroscience, 2, 1015–1018. - PubMed
-
- Andersen S. K.,, Fuchs S.,, Müller M. M. (2011). Effects of feature-selective and spatial attention at different stages of visual processing. Journal of Cognitive Neuroscience, 23, 238–246. - PubMed
-
- Bakeman R. (2005). Recommended effect size statistics for repeated measures designs. Behavior Research Methods, 37, 379–384. - PubMed
Publication types
MeSH terms
Grants and funding
LinkOut - more resources
Full Text Sources
Other Literature Sources
