. 2015 Oct 16;10(10):e0140740.
doi: 10.1371/journal.pone.0140740. eCollection 2015.

Factor VIII Is Synthesized in Human Endothelial Cells, Packaged in Weibel-Palade Bodies and Secreted Bound to ULVWF Strings

Affiliations

Factor VIII Is Synthesized in Human Endothelial Cells, Packaged in Weibel-Palade Bodies and Secreted Bound to ULVWF Strings

Nancy A Turner et al. PLoS One. .

Abstract

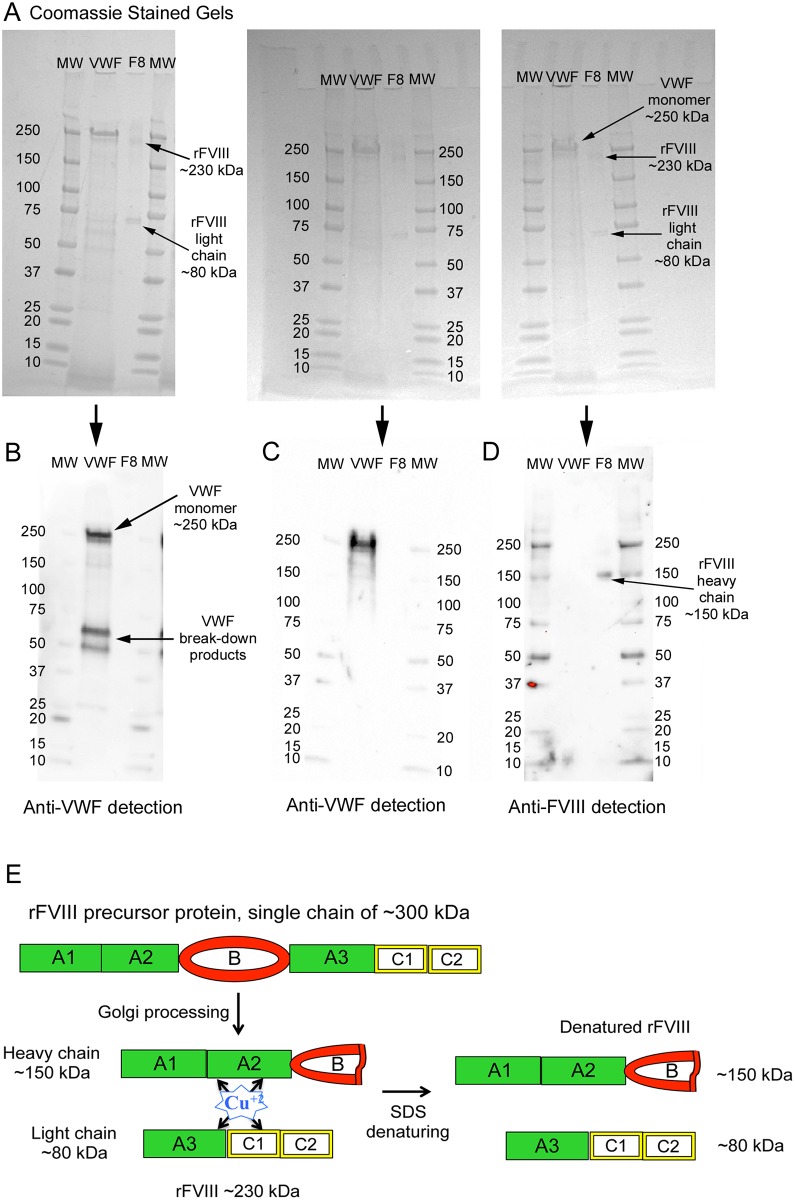
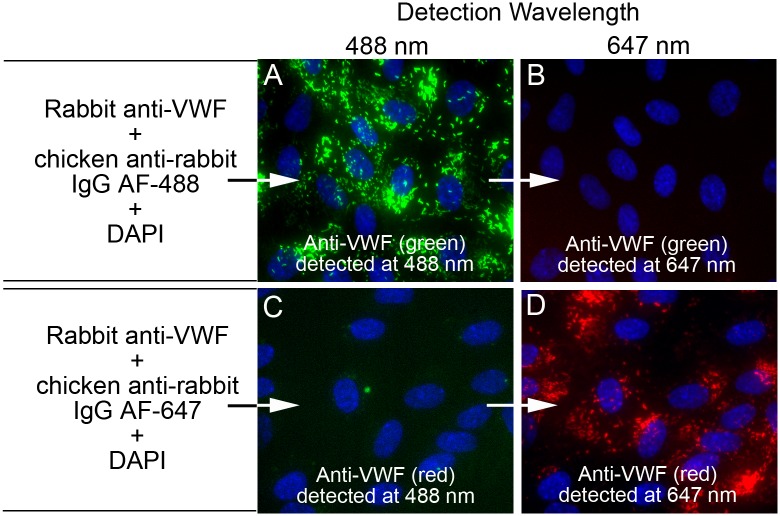
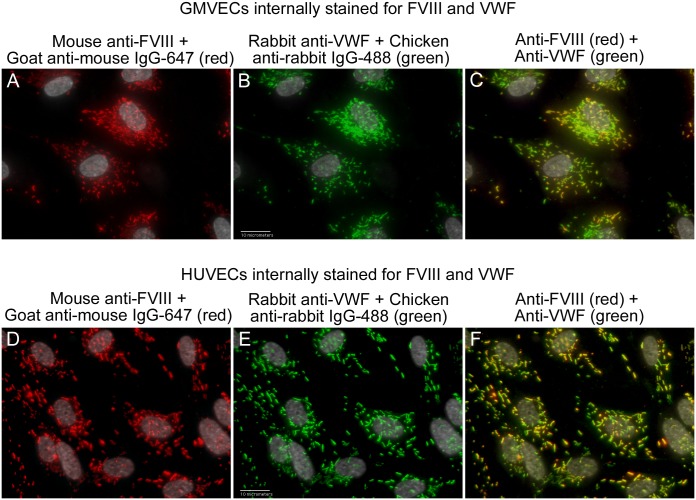
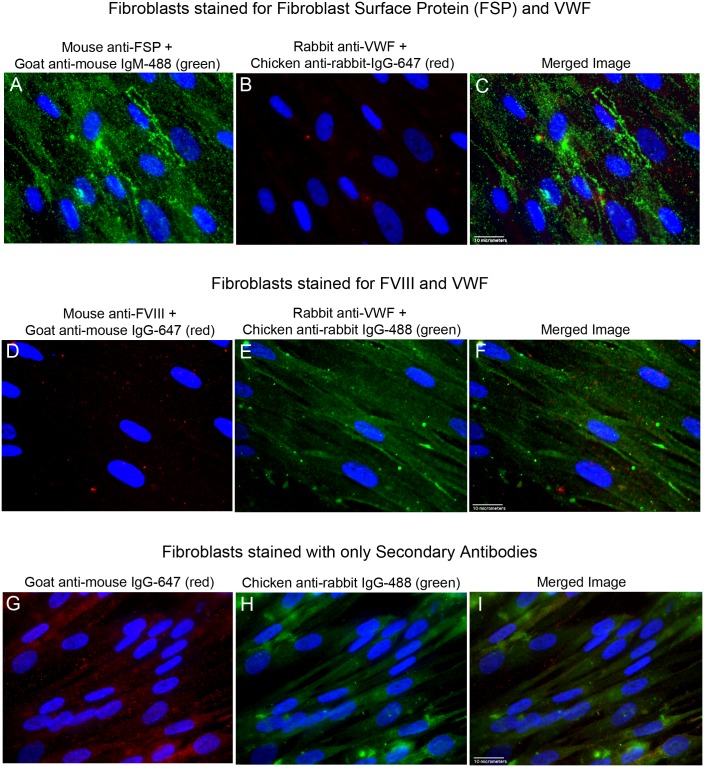
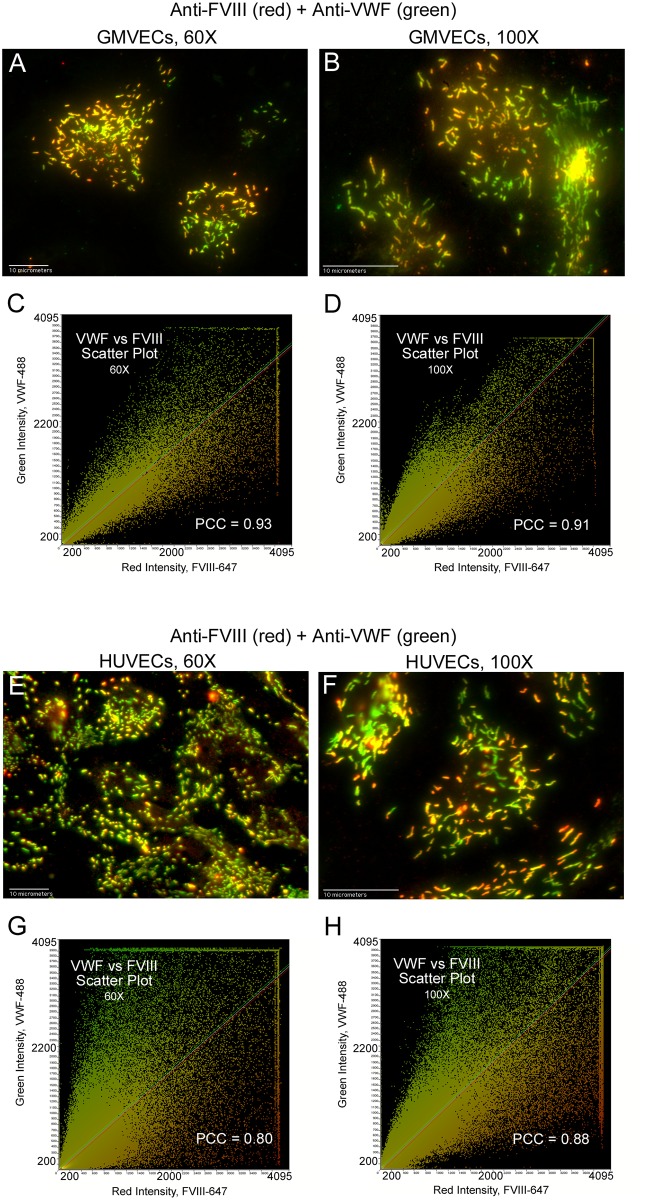
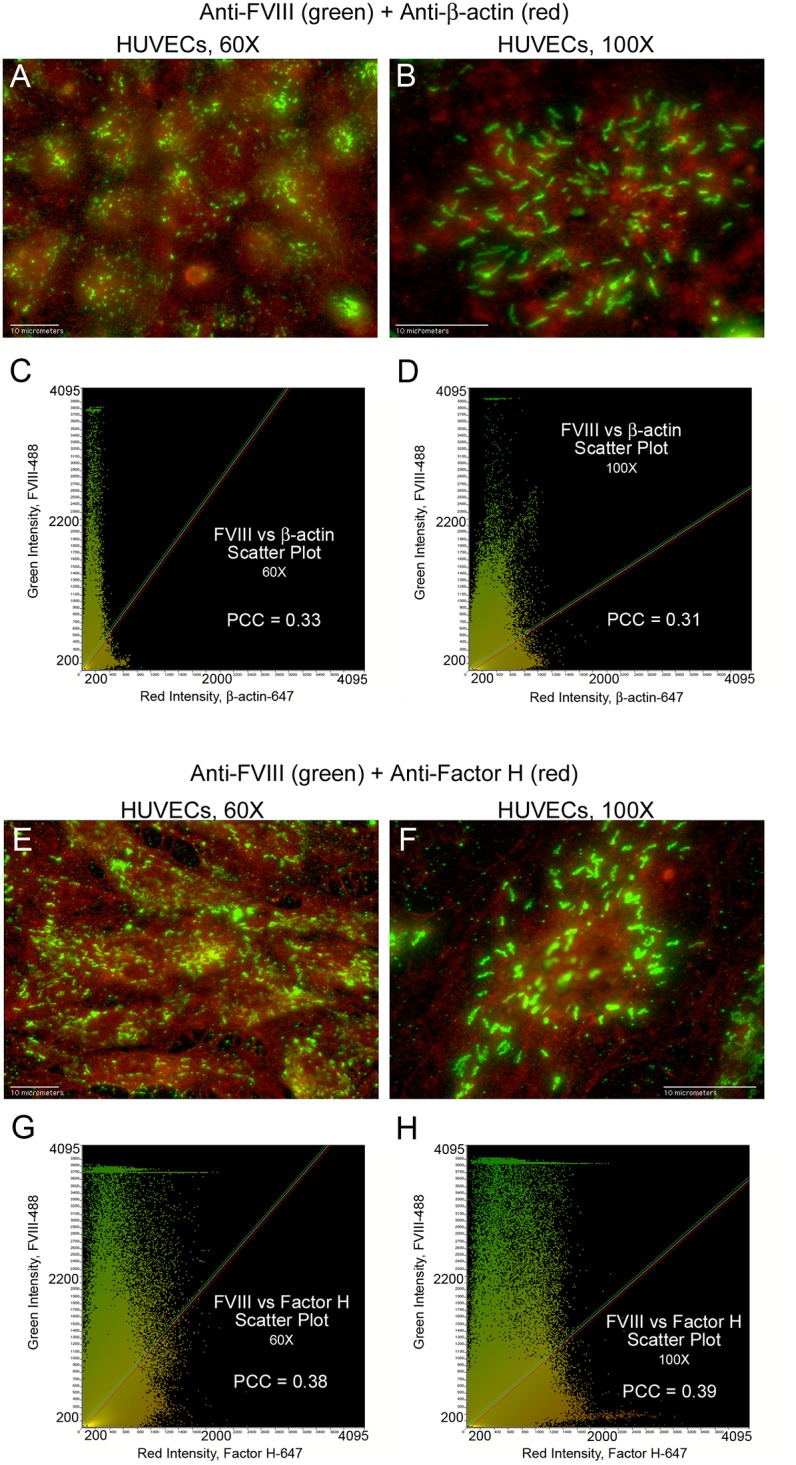
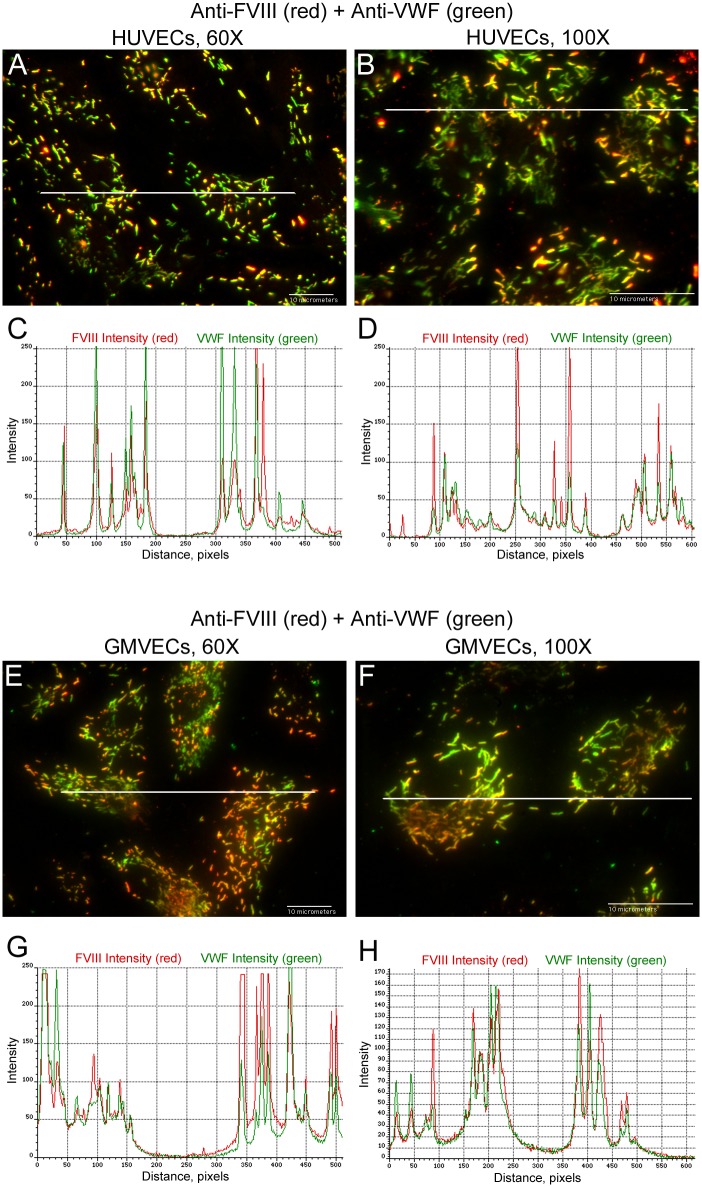
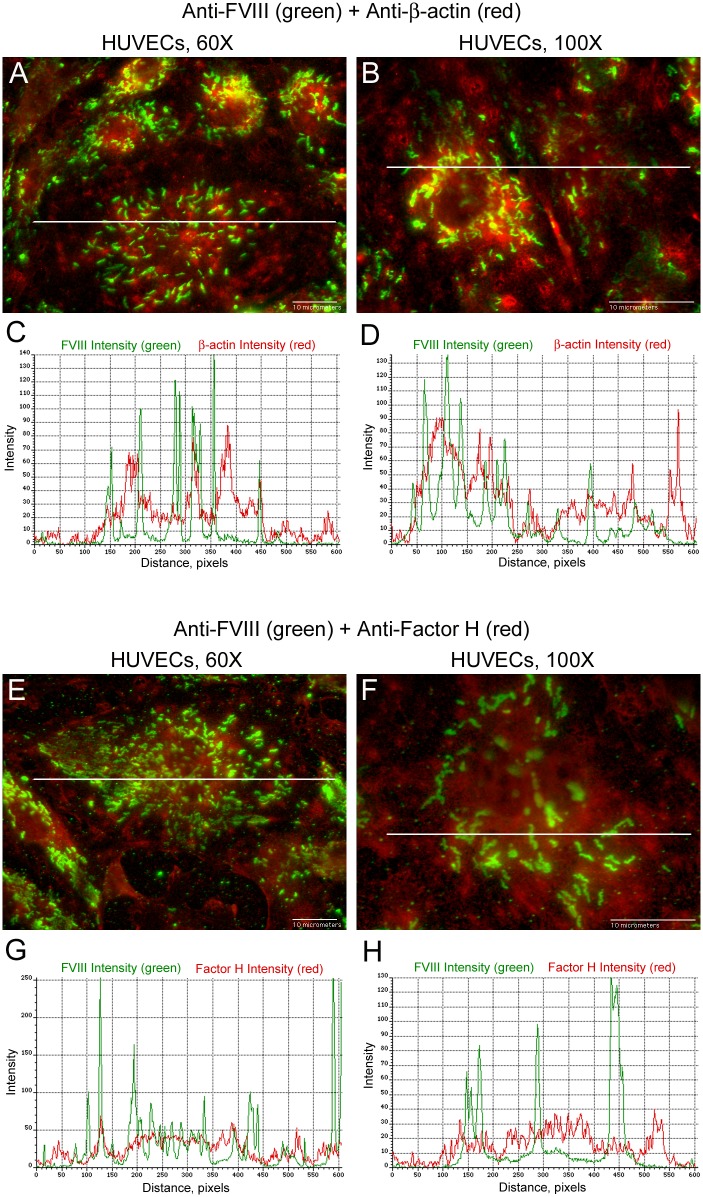
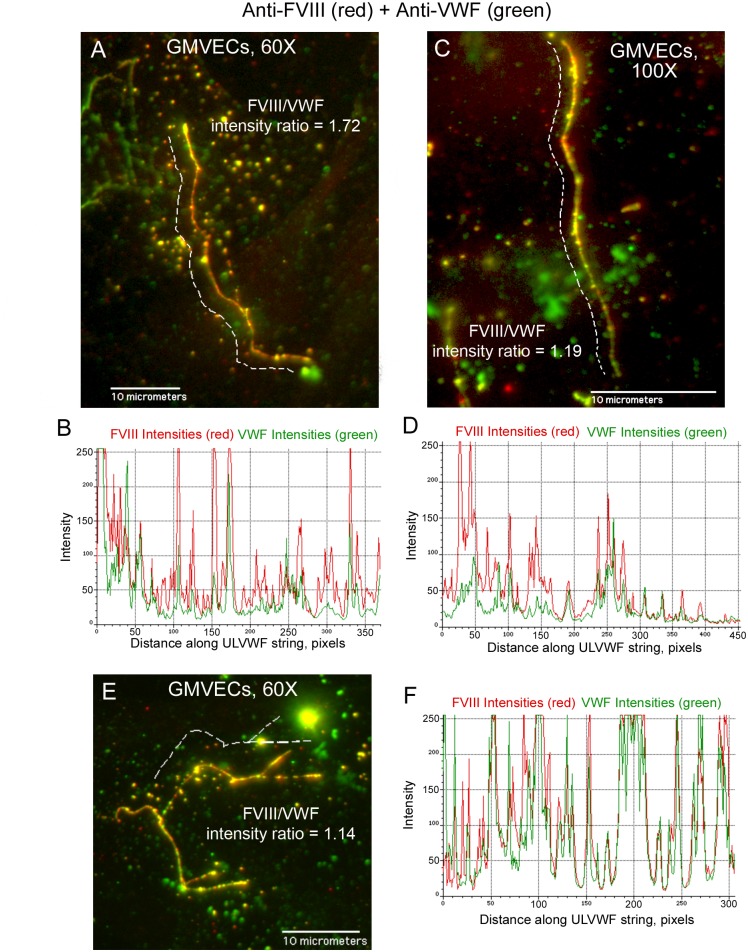
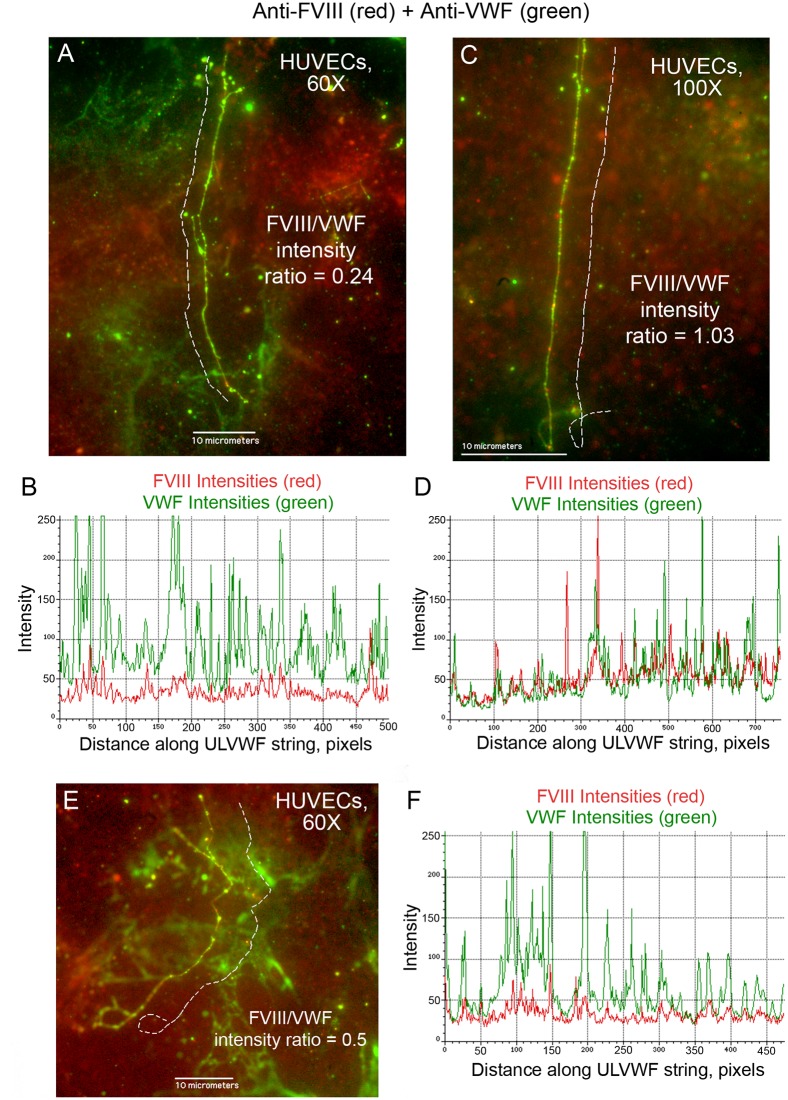
The cellular synthesis site and ensuing storage location for human factor VIII (FVIII), the coagulation protein deficient in hemophilia A, has been elusive. FVIII stability and half-life is dependent on non-covalent complex formation with von Willebrand factor (VWF) to avoid proteolysis and clearance. VWF is synthesized in megakaryocytes and endothelial cells, and is stored and secreted from platelet alpha granules and Weibel-Palade bodies of endothelial cells. In this paper we provide direct evidence for FVIII synthesis in 2 types of primary human endothelial cells: glomerular microvascular endothelial cells (GMVECs) and umbilical vein endothelial cells (HUVECs). Gene expression quantified by real time PCR revealed that levels of F8 and VWF are similar in GMVECs and HUVECs. Previous clinical studies have shown that stimulation of vasopressin V2 receptors causes parallel secretion of both proteins. In this study, we found that both endothelial cell types express AVPR2 (vasopressin V2 receptor gene) and that AVPR2 mRNA levels are 5-fold higher in GMVECs than HUVECs. FVIII and VWF proteins were detected by fluorescent microscopy in Weibel-Palade bodies within GMVECs and HUVECs using antibodies proven to be target specific. Visual presence of FVIII and VWF in Weibel-Palade bodies was confirmed by correlation measurements. The high extent of correlation was compared with negative correlation values obtained from FVIII detection with cytoplasmic proteins, β-actin and Factor H. FVIII activity was positive in GMVEC and HUVEC cell lysates. Stimulated GMVECs and HUVECs were found to secrete cell-anchored ultra-large VWF strings covered with bound FVIII.


Conflict of interest statement

Competing Interests: The authors have declared that no competing interests exist.

Figures

Fig 1
Fig 1. Specificity of antibodies to human FVIII and VWF.
Denatured, non-reduced samples of recombinant (r) FVIII [Helixate FS, 130 ng per lane (1.30 IU)] and denatured, reduced samples of plasma purified VWF (90–130 ng per lane) were separated by 4–15% sodium dodecyl sulfate (SDS)-PAGE. Lanes containing rFVIII are marked as F8 and MW indicates molecular weight markers in kDa. (A) Arrows on the Coomassie stained gels show the ~230 and ~80 kDa bands for rFVIII and the monomer subunit of reduced VWF at ~250 kDa. (B, C and D) Western blots of gels shown in (A) were detected in (B) with goat anti-human VWF plus donkey anti-goat-HRP, in (C) with rabbit anti-human VWF plus donkey anti-rabbit-HRP, and in (D) with mouse monoclonal anti-human FVIII plus goat anti-mouse-HRP. Panel (E) is a schematic drawing illustrating the interpretation of the Coomassie stained bands and anti-FVIII detected bands generated from denatured rFVIII. The addition of SDS to rFVIII results in the dissociation of copper (Cu) ions [30,31] (or other ions that may be involved, such as the calcium and manganese ions required for FVIII activation) that bridge the heavy chain (~150 kDa) and light chain (~80 kDa) of the rFVIII protein (~230 kDa). [1] The rFVIII was produced using a ~90 kDa B domain. (The B domain was cleaved within the Golgi of the producing BHK cells prior to processing and metal coordination, resulting in a heavy chain of ~150 kDa.) [29].
Fig 2
Fig 2. Fluorescent emission “cross-talk” controls.
The high concentration of VWF present in Weibel-Palade bodies (WPBs) was used to demonstrate that images detected at the first wavelength channel (488 nm) were not cross contaminated by fluorescence generated from the second wavelength channel (647 nm), and reciprocally, the 647 nm channel was not affected by fluorescence from the 488 nm channel. Un-stimulated HUVECs were fixed with p-formaldehyde and treated with Triton-X to allow intracellular fluorescent staining. Cell nuclei were stained with DAPI (blue) and cells were imaged with a 60× objective. In (A and B) HUVECs on coverslip 1 were stained with rabbit anti-VWF plus chicken anti-rabbit IgG Alexa Fluor (AF)-488 (green) and in (C and D) HUVECs on coverslip 2 were stained with rabbit anti-VWF plus chicken anti-rabbit IgG AF-647 (red). Both coverslips were imaged at 488 nm and at 647 nm and merged with DAPI images. The images in (A) and (C) were detected at 488 nm and the images in (B) and (D) were detected at 647 nm.
Fig 3
Fig 3. FVIII and VWF are present in the WPBs of GMVECs and HUVECs.
Unstimulated GMVECs and HUVECs were fixed and treated with Triton-X to allow intracellular staining. Cells were then stained with mouse monoclonal anti-human FVIII plus goat anti-mouse AF IgG-647 (red), followed by staining with rabbit anti-human VWF plus chicken anti-rabbit AF IgG-488 (green). GMVEC images: (A) anti-FVIII detection (red); (B) anti-VWF detection (green); and (C) merged image of anti-FVIII plus anti-VWF. HUVEC images: (D) anti-FVIII detection (red); (E) anti-VWF detection (green); and (F) anti-FVIII plus anti-VWF. Images at 60× are shown merged with DAPI-detected nuclei (gray) and are representative of 5–7 experiments.
Fig 4
Fig 4. Fluorescent images of stained fibroblasts.
Fibroblasts were stained with antibodies to Fibroblast Surface Protein (FSP), FVIII, and VWF plus relevant secondary antibodies, or with secondary detection antibodies alone. Images at 60× from each channel plus the merged image are shown. Cell nuclei were detected with DAPI (blue). (A-C) Fibroblasts were fixed and cell surfaces were stained with mouse anti-FSP plus goat anti-mouse IgM AF-488 (green). Cells were fixed again (to retain surface antibodies), and then treated with Triton-X for internal staining with rabbit anti-VWF plus chicken anti-rabbit IgG AF-647 (red). (D-F) Fibroblasts were fixed and treated with Triton-X for internal staining. Cells were stained with mouse anti-FVIII plus goat anti-mouse IgG AF-647 (red), followed by staining with rabbit anti-VWF plus chicken anti-rabbit IgG AF-488 (green). (G-I) Fixed and Triton-X-treated Fibroblasts were stained with only the secondary fluorescently labeled antibodies used in panels D-F for FVIII and VWF detection. Cells were stained with goat anti-mouse IgG AF-647 (red), and then with chicken anti-rabbit IgG AF-488 (green). Images are representative of 3 experiments.
Fig 5
Fig 5. Statistical confirmation of the presence of FVIII and VWF in WPBs.
GMVECs and HUVECs were treated with Triton-X to allow internal staining. Cells were then stained with mouse monoclonal anti-human FVIII plus goat anti-mouse IgG AF-647 (red) followed by staining with rabbit anti-human VWF plus chicken anti-rabbit IgG AF-488 (green). Merged images of FVIII and VWF detection, along with the corresponding intensity scatter plot, are shown in: (A and C) GMVECs at 60×, N = 4; (B and D) GMVECs at 100×, N = 5; (E and G) HUVECs at 60×, N = 7; and (F and H) HUVECs at 100×, N = 7. Values for Pearson’s correlation coefficient (PCC) are on each scatter plot.
Fig 6
Fig 6. FVIII in HUVEC WPBs does not overlap with β-actin or Factor H.
HUVECs were fixed and treated with Triton-X prior to staining with mouse monoclonal anti-FVIII plus donkey anti-mouse IgG AF-488 (green). This was followed by staining either with goat anti-β-actin plus chicken anti-goat IgG AF-647 (red) or with goat anti-Factor H plus chicken anti-goat IgG AF-647 (red). Merged images and the corresponding intensity scatter plots are: (A and C) FVIII and β-actin at 60×, N = 4; (B and D) FVIII and β-actin at 100×, N = 4; (E and G) FVIII and Factor H at 60×, N = 3; and (F and H) FVIII and Factor H at 100×, N = 3. Values for Pearson’s correlation coefficient (PCC) are on each scatter plot.
Fig 7
Fig 7. Intensity measurements of FVIII in WPBs synchronize with VWF intensities at identical locations.
HUVECs (A and B) and GMVECs (E and F) were internally stained with mouse monoclonal anti-human FVIII plus goat anti-mouse IgG AF-647 (red) and with rabbit anti-human VWF plus chicken anti-rabbit IgG AF-488 (green). Graphs show the red (FVIII) and green (VWF) intensity values measured along a 68-μm line (from 60× images in graphs C and G) and a 35-μm line (from 100× images in graphs D and H) that traverses the WPBs. The data are representative of 5 experiments with GMVECs and 7 experiments with HUVECs.
Fig 8
Fig 8. Intensity measurements of FVIII in HUVEC WPBs are not synchronized with intensities of β-actin or Factor H.
HUVECs were internally stained with mouse monoclonal anti-human FVIII plus donkey anti-mouse IgG AF-488 (green), followed by staining either (A and B) with goat anti-β-actin plus chicken anti-goat IgG AF-647 (red) or (E and F) with goat anti-Factor H plus chicken anti-goat IgG AF-647 (red). Graphs below each merged image show the green intensity values of FVIII plus either: (C and D) the red intensity values of β-actin; or (G and H) the red intensity values of Factor H. The intensity values in the graphs were measured along lines that traverses FVIII detection in WPBs. Line lengths are 68 μm in 60× images and 35 μm in 100× images. N = 4 for FVIII measurement with β-actin and N = 3 for FVIII measurement with Factor H.
Fig 9
Fig 9. FVIII is secreted from stimulated GMVECs bound to ULVWF strings.
GMVECs were stimulated with 100 μM histamine for 2 min. Cells were then stained with rabbit anti-VWF plus chicken anti-rabbit IgG AF-488 (green), washed and fixed. Following fixation, the cells were stained with mouse monoclonal anti-FVIII plus goat anti-mouse IgG AF-647 (red). Panels (A, C and E) show representative ULVWF strings with bound FVIII from merged images. Dashed lines (that were moved away to not obscure the string image) indicate the measured portions of the string. Corresponding graphs (B from image A, D from image C, and F from image E) show the intensities from the 488-nm (VWF, green) and 647-nm (FVIII, red) channels measured along the ULVWF string (in pixels) in the merged image. In the 60× images (A and E) 100 pixels = 11.4 μm and in the 100× image (C) 200 pixels = 11.8 μm. The ratio of FVIII intensity/VWF intensity is shown for each ULVWF string. Images are representative of 9–11 experiments.
Fig 10
Fig 10. Less FVIII is bound to secreted/anchored ULVWF strings from stimulated HUVECs compared to GMVECs.
HUVECs were stimulated with 100μM histamine for 2 min. Cells were then stained as described in the legend for Fig 9 with rabbit anti-VWF plus chicken anti-rabbit IgG AF-488 (green), and with mouse monoclonal anti-FVIII plus goat anti-mouse IgG AF-647 (red). Panels (A, C and E) show representative ULVWF strings with bound FVIII from merged images. The HUVEC-secreted/anchored ULVWF string in panel (A) has predominant VWF detection and further verifies the specificity of the VWF and FVIII antibodies and their distinct fluorescent signals. Dashed lines (that were moved away to not obscure the string image) indicate the measured portions of the string. Graphs (B from image A, D from image C, and F from image E) show the intensities from the 488-nm (VWF, green) and 647-nm (FVIII, red) channels measured along the ULVWF string (in pixels) from the corresponding merged image. In the 60× images (A and E) 100 pixels = 11.4 μm and in the 100× image (C) 200 pixels = 11.8 μm. The ratio of FVIII intensity/VWF intensity is shown for each ULVWF string. Images are representative of 4 experiments.

Similar articles

Cited by

References

    1. Orlova NA, Kovnir SV, Vorobiev II, Gabibov AG, Vorobiev AI. Blood Clotting Factor VIII: From Evolution to Therapy. Acta Naturae. 2013; 5: 19–39. - PMC - PubMed
    1. Lenting PJ, Neels JG, van den Berg BM, Clijsters PP, Meijerman DW, Pannekoek H et al. The light chain of factor VIII comprises a binding site for low density lipoprotein receptor-related protein. J Biol Chem. 1999; 274: 23734–23739. - PubMed
    1. Lenting PJ, van Mourik JA, Mertens K. The life cycle of coagulation factor VIII in view of its structure and function. Blood. 1998; 92: 3983–3996. - PubMed
    1. Saenko EL, Yakhyaev AV, Mikhailenko I, Strickland DK, Sarafanov AG. Role of the low density lipoprotein-related protein receptor in mediation of factor VIII catabolism. J Biol Chem. 1999; 274: 37685–37692. - PubMed
    1. Weibel ER, Palade GE. New cytoplasmic components in arterial endothelia. J Cell Biol. 1964; 23: 101–112. - PMC - PubMed

Publication types

MeSH terms