. 2015 Oct 16;10(10):e0140803.
doi: 10.1371/journal.pone.0140803. eCollection 2015.

Differences in the Early Development of Human and Mouse Embryonic Stem Cells

Affiliations

Differences in the Early Development of Human and Mouse Embryonic Stem Cells

R Gabdoulline et al. PLoS One. .

Abstract

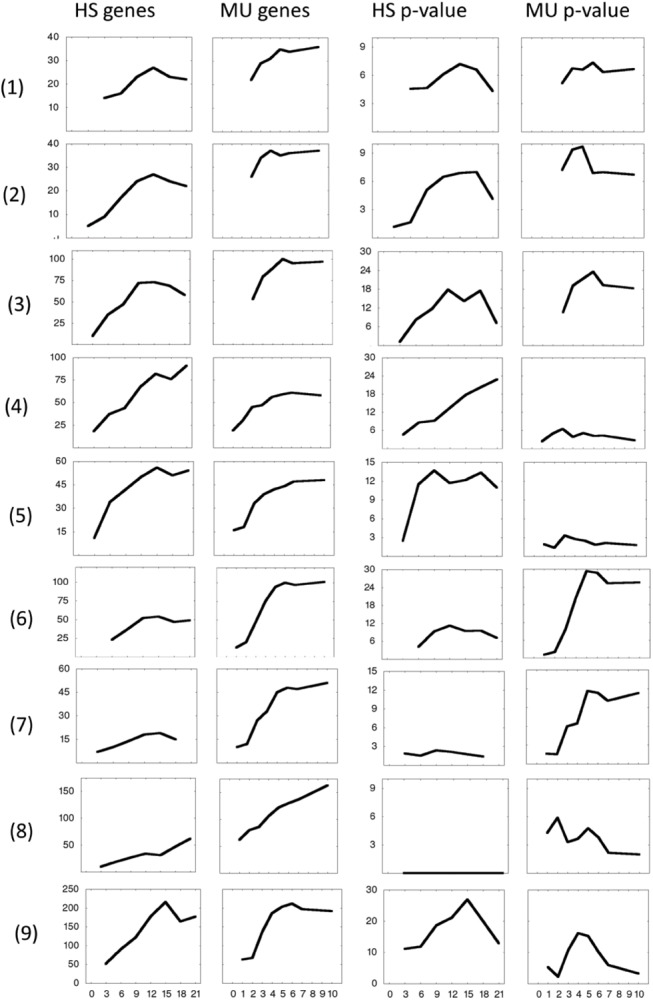
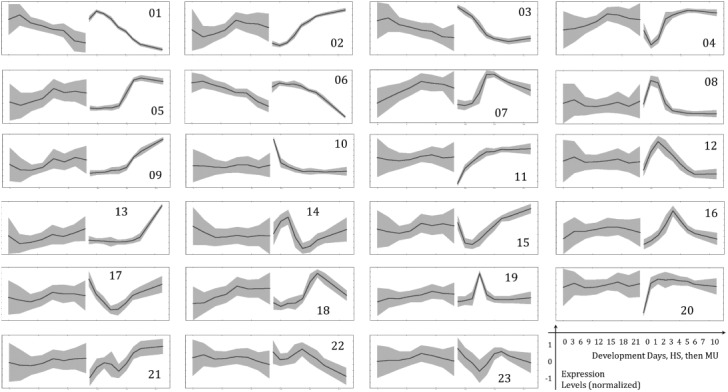
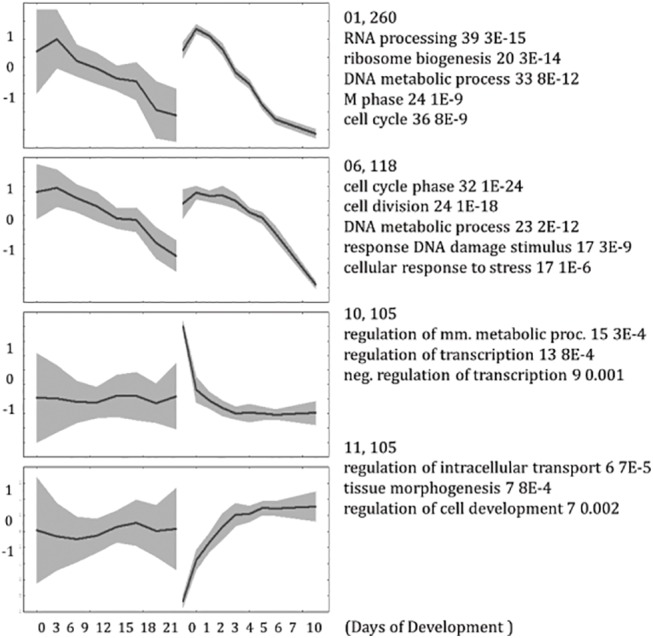
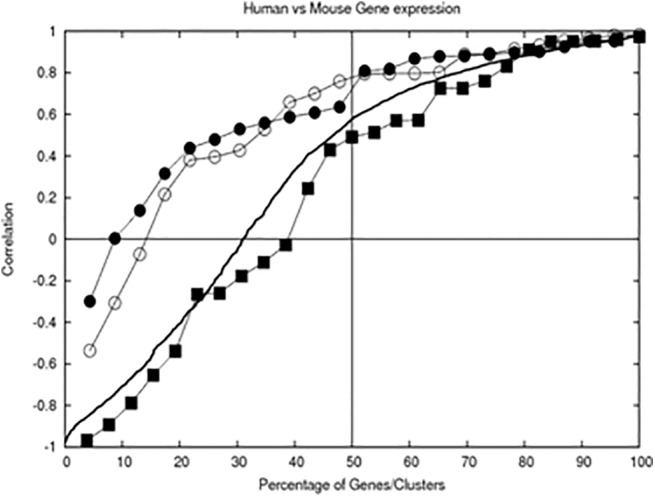
We performed a systematic analysis of gene expression features in early (10-21 days) development of human vs mouse embryonic cells (hESCs vs mESCs). Many development features were found to be conserved, and a majority of differentially regulated genes have similar expression change in both organisms. The similarity is especially evident, when gene expression profiles are clustered together and properties of clustered groups of genes are compared. First 10 days of mESC development match the features of hESC development within 21 days, in accordance with the differences in population doubling time in human and mouse ESCs. At the same time, several important differences are seen. There is a clear difference in initial expression change of transcription factors and stimulus responsive genes, which may be caused by the difference in experimental procedures. However, we also found that some biological processes develop differently; this can clearly be shown, for example, for neuron and sensory organ development. Some groups of genes show peaks of the expression levels during the development and these peaks cannot be claimed to happen at the same time points in the two organisms, as well as for the same groups of (orthologous) genes. We also detected a larger number of upregulated genes during development of mESCs as compared to hESCs. The differences were quantified by comparing promoters of related genes. Most of gene groups behave similarly and have similar transcription factor (TF) binding sites on their promoters. A few groups of genes have similar promoters, but are expressed differently in two species. Interestingly, there are groups of genes expressed similarly, although they have different promoters, which can be shown by comparing their TF binding sites. Namely, a large group of similarly expressed cell cycle-related genes is found to have discrepant TF binding properties in mouse vs human.


Conflict of interest statement

Competing Interests: The authors have declared that no competing interests exist.

Figures

Fig 1
Fig 1. Number of upregulated (compared to day 0) genes and enrichment p-values for several organ development categories and TFs.
Gene numbers (left two columns) and enrichment p-values (-log10(p), right two columns) for up-regulated genes of GO Biological Processes: (1) kidney development, (2) lung development, (3) skeletal system development, (4) neuron development, (5) sensory organ development, (6) vascular development, (7) muscle tissue development. Notation MU stands for mESC and HS for hESC data. (8) Down- and (9) upregulated genes, annotated as transcription factors.
Fig 2
Fig 2. Mouse clusters.
23 clustered expression profile sets are shown. The right part of each graph is the expression profile of (clustered) mouse genes and the left–for corresponding human genes. A line on the graphs is an average expression and grey areas indicate standard deviation of individual expression values with respect to average. Before clustering the standard deviation of expression profiles was set to 1, in order to make the results independent of specific probe set properties.
Fig 3
Fig 3. Selected clusters, annotated with GO terms.
mESC profiles are clustered and shown on the right part of the graphs; respective hESC gene profiles are on the left. First 2 examples are for the most similar time-series expression, the other 2 –for the most dissimilar cases. This is an excerpt from S7 Table.
Fig 4
Fig 4. Correlation of profiles of gene groups/clusters and individual gene pairs, sorted and drawn as a function of percentage of total number of group/gene pairs.
The bold line shows a correlation of expression profiles of the same gene in human vs in mouse. Correlation of average profiles of gene groups are also shown: line with filled circles -clustered using mESC gene expression profiles, line with open circles—clustered using hESC profiles, line with filled squares—co-clustered. The correlations were sorted and drawn as a function of percentage of all group/gene pairs, allowing comparison of cases with different number of pairs. Significance of correlation p<0.05 is at correlation coefficient larger than 0.67 for 9-point expression profiles and 0.71 for 8-point profiles.
Fig 5
Fig 5. Histogram of p-values (-log2 scale) calculated for TFBSs of clustered gene groups vs random groups of genes of the same size.
TFBS overrepresentation p-values for clustered gene groups are shown as impulses, for random groups—as lines. According to this comparison, TFBSs assigned to the group with overrepresentation p-value less than 10−9 (log2P<-29.9) can be considered to be less likely to appear by a chance.
Fig 6
Fig 6. Relation between expression and promoter similarities.
The x-axis is for Pearson correlation coefficients of average gene expression profiles of human vs mouse gene group pairs. The y-axis is for p-value of overlap of their TFBS-s lists.
Fig 7
Fig 7. Number of gene groups with binding site of TF.
Correlation between the number of gene groups/clusters, having statistically significant overrepresentation of binding sites of 81 TFs, calculated for human and mouse clusters. The points are randomly disposed. The line y = 2 x is drawn for a reference.

References

    1. Ginis I, Luo Y, Miura T, Thies S, Brandenberger R, Gerecht-Nir S, et al. Differences between human and mouse embryonic stem cells. Dev Biol. 2004;269(2):360–80. Epub 2004/04/28. 10.1016/j.ydbio.2003.12.034 S0012160604000193 [pii]. . - DOI - PubMed
    1. Sato N, Sanjuan IM, Heke M, Uchida M, Naef F, Brivanlou AH. Molecular signature of human embryonic stem cells and its comparison with the mouse. Dev Biol. 2003;260(2):404–13. Epub 2003/08/19. doi: S0012160603002562 [pii]. . - PubMed
    1. Sun Y, Li H, Liu Y, Mattson MP, Rao MS, Zhan M. Evolutionarily conserved transcriptional co-expression guiding embryonic stem cell differentiation. PLoS One. 2008;3(10):e3406 Epub 2008/10/17. 10.1371/journal.pone.0003406 - DOI - PMC - PubMed
    1. Sun Y, Li H, Liu Y, Shin S, Mattson MP, Rao MS, et al. Cross-species transcriptional profiles establish a functional portrait of embryonic stem cells. Genomics. 2007;89(1):22–35. Epub 2006/10/24. doi: S0888-7543(06)00276-X [pii] 10.1016/j.ygeno.2006.09.010 - DOI - PMC - PubMed
    1. Van Hoof D, Passier R, Ward-Van Oostwaard D, Pinkse MW, Heck AJ, Mummery CL, et al. A quest for human and mouse embryonic stem cell-specific proteins. Mol Cell Proteomics. 2006;5(7):1261–73. Epub 2006/04/08. doi: M500405-MCP200 [pii] 10.1074/mcp.M500405-MCP200 . - DOI - PubMed

Publication types

Substances

LinkOut - more resources