. 2016 Feb;25(2):393-409.
doi: 10.1002/pro.2829. Epub 2015 Nov 6.

AB-Bind: Antibody binding mutational database for computational affinity predictions

Affiliations

AB-Bind: Antibody binding mutational database for computational affinity predictions

Sarah Sirin et al. Protein Sci. 2016 Feb.

Abstract

Antibodies (Abs) are a crucial component of the immune system and are often used as diagnostic and therapeutic agents. The need for high-affinity and high-specificity antibodies in research and medicine is driving the development of computational tools for accelerating antibody design and discovery. We report a diverse set of antibody binding data with accompanying structures that can be used to evaluate methods for modeling antibody interactions. Our Antibody-Bind (AB-Bind) database includes 1101 mutants with experimentally determined changes in binding free energies (ΔΔG) across 32 complexes. Using the AB-Bind data set, we evaluated the performance of protein scoring potentials in their ability to predict changes in binding free energies upon mutagenesis. Numerical correlations between computed and observed ΔΔG values were low (r = 0.16-0.45), but the potentials exhibited predictive power for classifying variants as improved vs weakened binders. Performance was evaluated using the area under the curve (AUC) for receiver operator characteristic (ROC) curves; the highest AUC values for 527 mutants with |ΔΔG| > 1.0 kcal/mol were 0.81, 0.87, and 0.88 using STATIUM, FoldX, and Discovery Studio scoring potentials, respectively. Some methods could also enrich for variants with improved binding affinity; FoldX and Discovery Studio were able to correctly rank 42% and 30%, respectively, of the 80 most improved binders (those with ΔΔG < -1.0 kcal/mol) in the top 5% of the database. This modest predictive performance has value but demonstrates the continuing need to develop and improve protein energy functions for affinity prediction.

Keywords: affinity optimization; antibody affinity; antibody mutagenesis; computational affinity prediction; mutational database; protein interface design; protein-protein interactions; scoring interface mutations; structure-based modeling.


Figures

Figure 1
Figure 1
Analysis of the content of the AB‐Bind Database. (A–D) Violin plots illustrating the median, range, and distribution of experimentally observed changes in free energies of binding (ΔΔG) in kcal/mol over subsets of the database, where the vertical axis gives the observed ΔΔG, the bottom horizontal axis describes a subset of the database, and the top horizontal axis lists the number of variants found within the specified subset. The data are grouped based on (A) the experimental technique used, (B) the X‐ray structure resolution, (C) the mutation type, or (D) the location of the mutation site for single point mutations. Location definitions are given in the Materials and Methods section.
Figure 2
Figure 2
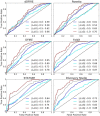
Performance of interaction predictors. ROC curves illustrate performance in classifying mutations as improved vs weakened binders, relative to a parent complex, for the whole data set (blue), or low confidence (|ΔΔG| < 0.5 kcal/mol—cyan), medium confidence (|ΔΔG| > 0.5 kcal/mol—gray), and high confidence (|ΔΔG| > 1 kcal/mol—red) subsets.
Figure 3
Figure 3
Breakdown of predictor performance over database subsets. Each cell is colored according to AUC value, see heatmap key at right, and lists 95% confidence intervals. Row labels on the left indicate database subgroup names, and labels on the right give the percentage of the database within the named subgroup. The column headings indicate the computational method used.
Figure 4
Figure 4
Enrichment of improved‐affinity binders. (A) Plot illustrating the percentage of all variants with ΔΔG < −1.0 kcal/mol found in the indicated top percentage of the computationally rank‐ordered list. (B) Venn diagrams comparing the number of variants with ΔΔG < −1.0 kcal/mol that were identified within the top 5%, 10%, or 15% of the computationally ranked database. (C) Plot illustrating the percentage of SPM variants with ΔΔG < −0.5 kcal/mol found in the indicated top percentage of the computationally rank‐ordered SPM list. (D) Venn diagrams comparing the number of SPMs with ΔΔG < −0.5 kcal/mol that were found within 10%, 20%, or 30% of the computationally ranked database.
Figure 5
Figure 5
Enrichment of improved‐affinity binders with consensus scoring. Plot showing the percentage of (A) all variants with observed ΔΔG < −1.0 kcal/mol or (B) SPM variants with observed ΔΔG < −0.5 kcal/mol found in the computationally rank‐ordered lists using rank‐by‐number, rank‐by‐rank, and rank‐by‐best consensus methods computed using FoldX and Discovery Studio predictions.

Similar articles

Cited by

References

    1. Reichert JM (2012) Marketed therapeutic antibodies compendium. Landes Bioscience, p 413. - PMC - PubMed
    1. Reichert JM. Antibodies to watch in 2014. - PMC - PubMed
    1. Sliwkowski MX, Mellman I (2013) Antibody therapeutics in cancer. Science 341:1192–1198. - PubMed
    1. Walsh G (2014) Biopharmaceutical benchmarks 2014. Nat Biotechnol 32:992–1000. - PubMed
    1. Carter PJ (2006) Potent antibody therapeutics by design. Nat Rev Immunol 6:343–357. - PubMed

Publication types