. 2015 Oct 16;10(10):e0140583.
doi: 10.1371/journal.pone.0140583. eCollection 2015.

Phosphorylation and Internalization of Lysophosphatidic Acid Receptors LPA1, LPA2, and LPA3

Affiliations

Phosphorylation and Internalization of Lysophosphatidic Acid Receptors LPA1, LPA2, and LPA3

Rocío Alcántara-Hernández et al. PLoS One. .

Abstract

Results: The lysophosphatidic acid receptors LPA1, LPA2, and LPA3 were individually expressed in C9 cells and their signaling and regulation were studied. Agonist-activation increases intracellular calcium concentration in a concentration-dependent fashion. Phorbol myristate acetate markedly inhibited LPA1- and LPA3-mediated effect, whereas that mediated by LPA2 was only partially diminished; the actions of the phorbol ester were inhibited by bisindolylmaleimide I and by overnight incubation with the protein kinase C activator, which leads to down regulation of this protein kinase. Homologous desensitization was also observed for the three LPA receptors studied, with that of LPA2 receptors being consistently of lesser magnitude; neither inhibition nor down-regulation of protein kinase C exerted any effect on homologous desensitization. Activation of LPA1-3 receptors induced ERK 1/2 phosphorylation; this effect was markedly attenuated by inhibition of epidermal growth factor receptor tyrosine kinase activity, suggesting growth factor receptor transactivation in this effect. Lysophosphatidic acid and phorbol myristate acetate were able to induce LPA1-3 phosphorylation, in time- and concentration-dependent fashions. It was also clearly observed that agonists and protein kinase C activation induced internalization of these receptors. Phosphorylation of the LPA2 subtype required larger concentrations of these agents and its internalization was less intense than that of the other subtypes.

Conclusion: Our data show that these three LPA receptors are phosphoproteins whose phosphorylation state is modulated by agonist-stimulation and protein kinase C-activation and that differences in regulation and cellular localization exist, among the subtypes.


Conflict of interest statement

Competing Interests: The authors have declared that no competing intersts exist.

Figures

Fig 1
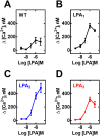
Fig 1. Effect of LPA on intracellular calcium concentration ([Ca2+]i).
Wild type C9 cells (panel A) or overexpressing LPA1 (panel B), LPA2 (panel C) or LPA3 (panel D) were stimulated by different concentrations of LPA. Plotted are the increases in intracellular calcium as mean ± S. E. M. of 4–5 experiments using different cell preparations.
Fig 2
Fig 2. Effect of preincubation with PMA (heterologous desensitization) or LPA (homologous desensitization) on LPA-induced intracellular calcium concentration ([Ca2+]i).
Cells overexpressing LPA1 (black, circles), LPA2 (blue, squares) or LPA3 (red, triangles) receptors were preincubated in the absence or presence of different PMA concentrations for 2 min and then challenged with 1 μM LPA (panel A) or with different concentrations of LPA for 10 minutes, washed 3 times and then challenged with 1 μM LPA (panel B) and the increase in intracellular free calcium concentration was determined. Plotted are the increases in calcium as the percentage of that obtained in cells preincubated without any agent as mean ± S. E. M. of 6 experiments using different cell preparations.
Fig 3
Fig 3. Effect of preincubation with PMA (heterologous desensitization) or LPA (homologous desensitization) on LPA-induced intracellular calcium concentration ([Ca2+]i) using high agonist concentrations.
Cells overexpressing LPA1 (panel A, black), LPA2 (panel B, blue) or LPA3 (panel C, red) receptors were preincubated in the absence or presence of 1 μM LPA for 10 min, extensively washed, then challenged with the indicated concentrations of LPA, and the increase in intracellular free calcium concentration was determined. Plotted are the increases in calcium as the percentage of that obtained in cells preincubated without any agent and challenged with 1 μM LPA (C 1 in the abscisa) (% of control) as mean ± S. E. M. of 6 experiments using different cell preparations. In the right panels concentration response curves are plotted. Data from Fig 1 (without pre-stimulation) were normalized and re-plotted as percentage of the maximal response (solid symbols and continuous connecting lines) together with those in the left panels of this figure, normalized in the same way (open symbols, dotted connected lines). The response of cells preincubated with 1 μM PMA for 2 min, washed, and then challenged with to 100 μM LPA is also presented (solid triangles).
Fig 4
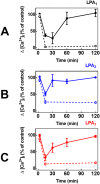
Fig 4. Reversibility (homologous) and persistency (heterologous) of the desensitizations of the intracellular calcium response to LPA.
Cells overexpressing LPA1 (panel A, black symbols and lines), LPA2 (panel B, blue symbols and lines) or LPA3 (panel C, red symbols and lines) receptors were preincubated in the presence of 1 μM PMA for 2 min (open symbols, dotted lines) or with 1 μM LPA for 10 minutes and then extensively washed. Incubation was continued for the times indicated and cells were challenged with 1 μM LPA and the increase in intracellular free calcium concentration was determined. Plotted are the increases in calcium as the percentage of that obtained in cells preincubated without any agent (control, time 0) as mean ± S. E. M. of 5–6 experiments using different cell preparations.
Fig 5
Fig 5. Effect of PKC inhibition on heterologous (PMA-induced) or homologous (LPA-induced) desensitization.
Cells overexpressing LPA1–3 receptors were preincubated for 15 min in the presence of the PKC inhibitor, bisindolylmaleimide I (BIM), and then subjected to the desensitization protocols (indicated under the Experimental section and in Fig 2), using 1 μM PMA or 1 μM LPA. Cells were challenged with 1 μM LPA and the increase in intracellular free calcium concentration was determined. Plotted are the increases in calcium as the percentage of that obtained in cells preincubated without any agent as mean ± S. E. M. of 6–8 experiments using different cell preparations. *p < 0.001 vs. baseline.
Fig 6
Fig 6. Effect of PKC down regulation on heterologous (PMA-induced) or homologous (LPA-induced) desensitization.
Cells overexpressing LPA1–3 receptors were preincubated overnight with 1 μM PMA, and then subjected to the desensitization protocols (indicated under the Experimental section and in Fig 2) using 1 μM PMA (2 min) or 1 μM LPA (10 min). Cells were challenged with 1 μM LPA, and the increase in intracellular free calcium concentration was determined. Plotted are the increases in calcium as the percentage of that obtained in cells preincubated without any agent as mean ± S. E. M. of 5–7 experiments using different cell preparations. *p < 0.001 vs baseline; **p <0.05 vs baseline.
Fig 7
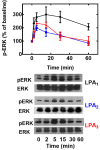
Fig 7. Effect of LPA on ERK 1/2 phosphorylation.
Cells overexpressing LPA1 (black, circles), LPA2 (blue, squares) or LPA3 (red, triangles) receptors were incubated for the times indicated in the presence of 1 μM LPA, incubation was terminated and phospho-ERK 1/2 (pERK) and total ERK 1/2 (ERK) were assayed by Western blotting. Plotted are the increases in phospho-ERK 1/2 as mean ± S. E. M. of 4–5 experiments using different cell preparations. Representative Western blots are presented for the different receptor subtypes.
Fig 8
Fig 8. Transactivation of EGF receptors in LPA-induced ERK 1/2 phosphorylation.
Cells overexpressing LPA1 (panels A and D), LPA2 (panels B and E) or LPA3 (panels C and F) receptors were incubated in the absence or presence of 10 μM AG1478 (AG) for 30 min and then challenged with 1 μM LPA (panels A-C) or 100 ng/ml EGF (panels D-F) for 5 min; incubation was terminated and phospho-ERK 1/2 (pERK) and total ERK 1/2 (ERK) were assayed by Western blotting. Plotted are the increases in phospho-ERK 1/2 as mean ± S. E. M. of 4–5 experiments using different cell preparations. Representative Western blots are presented for the different receptor subtypes. *p < 0.001 vs. baseline (B); ** p <0.001 vs. LPA or EGF alone.
Fig 9
Fig 9. Time-courses of the effects of LPA and PMA on LPA1–3 receptor phosphorylation.
Cells overexpressing LPA1 (black, circles), LPA2 (blue, squares) or LPA3 (red, triangles) receptors were incubated for the times indicated in the presence of 1 μM LPA (Panel A) or 1 μM PMA (Panel B). Plotted are the percentage of baseline phosphorylations as mean ± S. E. M. of 4–5 experiments using different cell preparations. Representative autoradiographs are presented for the different receptor subtypes.
Fig 10
Fig 10. Concentration-response curves to LPA and PMA on LPA1–3 receptor phosphorylation.
Cells overexpressing LPA1 (black, circles), LPA2 (blue, squares) or LPA3 (red, triangles) receptors were incubated for 15 min in the presence of different concentrations of LPA (Panel A) or PMA (Panel B). Plotted are the percentage of baseline phosphorylations as mean ± S. E. M. of 4–5 experiments using different cell preparations. Representative autoradiographs are presented for the different receptor subtypes.
Fig 11
Fig 11. Role of EGF receptor transactivation on LPA-induced LPA1–3 receptor phosphorylation.
Cells overexpressing LPA1 (panel A, black bars), LPA2 (panel B, blue bars) or LPA3 (panel C, red bars) receptors were preincubated for 30 min in the absence or presence of 10 μM AG1478 (+AG) and then incubated for 15 min in the absence or presence of 1 μM LPA. Plotted are the percentage of baseline (B) phosphorylations as mean ± S. E. M. of 4–5 experiments using different cell preparations. Representative autoradiographs are presented on the top of the figures for the different receptor subtypes. p < 0.001 vs. baseline; p < 0.05 vs. baseline and vs. LPA alone.
Fig 12
Fig 12. Role of PKC down-regulation on LPA- and PMA-induced LPA1–3 receptor phosphorylation.
Cells overexpressing LPA1 (panel A, black bars), LPA2 (panel B, blue bars) or LPA3 (panel C, red bars) receptors were incubated in the absence or presence of 1 μM PMA overnight, washed and subjected to the receptor phosphorylation protocol. Cells were incubated for 15 min in the absence or presence of 1 μM LPA or 1 μM PMA. Plotted are the percentage of baseline (B) phosphorylations as mean ± S. E. M. of 3–4 experiments using different cell preparations. Representative autoradiographs separated by vertical lines are presented on the top of the figures for the different receptor subtypes. p < 0.001 vs. baseline; ** p < 0.05 vs. baseline.
Fig 13
Fig 13. Images of the effects of LPA and PMA on LPA1–3 receptor internalization.
Fluorescent confocal images of cells overexpressing LPA1 (column A), LPA2 (column B) or LPA3 (column C) receptors were incubated in the absence of any agent (Baseline) or for 30 or 60 min in the presence of 1 μM LPA or 1 μM PMA. Images are representative of data of 3–4 experiments using different cell preparations. Bars 15 μm.
Fig 14
Fig 14. Effects of LPA and PMA on LPA1–3 receptor internalization.
Cells overexpressing LPA1 (panel A), LPA2 (panel B) or LPA3 (Panel C) receptors were incubated for 30 or 60 min in the presence of 1 μM LPA or 1 μM PMA. Plotted is membrane-associated fluorescence (arbitrary units) as the mean ± S. E. M. of 5 different fields of 3–4 experiments using different cell preparations. * p <0.001 vs. baseline (B), ** p < 0.01 vs. baseline (B), *** p < 0.05 vs. baseline (B).
Fig 15
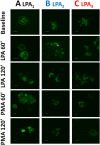
Fig 15. Images of the effects of LPA and PMA on LPA1–3 receptor internalization (60 and 120 min).
Fluorescent confocal images of cells overexpressing LPA1 (column A), LPA2 (column B) or LPA3 (column C) receptors. Cells were incubated in the absence of any agent (Baseline), for 10 min in the presence of 1 μM LPA, or for 2 min in the presence of 1 μM PMA. After this incubation cells were extensively washed and further incubated for the times indicated. Images are representative of data of 3 experiments using different cell preparations. Bars 10 μm.
Fig 16
Fig 16. Effects of LPA and PMA on LPA1–3 receptor internalization (60 and 120 min).
Cells overexpressing LPA1 (panel A), LPA2 (panel B) or LPA3 (Panel C) receptors were incubated in the absence of any agent (Baseline), for 10 min in the presence of 1 μM LPA, or for 2 min in the presence of 1 μM PMA. After this incubation cells were extensively washed and further incubated for the times indicated (60 or 120 min) Plotted is membrane-associated fluorescence (arbitrary units) as the mean ± S. E. M. of 5 different fields of 3 experiments using different cell preparations. * p <0.001 vs. baseline (B), ** p < 0.01 vs. baseline (B), *** p < 0.05 vs. baseline (B).

References

    1. Choi JW, Herr DR, Noguchi K, Yung YC, Lee CW, Mutoh T, et al. LPA receptors: subtypes and biological actions. Annu Rev Pharmacol Toxicol. 2010;50:157–86. Epub 2010/01/09. 10.1146/annurev.pharmtox.010909.105753 . - DOI - PubMed
    1. Im DS. Pharmacological tools for lysophospholipid GPCRs: development of agonists and antagonists for LPA and S1P receptors. Acta Pharmacol Sin. 2010;31(9):1213–22. 10.1038/aps.2010.135 . - DOI - PMC - PubMed
    1. Tigyi G. Aiming drug discovery at lysophosphatidic acid targets. Br J Pharmacol. 2010;161(2):241–70. Epub 2010/08/26. 10.1111/j.1476-5381.2010.00815.x - DOI - PMC - PubMed
    1. Hernández-Méndez A, Alcántara-Hernández R., García-Sáinz J. A. Lysophosphatidic Acid LPA 1–3 receptors: signaling, regulation and in silico analysis of their putative phosphorylation sites. Recept Clin Invest. 2014;1:236–52. 10.14800/rci.193 - DOI
    1. Yung YC, Stoddard NC, Chun J. LPA receptor signaling: pharmacology, physiology, and pathophysiology. J Lipid Res. 2014;55(7):1192–214. 10.1194/jlr.R046458 - DOI - PMC - PubMed

Publication types