. 2015 Oct 12;12(10):12577-604.
doi: 10.3390/ijerph121012577.

Regional Projections of Extreme Apparent Temperature Days in Africa and the Related Potential Risk to Human Health

Affiliations

Regional Projections of Extreme Apparent Temperature Days in Africa and the Related Potential Risk to Human Health

Rebecca M Garland et al. Int J Environ Res Public Health. .

Abstract

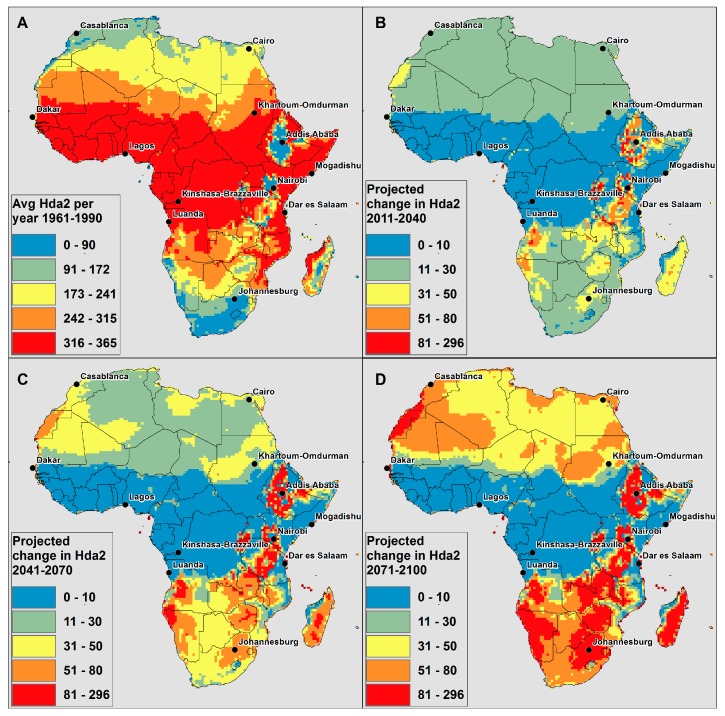
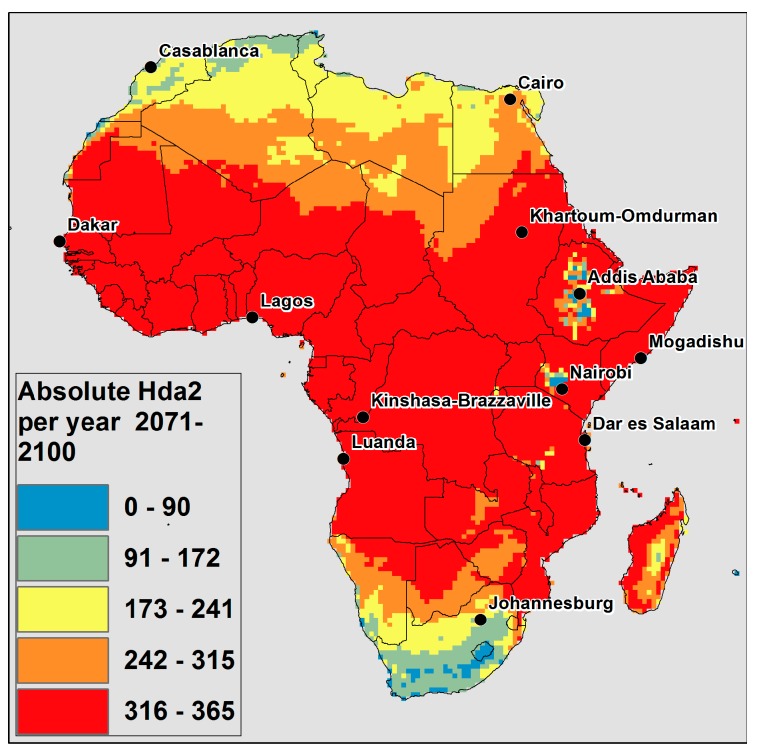
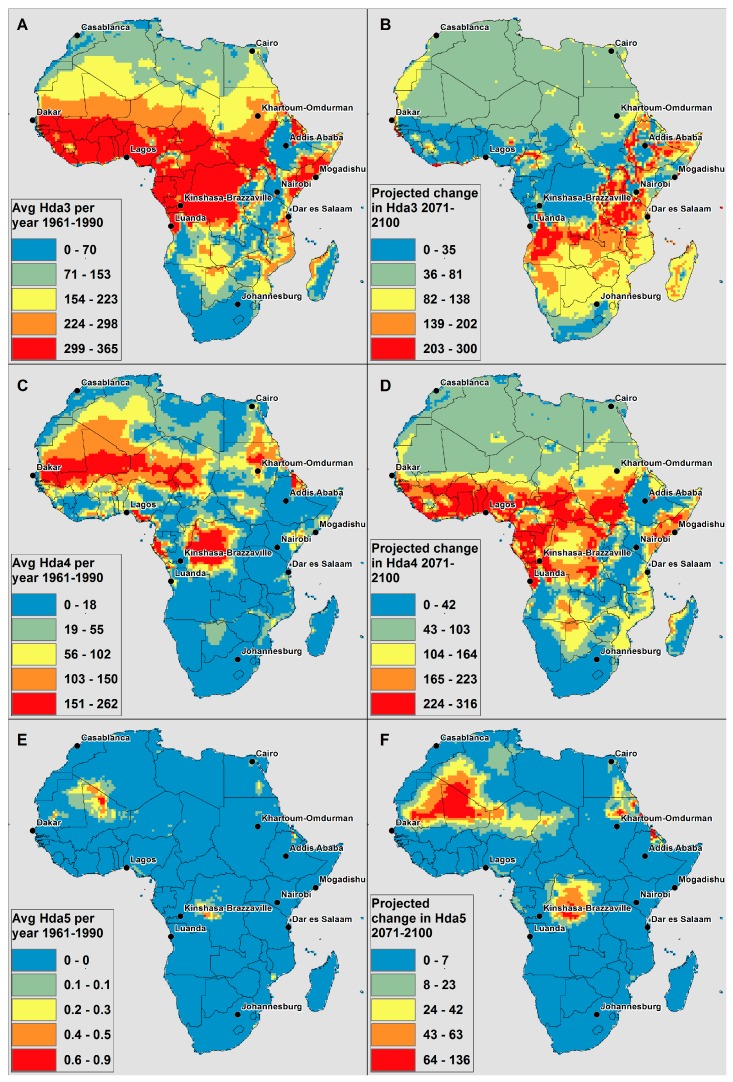
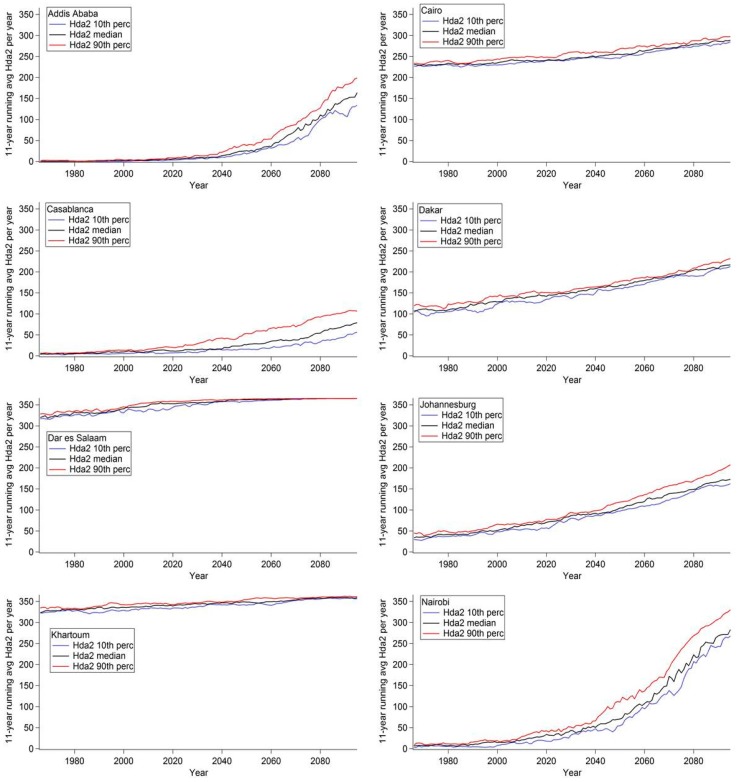
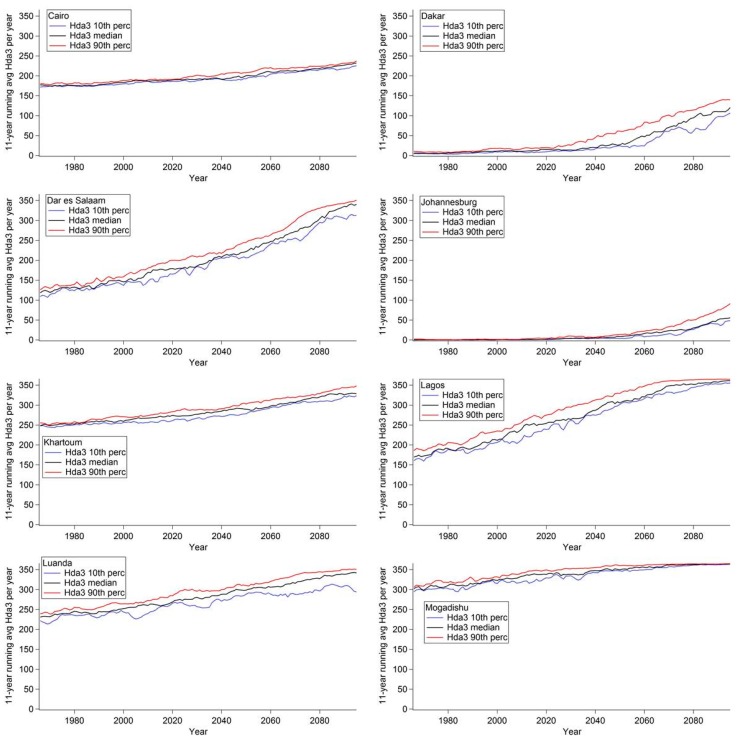
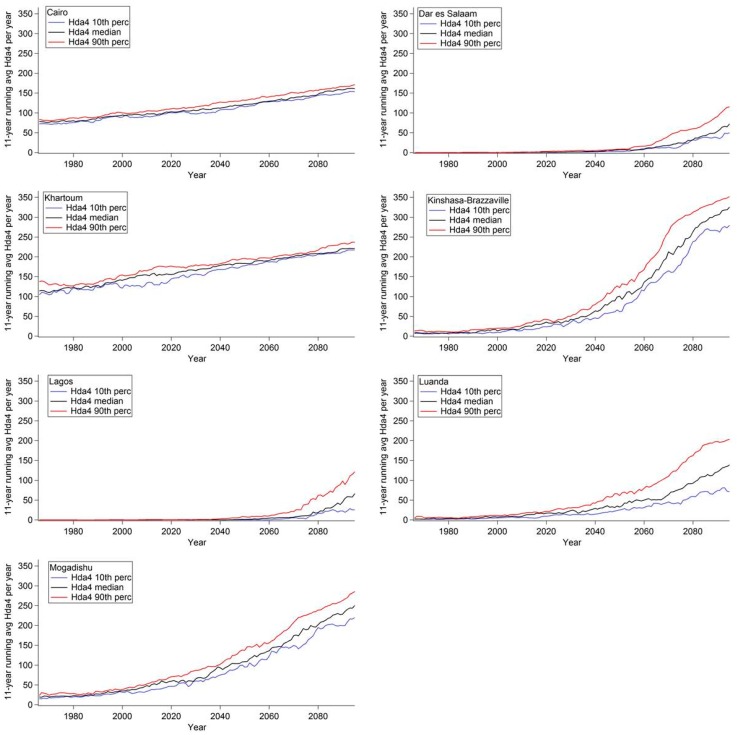
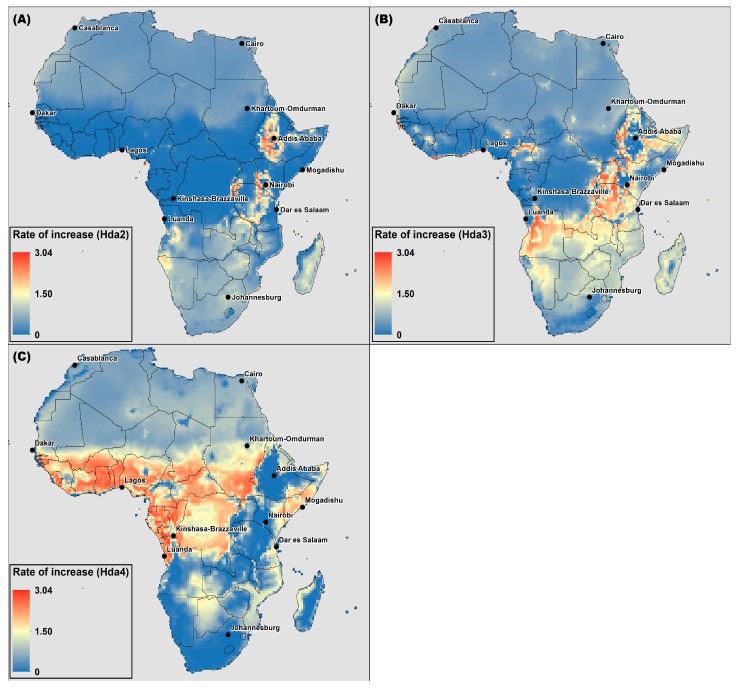
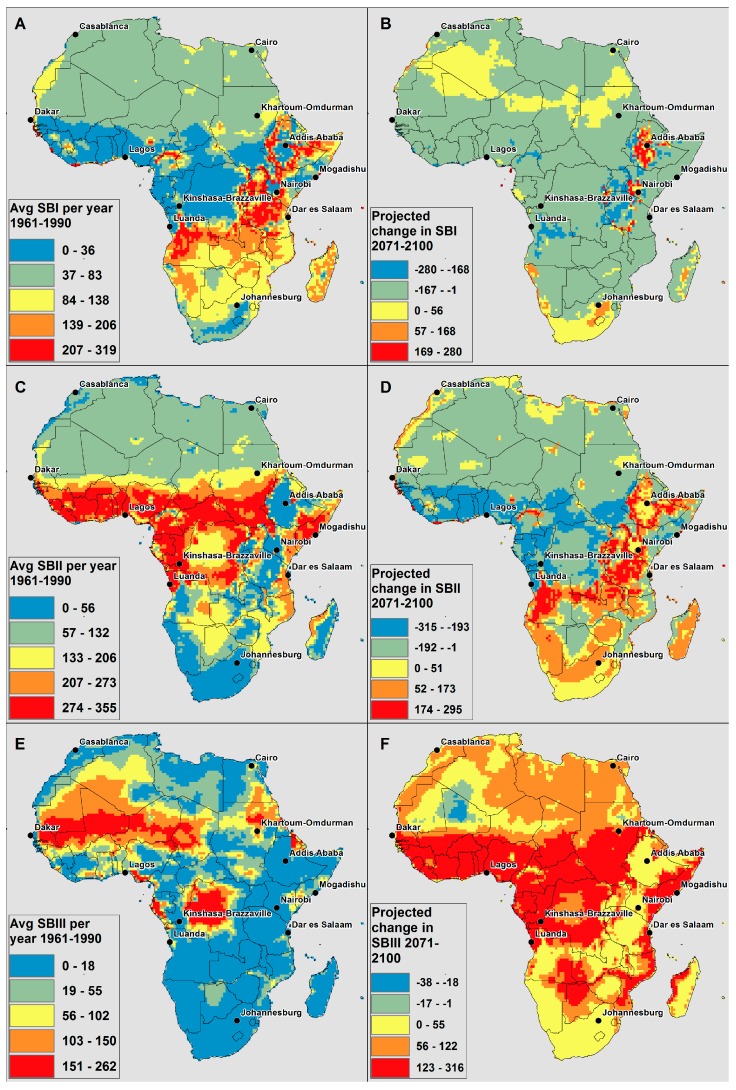
Regional climate modelling was used to produce high resolution climate projections for Africa, under a "business as usual scenario", that were translated into potential health impacts utilizing a heat index that relates apparent temperature to health impacts. The continent is projected to see increases in the number of days when health may be adversely affected by increasing maximum apparent temperatures (AT) due to climate change. Additionally, climate projections indicate that the increases in AT results in a moving of days from the less severe to the more severe Symptom Bands. The analysis of the rate of increasing temperatures assisted in identifying areas, such as the East African highlands, where health may be at increasing risk due to both large increases in the absolute number of hot days, and due to the high rate of increase. The projections described here can be used by health stakeholders in Africa to assist in the development of appropriate public health interventions to mitigate the potential health impacts from climate change.

Keywords: Africa; climate change; climate services; human health; regional climate modelling.


Figures

Figure 1
Figure 1
CCAM model derived (A) average number of Hda2 per year in present climate; (B) projected change in average number of Hda2 per year in 2011–2040 compared to 1961–1990; (C) projected change in average number of Hda2 per year in 2041–2070 compared to 1961–1990; (D) projected change in average number of Hda2 per year in 2071–2100 compared to 1961–1990.
Figure 2
Figure 2
CCAM model outputs for number of Hda2 per year projected in 2071–2100.
Figure 3
Figure 3
CCAM model derived (A) average number of Hda3 per year in present climate (1961–1990); (B) change in average number of Hda3 per year in 2071–2100 compared to 1961–1990; (C) average number of Hda4 per year in present climate (1961–1990); (D) change in average number of Hda4 per year in 2071–2100 compared to 1961–1990; (E) average number of Hda5 per year in present climate (1961–1990); (F) change in average number of Hda5 per year in 2071–2100 compared to 1961–1990.
Figure 4
Figure 4
Eleven-year moving average of the number of Hda2 per year in selected cities in Africa. The ensemble 10th percentile (blue), the ensemble median (black) and the ensemble 90th percentile (red) of number of days per year are shown.
Figure 5
Figure 5
Eleven-year moving average of the number of Hda3 per year in selected cities in Africa. The ensemble 10th percentile (blue), the ensemble median (black) and the ensemble 90th percentile (red) of number of days per year are shown.
Figure 6
Figure 6
Eleven-year moving average of the number of Hda4 per year in selected cities in Africa. The ensemble 10th percentile (blue), the ensemble median (black) and the ensemble 90th percentile (red) of number of days per year are shown.
Figure 7
Figure 7
The average rate of increase of the 11-year moving average of (A) Hda2; (B) Hda3; (C) Hda4 for the median ensemble member for 1966–2095.
Figure 8
Figure 8
CCAM model derived (A) average number of Symptom Band I days per year in present climate (1961–1990); (B) change in average number of Symptom Band I days per year in 2071–2100 compared to 1961–1990; (C) average number of Symptom Band II days per year in present climate (1961–1990); (D) change in average number of Symptom Band II days per year in 2071–2100 compared to 1961–1990; (E) average number of Symptom Band III days per year in present climate (1961–1990); (F) change in average number of Symptom Band III days per year in 2071–2100 compared to 1961–1990.

References

    1. Collins J.M. Temperature variability over Africa. J. Clim. 2011;24:3649–3666. doi: 10.1175/2011JCLI3753.1. - DOI
    1. Niang I., Ruppel O.C., Abdrabo M.A., Essel A., Lennard C., Padgham J., Urquhart P. Africa. In: Barros V.R., Field C.B., Dokken D.J., Mastrandrea M.D., Mach K.J., Bilir T.E., Chatterjee M., Ebi K.L., Estrada Y.O., Genova R.C., et al., editors. Climate change 2014: Impacts, Adaptation, and Vulnerability. Part B: Regional Aspects. Contribution of Working Group II to the Fifth Assessment Report of the Intergovernmental Panel of Climate Change. Cambridge University Press; Cambridge, UK; New York, NY, USA: 2014. pp. 1199–1265.
    1. Kovats R.S., Hajat S. Heat stress and public health: A critical review. Annu. Rev. Public Health. 2008;29:41–55. doi: 10.1146/annurev.publhealth.29.020907.090843. - DOI - PubMed
    1. Kilbourne E.M. Heat waves and hot environments. In: Noji E.K., editor. The Public Health Consequences of Disasters. Oxford University Press; New York, NY, USA: 1997.
    1. Chung J.-Y., Honda Y., Hong Y.-C., Pan X.-C., Guo Y.-L., Kim H. Ambient temperature and mortality: An international study in four capital cities of east asia. Sci. Total Environ. 2009;408:390–396. doi: 10.1016/j.scitotenv.2009.09.009. - DOI - PubMed

Publication types

LinkOut - more resources