

HGT-Finder: A New Tool for Horizontal Gene Transfer Finding and Application to Aspergillus genomes
- PMID: 26473921
- PMCID: PMC4626719
- DOI: 10.3390/toxins7104035
HGT-Finder: A New Tool for Horizontal Gene Transfer Finding and Application to Aspergillus genomes
Abstract
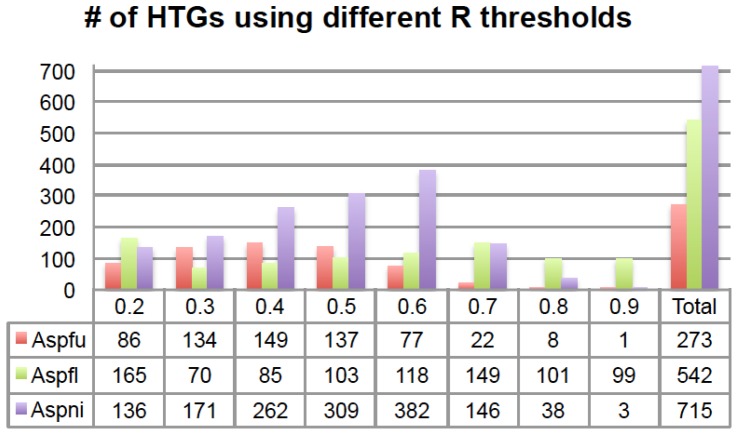
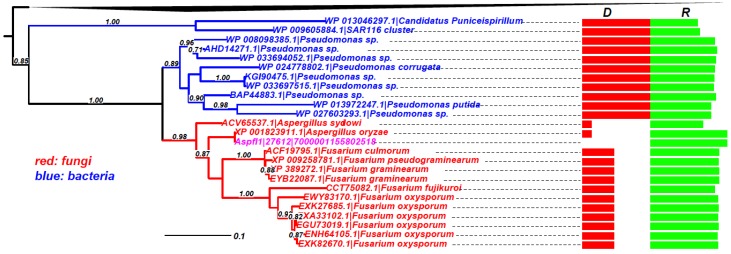
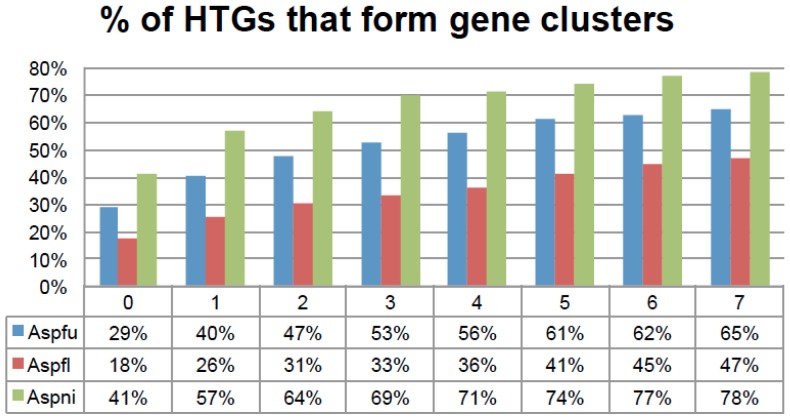
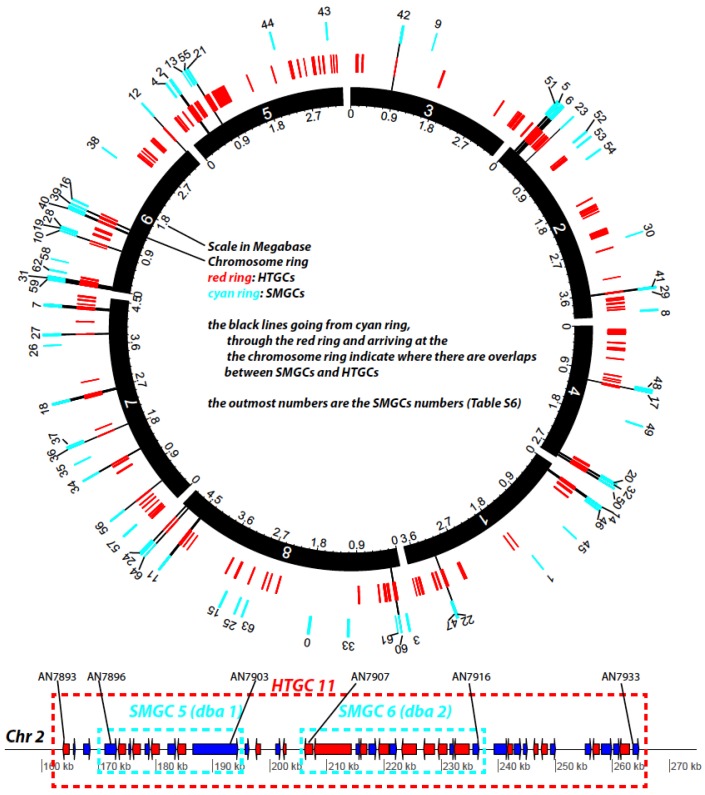
Horizontal gene transfer (HGT) is a fast-track mechanism that allows genetically unrelated organisms to exchange genes for rapid environmental adaptation. We developed a new phyletic distribution-based software, HGT-Finder, which implements a novel bioinformatics algorithm to calculate a horizontal transfer index and a probability value for each query gene. Applying this new tool to the Aspergillus fumigatus, Aspergillus flavus, and Aspergillus nidulans genomes, we found 273, 542, and 715 transferred genes (HTGs), respectively. HTGs have shorter length, higher guanine-cytosine (GC) content, and relaxed selection pressure. Metabolic process and secondary metabolism functions are significantly enriched in HTGs. Gene clustering analysis showed that 61%, 41% and 74% of HTGs in the three genomes form physically linked gene clusters (HTGCs). Overlapping manually curated, secondary metabolite gene clusters (SMGCs) with HTGCs found that 9 of the 33 A. fumigatus SMGCs and 31 of the 65 A. nidulans SMGCs share genes with HTGCs, and that HTGs are significantly enriched in SMGCs. Our genome-wide analysis thus presented very strong evidence to support the hypothesis that HGT has played a very critical role in the evolution of SMGCs. The program is freely available at http://cys.bios.niu.edu/HGTFinder/ HGTFinder.tar.gz.
Keywords: Aspergillus; HGT; bioinformatics; gene clusters; horizontal gene transfer; secondary metabolism; software.
Figures
Similar articles
-
Horizontal gene transfer in fungi.FEMS Microbiol Lett. 2012 Apr;329(1):1-8. doi: 10.1111/j.1574-6968.2011.02465.x. Epub 2011 Dec 15. FEMS Microbiol Lett. 2012. PMID: 22112233 Review.
-
Algorithms for computing parsimonious evolutionary scenarios for genome evolution, the last universal common ancestor and dominance of horizontal gene transfer in the evolution of prokaryotes.BMC Evol Biol. 2003 Jan 6;3:2. doi: 10.1186/1471-2148-3-2. Epub 2003 Jan 6. BMC Evol Biol. 2003. PMID: 12515582 Free PMC article.
-
The cobweb of life revealed by genome-scale estimates of horizontal gene transfer.PLoS Biol. 2005 Oct;3(10):e316. doi: 10.1371/journal.pbio.0030316. Epub 2005 Aug 30. PLoS Biol. 2005. PMID: 16122348 Free PMC article.
-
A genomics based discovery of secondary metabolite biosynthetic gene clusters in Aspergillus ustus.PLoS One. 2015 Feb 23;10(2):e0116089. doi: 10.1371/journal.pone.0116089. eCollection 2015. PLoS One. 2015. PMID: 25706180 Free PMC article.
-
Origins of bacterial diversity through horizontal genetic transfer and adaptation to new ecological niches.FEMS Microbiol Rev. 2011 Sep;35(5):957-76. doi: 10.1111/j.1574-6976.2011.00292.x. Epub 2011 Jul 29. FEMS Microbiol Rev. 2011. PMID: 21711367 Review.
Cited by
-
Secondary Metabolite Dereplication and Phylogenetic Analysis Identify Various Emerging Mycotoxins and Reveal the High Intra-Species Diversity in Aspergillus flavus.Front Microbiol. 2019 Apr 5;10:667. doi: 10.3389/fmicb.2019.00667. eCollection 2019. Front Microbiol. 2019. PMID: 31024476 Free PMC article.
-
Database Bias in the Detection of Interdomain Horizontal Gene Transfer Events in Pezizomycotina.Biology (Basel). 2024 Jun 26;13(7):469. doi: 10.3390/biology13070469. Biology (Basel). 2024. PMID: 39056664 Free PMC article.
-
The effects of Pseudomonas strains isolated from Achnatherum inebrians on plant growth: A genomic perspective.Environ Microbiol Rep. 2024 Oct;16(5):e70011. doi: 10.1111/1758-2229.70011. Environ Microbiol Rep. 2024. PMID: 39387603 Free PMC article.
-
Transcription Factors in the Fungus Aspergillus nidulans: Markers of Genetic Innovation, Network Rewiring and Conflict between Genomics and Transcriptomics.J Fungi (Basel). 2021 Jul 25;7(8):600. doi: 10.3390/jof7080600. J Fungi (Basel). 2021. PMID: 34436139 Free PMC article.
-
Genomic and transcriptomic analysis of the toluene degrading black yeast Cladophialophora immunda.Sci Rep. 2017 Sep 12;7(1):11436. doi: 10.1038/s41598-017-11807-8. Sci Rep. 2017. PMID: 28900256 Free PMC article.
References
Publication types
MeSH terms
Grants and funding
LinkOut - more resources
Full Text Sources
Other Literature Sources
Miscellaneous
