. 2015 Oct 16;10(10):e0140585.
doi: 10.1371/journal.pone.0140585. eCollection 2015.

Knockout Serum Replacement Promotes Cell Survival by Preventing BIM from Inducing Mitochondrial Cytochrome C Release

Affiliations

Knockout Serum Replacement Promotes Cell Survival by Preventing BIM from Inducing Mitochondrial Cytochrome C Release

Yuki Ishii et al. PLoS One. .

Abstract

Knockout serum replacement (KOSR) is a nutrient supplement commonly used to replace serum for culturing stem cells. We show here that KOSR has pro-survival activity in chronic myelogenous leukemia (CML) cells transformed by the BCR-ABL oncogene. Inhibitors of BCR-ABL tyrosine kinase kill CML cells by stimulating pro-apoptotic BIM and inhibiting anti-apoptotic BCL2, BCLxL and MCL1. We found that KOSR protects CML cells from killing by BCR-ABL inhibitors--imatinib, dasatinib and nilotinib. The protective effect of KOSR is reversible and not due to the selective outgrowth of drug-resistant clones. In KOSR-protected CML cells, imatinib still inhibited the BCR-ABL tyrosine kinase, reduced the phosphorylation of STAT, ERK and AKT, down-regulated BCL2, BCLxL, MCL1 and up-regulated BIM. However, these pro-apoptotic alterations failed to cause cytochrome c release from the mitochondria. With mitochondria isolated from KOSR-cultured CML cells, we showed that addition of recombinant BIM protein also failed to cause cytochrome c release. Besides the kinase inhibitors, KOSR could protect cells from menadione, an inducer of oxidative stress, but it did not protect cells from DNA damaging agents. Switching from serum to KOSR caused a transient increase in reactive oxygen species and AKT phosphorylation in CML cells that were protected by KOSR but not in those that were not protected by this nutrient supplement. Treatment of KOSR-cultured cells with the PH-domain inhibitor MK2206 blocked AKT phosphorylation, abrogated the formation of BIM-resistant mitochondria and stimulated cell death. These results show that KOSR has cell-context dependent pro-survival activity that is linked to AKT activation and the inhibition of BIM-induced cytochrome c release from the mitochondria.


Conflict of interest statement

Competing Interests: The authors have declared that no competing interests exist.

Figures

Fig 1
Fig 1. Rapid induction of resistance to BCR-ABL kinase inhibitors in serum replacement media without cytokines.
(A) Quantification of response to imatinib by clonogenic survival assay under different media conditions. K562 cells were plated in the indicated media (S1 Table) +/- 1 μM imatinib. After 72 hours, cells were re-plated in 0.8% methylcellulose in regular media (RPMI+10%FBS) and the numbers of colonies were counted 10 days later. Values are means ± s.d. of three experiments performed in triplicates. Statistical analysis: *, p<0.05; **, p<0.01. (B) Effect of cytokines on the imatinib response. K562 cells were plated in RPMI or StemSpan media plus 10% FBS with or without 1 μM of imatinib in the presence or the absence of cytokines (4 units/mL of EPO, 10ng/mL of IL-3, 100ng/mL of IL-6, 100ng/mL of SCF, and 100ng/mL of Flt-3L). Survival was measured by clonogenic assay as in (A). Values are means ± s.d. of three experiments performed in triplicates. *, p<0.05; **, p<0.01. (C) Inhibition of BCR-ABL tyrosine phosphorylation by imatinib (IM) in different media. Whole lysates from K562 cells cultured in the indicated media treated with IM (1 μM, 24 hours) or not were immunoblotted with anti-pY245, which measures the autophosphorylation of BCR-ABL on the ABL-tyrosine-245 residue. The levels of GAPDH serve as loading controls. BCR-ABL is autophosphorylated on many sites and can thus migrate as multiple bands depending on the stoichiometry of overall phosphorylation. (D) Quantification of response to dasatinib and nilotinib under different media conditions. K562 cells were plated in the regular, StemSpan (no cytokines) or KOSR media with or without 5 nM of dasatinib or 10 nM of nilotinib for clonogenic assay. Representative results are shown as the mean from one experiment performed in triplicate. *, p<0.05; **, p<0.01.
Fig 2
Fig 2. Cell context dependent induction of TKI-resistance by KOSR.
(A) Imatinib dose-response in BCR-ABL positive CML cell lines treated in regular media (RPMI with 10% FBS) or in KOSR media (RPMI with 20% KOSR). AR230-R cells are imatinib-resistant clones generated from AR230. Relative cell number was measured by MTT assay at 48 hours. Data shown are mean ± SEM (n = 8). (B) Gefitinib dose-response in NSCLC cells treated in the indicated media for 48 hours. Data shown are mean ± SEM values from MTT assays (n = 8).
Fig 3
Fig 3. KOSR does not cause growth arrest and is continuously required to induce imatinib resistance.
(A) K562 cells proliferate in KOSR-media without or with imatinib (IM). Cells were seeded (2x10⁵cells/ml) in RPMI+10%FBS, RPMI+20%KOSR or RPMI+20%KOSR+10%FBS ± 1 μM of imatinib on day 0 and live cell numbers counted every 24 hours. After 3-days, the cultures were split (2x10⁵cells/ml) into fresh media and counting continued for 3 more days. The K562 cells cultured in the RPMI+FBS+IM media and the LAMA-84 cells cultured in the three media containing IM were not split due to low live cell numbers and simply carried forward (indicated by the continuity of the curves). The data shown are the mean ± s.d. from three independent experiments with duplicates in each experiment. (B) KOSR does not cause cell cycle arrest. K562 cells were cultured in RPMI+FBS or RPMI+KOSR media ± 1 μM of imatinib for 3 days. Cells were fixed, stained with propidium iodide and the DNA contents (cell cycle distributions) were determined by flow cytometry. The data shown are the mean from four experimental samples. (C) KOSR-induced resistance to imatinib is reversible. K562 cells were pre-cultured with 1 μM of imatinib (IM) in RPMI+KOSR or RPMI+KOSR+FBS media for 6 days with splitting on day-3. Cells were then collected and re-plated in RPMI+KOSR, RPMI+KOSR+FBS or RPMI+FBS media in the presence of 1 μM of IM (day 0). Live cell numbers were counted daily for 3 days. The data shown are the mean ± s.d. from three independent experiments with duplicates in each experiment.
Fig 4
Fig 4. Imatinib-induced cytochrome c release was blocked despite inhibition of survival pathways in K562 cells on defined media.
(A) Levels of BCR-ABL and proteins in downstream pathways that promote growth and survival. K562 cells were cultured in the indicated media ± 1 μM of imatinib for 24 hours. WCLs were immunoblotted with the indicated antibodies. The levels of GAPDH are shown as loading control. (B) Levels of the anti-apoptotic and pro-apoptotic BCL-2 family proteins. The same sets of samples as used in (A) were probed for the indicated proteins. The levels of X-linked inhibitor of apoptosis protein (XIAP) were also examined. (C) Levels of caspases and PARP1. The same set of samples as used in (A) were immunoblotted with the indicated antibodies to assess caspase activation. The bar graph represents the cell numbers in each sample (n = 5) after 2 days. **, p<0.01. (D) DEVDase activity measurements. K562 cells were cultured in the indicated media ± 1 μM of imatinib. At the indicated time, cells were harvested and the cleavage of Ac-DEVD-AMC determine by fluorescence. Representative results are presented as the mean from one independent experiment performed in triplicate. *, p<0.05; **, p<0.01. (E) Cytochrome c release. K562 cells were cultured in the indicated media ± 1 μM of imatinib for 2 days. Mitochondria and cytosolic fractions were prepared as described in Experimental Procedures and immunoblotted for cytochrome c and COX 4.
Fig 5
Fig 5. Mitochondria from KOSR-cultured cells did not release cytochrome c when stimulated with recombinant BIM-EL in vitro.
(A) In vitro-translated BIM-EL (extra long variant of BIM). Human BIM-EL, mouse Bim-EL and mouse Bim-EL-ΔBH3 translated in vitro using the TNT Quick coupled Transcription/Translation System reacted with the anti-BIM antibody. (B) Induction of cytochrome c release from mitochondria FBS-cultured K562 cells in the test tubes. Mitochondria isolated from FBS-cultured K562 cells were incubated with the indicated amounts of in vitro translated human, mouse and mutant proteins for 1 hour. The reactions were centrifuged and the levels of cytochrome c and COX4 in the supernatant and the pellet fractions were determined by immunoblotting. (C) Mitochondria from KOSR-cultured K562 cells were resistant to BIM-induced cytochrome c release. K562 cells were cultured in the indicated media for 2 days. Mitochondria were isolated and incubated without or with in vitro translated human BIM-EL and the release of cytochrome c determined as in (B). (D) cBID stimulated cytochrome c release from isolated mitochondria. K562 cells were cultured in the indicated media for 2 days. Mitochondria were isolated and incubated with the indicated concentrations of cBid and the release of cytochrome c determined as in (B). (E) Levels of endogenous and exogenous BCL2-family proteins in isolated mitochondria. Mitochondria isolated from K562 cells grown in the indicated culture media were incubated with in vitro translated human BIM-EL protein for 1 hour. The reaction mixtures were centrifuged and the supernatant and pellet fractions were immunoblotted with the indicated antibodies to detect the levels of the endogenous BCL2, BCLxL, MCL1 proteins and the exogenously added BIM-EL protein.
Fig 6
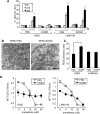
Fig 6. Effects of KOSR on the mitochondria.
(A) Mitochondrial membrane potential (ΔΨm) in cells at the indicated time after imatinib (1 μM) addition in the indicated culture media. Data shown are mean ± SEM (n = 6). Note that the KOSR media did not affect ΔΨm, but prevented imatinib from causing ΔΨm dissipation in K562 but not LAMA84 cells. *, p<0.05; **, p<0.01. (B) Electron micrographs of K562 cells cultured for 24 hours in the indicated media. Scale bar: 500nM. (C) ROS levels (arbitrary units) in cells after switching to the regular (R) or the KOSR (K) media for 2 hours. Data shown are mean ± SEM (n = 5). *, p<0.05. (D) Menadione dose-response in K562 or LAMA-84 cells in the indicated media. Relative cell number determined by MTT assay is shown as mean ± SEM (n = 8).
Fig 7
Fig 7. Combined inhibition of BCR-ABL and AKT overcame the protective effect of KOSR.
(A) Induction of p-AKT at 1 hour after treatment of cells with the indicated concentrations of H2O2. The levels of p-AKT (Ser473) and total AKT were determined by western blotting. (B) Rapid Induction of p-AKT upon media switch. K562 cells were cultured in the regular or KOSR ±1 μM of imatinib for 1 hour. (C) AKT-PH-domain inhibitor MK2206 blocked p-AKT increase. K562 cells were pre-treated with 0, 0.1 or 3 μM of MK2206 in the regular media for 24 hours, then re-plated either in the regular or the KOSR media with the same doses of MK2206 used as in pre-treatments. The levels of p-AKT (Ser473) and total AKT were determined by western blotting. (D) Overcoming imatinib-resistance with AKT-PH-domain inhibitor MK2206. K562 cells were pre-treated with MK2206 (0, 0.1, 1, 5 μM) in the regular media. After 24 hours, cells were re-plated in the regular or the KOSR media with indicated doses of MK2206 ± imatinib (1 μM). Survival was measured by clonogenic assay. The values are means ± SEM (n = 6). *, p<0.05. (E) Overcoming imatinib-resistance with PI3 kinase inhibitor, SF1126. K562 cells were pre-treated with SF1126 (0, 20, 40, 60 μM) in the regular media. After 24 hours, cells were re-plated in the regular or the KOSR media with indicated doses of SF1126 ± 1 μM of imatinib. MTT assay was performed after 3 days to determine the relative cell number. The values are means ± SEM (n = 8). *, p<0.05.
Fig 8
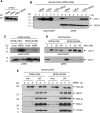
Fig 8. AKT inhibitor prevented the formation of BIM-resistant mitochondria in KOSR-cultured cells.
(A) Caspase 3 cleavage in KOSR-cultured K562 cells treated with MK2206 (3 μM) and imatinib (1 μM) for 24 hours. Whole cell lysates were immunolotted with antibody specific to cleaved caspase 3. (B) DEVDase activity (arbitrary units, a.u.) in K562 cells treated with imatinib (1 μM) and the indicated concentrations of MK2206 for 2 days. The values shown are mean± SEM (n = 6). *, p<0.05; **, p<0.01. (C) Cytochrome c release in K562 cells treated with imatinib (1 μM) and MK2206 (3 μM) for 2 days. Cells were lysed, fractionated and then probed for cytochrome c, COX4 and GAPDH in the cytosolic and the mitochondrial fractions. (D) Inhibition of p-AKT by MK2206 in the mitochondrial fraction. K562 cells were cultured in the regular or the KOSR media in the presence or the absence of MK2206 (3 μM) for 18 hours. Mitochondria were isolated and immunoblotted with anti-p-AKT, anti-AKT or anti-COX 4 antibodies. (E) Blocking BIM-resistant mitochondria formation with MK2206. K562 cells were cultured in the regular or the KOSR media with or without MK2206 (3 μM) for 2 days. Mitochondria were isolated and incubated with or without in vitro-translated mouse BIM-EL or mouse BIM-EL-ΔBH3 mutant for 1 hour. The levels of cytochrome c in the supernatant and the pellet fractions were examined by immunoblotting.
Fig 9
Fig 9. Gefinitib-resistant AKT phosphorylation in NSCLC cells.
(A) The effect of gefitinib on p-AKT, p-tyrosine and BIM levels in NSCLC cells. H1650 and HCC827 cells were cultured in the regular media with the indicated concentrations of gefitinib for 24 hours. WCLs were immunoblotted with anti-p-AKT, anti-BIM and p-tyrosine (4G10) antibodies. (B) MK2206 sensitized H1650 cells to gefitinib. Relative cell number was measured by MTT assay at 4 days after incubations with the indicated drugs. Values are means ± SEM (n = 9). **, p<0.01.

References

    1. O'Brien S, Radich JP, Abboud CN, Akhtari M, Altman JK, Berman E, et al. Chronic Myelogenous Leukemia, Version 1.2014. J Natl Compr Canc Netw. 2013;11(11):1327–40. Epub 2013/11/15. - PMC - PubMed
    1. Zabriskie MS, Eide CA, Tantravahi SK, Vellore NA, Estrada J, Nicolini FE, et al. BCR-ABL1 compound mutations combining key kinase domain positions confer clinical resistance to ponatinib in Ph chromosome-positive leukemia. Cancer Cell. 2014;26(3):428–42. Epub 2014/08/19. 10.1016/j.ccr.2014.07.006 - DOI - PMC - PubMed
    1. Holyoake TL, Helgason GV. Do we need more drugs for chronic myeloid leukemia? Immunol Rev. 2015;263(1):106–23. Epub 2014/12/17. 10.1111/imr.12234 . - DOI - PubMed
    1. Asmussen J, Lasater EA, Tajon C, Oses-Prieto J, Jun YW, Taylor BS, et al. MEK-dependent negative feedback underlies BCR-ABL-mediated oncogene addiction. Cancer Discov. 2014;4(2):200–15. Epub 2013/12/24. 10.1158/2159-8290.CD-13-0235 - DOI - PMC - PubMed
    1. Akiyama T, Dass CR, Choong PF. Bim-targeted cancer therapy: a link between drug action and underlying molecular changes. Mol Cancer Ther. 2009;8(12):3173–80. Epub 2009/11/26. 10.1158/1535-7163.MCT-09-0685 . - DOI - PubMed

Publication types

MeSH terms