. 2015 Oct 16;11(10):e1005218.
doi: 10.1371/journal.ppat.1005218. eCollection 2015 Oct.

The Candida albicans Histone Acetyltransferase Hat1 Regulates Stress Resistance and Virulence via Distinct Chromatin Assembly Pathways

Affiliations

The Candida albicans Histone Acetyltransferase Hat1 Regulates Stress Resistance and Virulence via Distinct Chromatin Assembly Pathways

Michael Tscherner et al. PLoS Pathog. .

Abstract

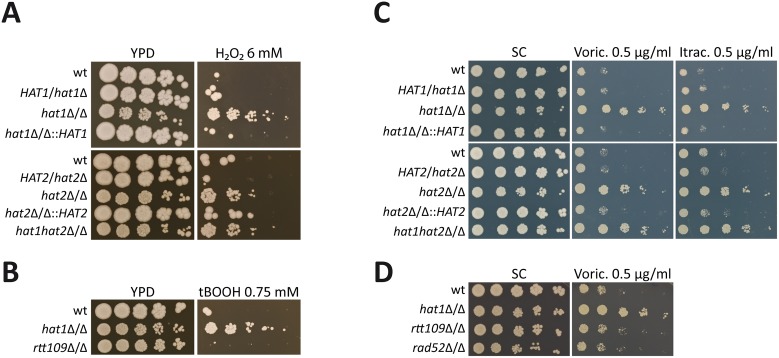
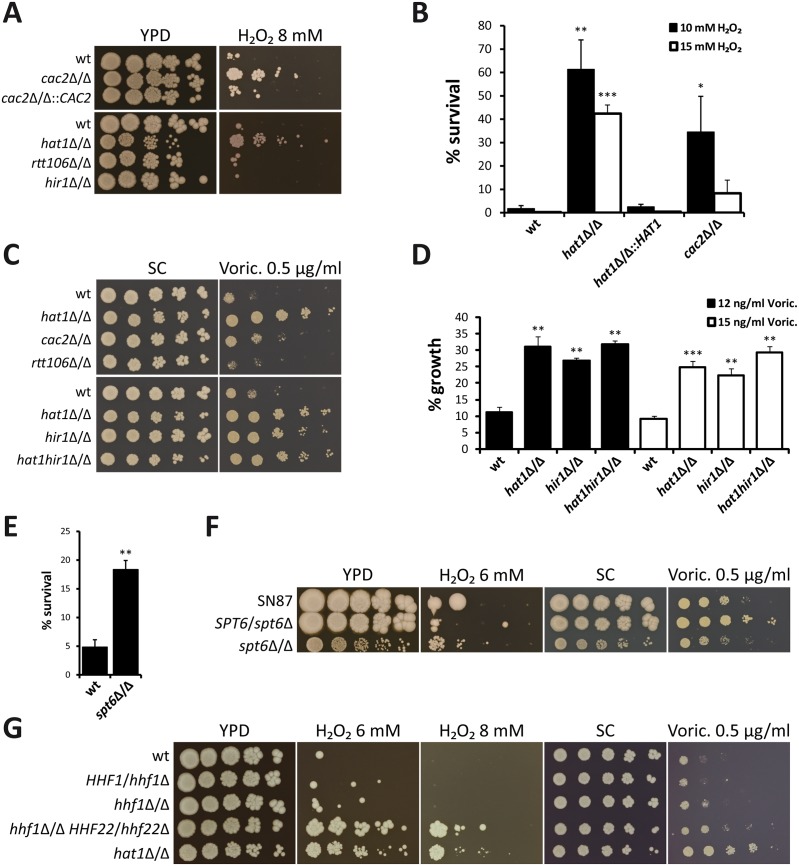
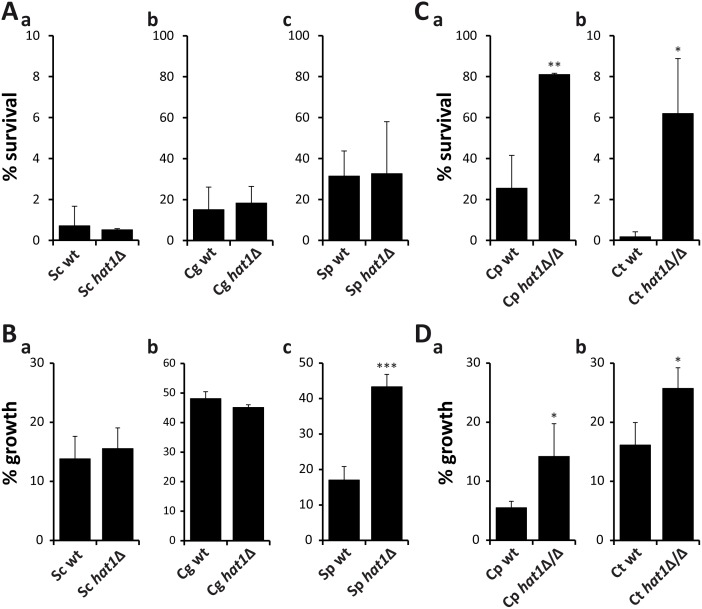
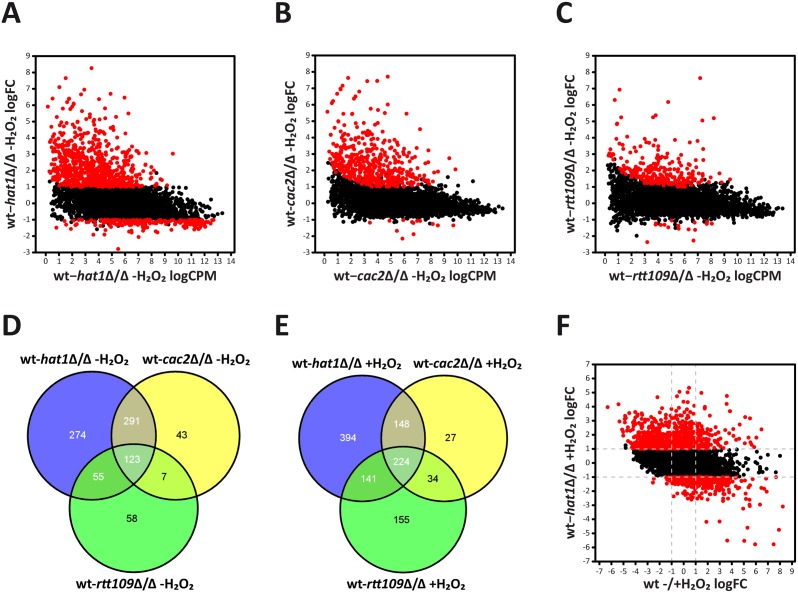
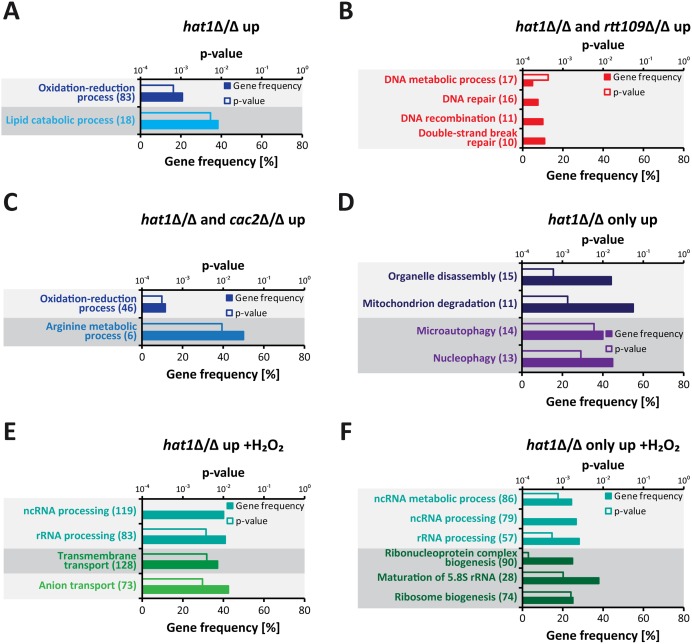
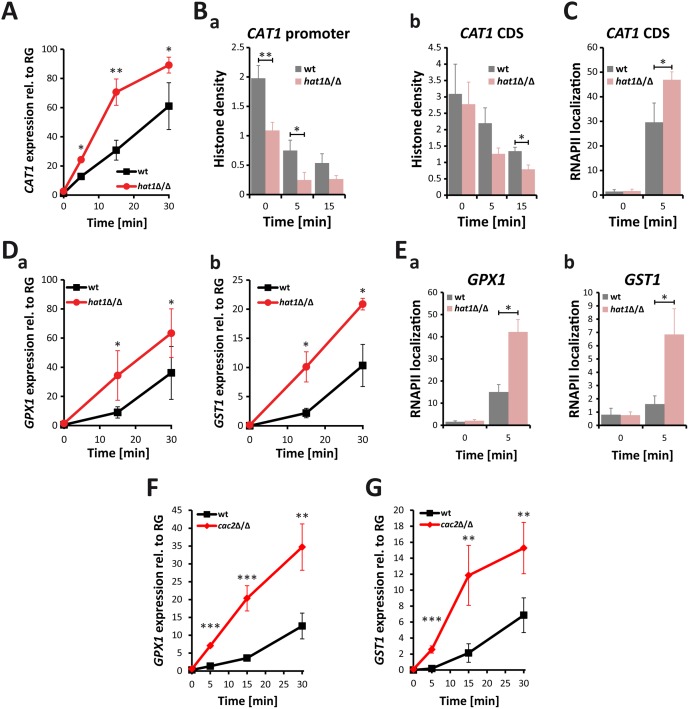
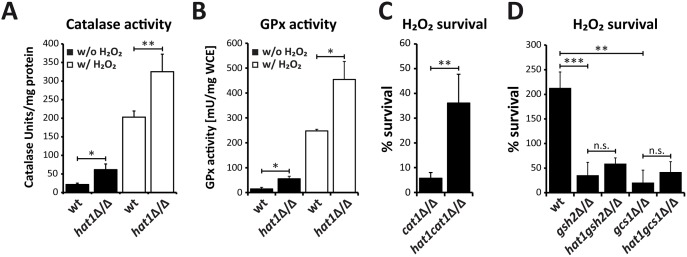
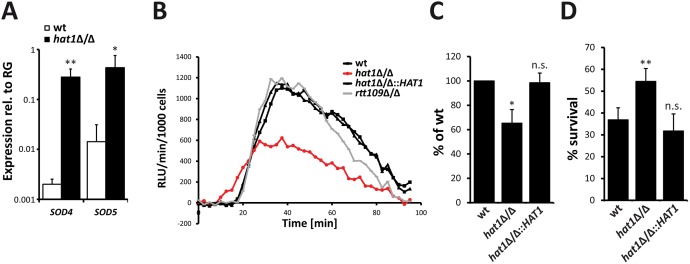
Human fungal pathogens like Candida albicans respond to host immune surveillance by rapidly adapting their transcriptional programs. Chromatin assembly factors are involved in the regulation of stress genes by modulating the histone density at these loci. Here, we report a novel role for the chromatin assembly-associated histone acetyltransferase complex NuB4 in regulating oxidative stress resistance, antifungal drug tolerance and virulence in C. albicans. Strikingly, depletion of the NuB4 catalytic subunit, the histone acetyltransferase Hat1, markedly increases resistance to oxidative stress and tolerance to azole antifungals. Hydrogen peroxide resistance in cells lacking Hat1 results from higher induction rates of oxidative stress gene expression, accompanied by reduced histone density as well as subsequent increased RNA polymerase recruitment. Furthermore, hat1Δ/Δ cells, despite showing growth defects in vitro, display reduced susceptibility to reactive oxygen-mediated killing by innate immune cells. Thus, clearance from infected mice is delayed although cells lacking Hat1 are severely compromised in killing the host. Interestingly, increased oxidative stress resistance and azole tolerance are phenocopied by the loss of histone chaperone complexes CAF-1 and HIR, respectively, suggesting a central role for NuB4 in the delivery of histones destined for chromatin assembly via distinct pathways. Remarkably, the oxidative stress phenotype of hat1Δ/Δ cells is a species-specific trait only found in C. albicans and members of the CTG clade. The reduced azole susceptibility appears to be conserved in a wider range of fungi. Thus, our work demonstrates how highly conserved chromatin assembly pathways can acquire new functions in pathogenic fungi during coevolution with the host.


Conflict of interest statement

The authors have declared that no competing interests exist.

Figures

Fig 1
Fig 1. Deletion of HAT1 and HAT2 increases oxidative stress resistance and azole tolerance.
(A) Cells lacking Hat1 or Hat2 show increased resistance to H2O2. Lack of both genes mimics the corresponding single deletion strains. (B) Deletion of HAT1 increases resistance to tert-butyl hydroperoxide (tBOOH). Lack of Rtt109 does not affect tBOOH sensitivity. (C) Loss of Hat1 causes reduced susceptibility to voriconazole (Voric.) and itraconazole (Itrac.). Deletion of HAT2 or HAT1 and HAT2 mimics loss of Hat1. (D) Deletion of RTT109 or RAD52 does not increase voriconazole tolerance. (A-D) Fivefold serial dilutions of the indicated strains were spotted on agar plates containing the indicated substances and pictures were taken after incubation at 30°C for 3 days.
Fig 2
Fig 2. Lack of histone chaperones mimics deletion of HAT1.
(A) Loss of Cac2 increases H2O2 resistance. Deletion of RTT106 or HIR1 does not affect susceptibility to hydrogen peroxide. Fivefold serial dilutions of the indicated strains were spotted on agar plates containing the indicated substances and pictures were taken after incubation at 30°C for 3 days. (B) Deletion of HAT1 or CAC2 increases survival to transient hydrogen peroxide treatment. Exponentially growing cells were treated with the indicated concentrations of H2O2 for 2 hours. Cells were plated and colonies counted after 3 days of incubation on YPD plates at 30°C to determine viability. Data are shown as mean + SD from three independent experiments. (C) Deletion of HIR1 reduces voriconazole (Voric.) susceptibility. The hat1hir1Δ/Δ double deletion strain mimics lack of Hat1. Loss of Cac2 has only a minor effect and deletion of RTT106 does not alter azole susceptibility. Experiment was performed as described in (A). (D) Increased azole tolerance of hat1Δ/Δ, hir1Δ/Δ and hat1hir1Δ/Δ was confirmed using a liquid growth inhibition assay. Logarithmically growing cells were diluted into medium containing the indicated concentrations of voriconazole (Voric.) and incubated at 30°C for 18 hours. OD600 was determined and growth inhibition relative to untreated samples was calculated. Data are shown as mean + SD from three independent experiments. (E) Lack of Spt6 reduces H2O2 susceptibility. Experiment was performed as described in (B). Cells were treated with 10 mM H2O2. Data are shown as mean + SD from two independent experiments. (F) Deletion of SPT6 increases H2O2 resistance and azole tolerance. Fivefold serial dilutions of the indicated strains were spotted on agar plates containing the indicated substances and pictures were taken after incubation at 30°C for 5 days. (G) Reduction of histone gene dosage decreases H2O2 and azole susceptibility. Experiment was performed as described in (A). (B, D, E) *P<0.05, **P<0.01 and ***P<0.001 relative to the corresponding wild-type (Student's t-test).
Fig 3
Fig 3. Resistance phenotypes caused by loss of Hat1 are specific for C. albicans.
(A) Deletion of HAT1 in S. cerevisiae (a), C. glabrata (b) and S. pombe (c) has no effect on H2O2 resistance. Exponentially growing cells were treated with 5 mM (a), 50 mM (b) or 20 mM (c) H2O2 for 2 hours. Cells were plated and colonies counted after 3 days of incubation on YPD plates at 30°C to determine viability. Data are shown as mean + SD from three independent experiments. (B) Lack of Hat1 in S. cerevisiae (a) and C. glabrata (b) does not increase azole tolerance. Deletion of Hat1 in S. pombe reduces susceptibility to voriconazole (c). Logarithmically growing cells were diluted into medium containing 150 ng/ml (a), 1000 ng/ml (b) or 800 ng/ml (c) voriconazole and incubated at 30°C for 24 hours. OD600 was determined and growth inhibition relative to untreated samples was calculated. Data are shown as mean + SD from three independent experiments. (C) C. parapsilosis (a) and C. tropicalis (b) hat1Δ/Δ cells show increased resistance to H2O2. Experiment was performed as described in (A). H2O2 concentrations were 50 mM (a) and 20 mM (b). (D) Loss of Hat1 in C. parapsilosis (a) and C. tropicalis (b) reduces susceptibility to voriconazole. Experiment was performed as described in (B). For C. parapsilosis cells were incubated for 41 hours prior to OD600 measurement. Voriconazole concentrations were 50 ng/ml (a) and 200 ng/ml (b). (A-D) *P<0.05, **P<0.01 and ***P<0.001 relative to the corresponding wild-type (Student's t-test).
Fig 4
Fig 4. Deletion of HAT1 primarily leads to upregulation of genes.
(A) Lack of Hat1 causes mainly induction of genes in logarithmically growing cells. Each dot corresponds to one protein-coding gene. The fold change in RNA expression between untreated wild-type and hat1Δ/Δ cells (y-axis) is plotted against the expression level of each gene in this dataset (x-axis). Differentially expressed genes in the hat1Δ/Δ mutant are depicted in red. logCPM: log2 counts per million reads; logFC: log2 fold change; (B+C) Loss of Cac2 or Rtt109 causes almost exclusively upregulation of genes in logarithmically growing cells. Plots were created as described in (A). (D) Venn diagram showing the overlaps of upregulated genes in the hat1Δ/Δ, cac2Δ/Δ and rtt109Δ/Δ mutants in the absence of H2O2. (E) Venn diagram showing the overlaps of upregulated genes in the hat1Δ/Δ, cac2Δ/Δ and rtt109Δ/Δ mutants upon treatment with H2O2. (F) H2O2 repressed genes are upregulated in the hat1Δ/Δ mutant upon peroxide treatment. Each dot corresponds to one protein-coding gene. The -fold change in RNA expression between H2O2 treated wild-type and hat1Δ/Δ strains (y-axis) is plotted against the fold change between the wild-type without and with treatment (x-axis). Differentially expressed genes in the hat1Δ/Δ mutant are depicted in red. logFC: log2 fold change; (A-F) Differentially regulated genes were defined by a fold change > = 2 and p-value <0.05.
Fig 5
Fig 5. Specific functional gene groups are upregulated in cells lacking Hat1.
(A) GO terms enriched among 2-fold significantly upregulated genes in logarithmically growing hat1Δ/Δ cells are shown. (B) The plot shows GO terms found within genes significantly upregulated in the hat1Δ/Δ and rtt109Δ/Δ strains only. (C) GO terms enriched within genes significantly upregulated in the hat1Δ/Δ and cac2Δ/Δ strains only. (D) The panel shows GO terms found among genes significantly upregulated in the hat1Δ/Δ mutant only and not in the rtt109Δ/Δ and the cac2Δ/Δ strains. (E) GO terms enriched among significantly upregulated genes in hat1Δ/Δ cells after treatment with H2O2 are shown. (F) The plot shows GO terms found within genes significantly upregulated in the hat1Δ/Δ strain only and not in the rtt109Δ/Δ and the cac2Δ/Δ strains upon H2O2 treatment. (A-F) The corresponding p-values for the enrichment (empty bars) and the percentage of genes changed within the GO group (filled bars) are presented. The absolute number of regulated genes within a GO group is presented in brackets. Groups containing identical genes are depicted in the same color. Significantly regulated genes were defined by a p-value <0.05.
Fig 6
Fig 6. Lack of Hat1 accelerates induction of oxidative stress genes.
(A) Catalase induction rate is strongly increased in hat1Δ/Δ cells. CAT1 expression levels were measured by RT-qPCR after induction with 1.6 mM H2O2 at the indicated time points. Transcript levels were normalized to the expression level of the reference gene (RG) PAT1. Data are shown as mean + SD from 3 independent experiments. (B) Histone density at the CAT1 locus is reduced in cells lacking Hat1. Histone H3 occupancy was determined by ChIP at the CAT1 promoter region (a) and the CDS (b). (C) Loss of Hat1 leads to increased RNAPII recruitment at the CAT1 locus. RNAPII levels were determined by ChIP at the CAT1 CDS. (D) Induction rate of glutathione-utilizing enzymes is increased in hat1Δ/Δ cells. GPX1 (a) and GST1 (b) expression levels were determined by RT-qPCR at the indicated time points. Experiment was performed as described in (A). (E) Lack of Hat1 leads to increased RNAPII recruitment at the GPX1 and GST1 loci. RNAPII levels were determined by ChIP at the GPX1 (a) and GST1 (b) genes. (F+G) Loss of Cac2 increases the induction rate of both GPX1 and GST1 following H2O2 treatment. Experimental conditions were used as described in (A).
Fig 7
Fig 7. Loss of Hat1 raises antioxidant enzyme activity and glutathione-mediated H2O2 resistance.
(A) Faster CAT1 induction increases catalase activity in hat1Δ/Δ cells. Catalase activity was determined in whole cell extracts isolated from cells before and after H2O2 treatment. Data are shown as mean + SD from three independent experiments. (B) Loss of Hat1 leads to increased glutathione peroxidase activity. GPx activity was determined in whole cell extracts isolated from cells before and after H2O2 treatment. Data are shown as mean + SD from two independent experiments. (C) Lack of CAT1 does not abolish Hat1-mediated H2O2 resistance. Cells of the indicated strains were treated with 1 mM H2O2 for 2 hours, plated and colonies counted after 3 days of incubation on YPD plates at 30°C to determine viability. Data are shown as mean + SD from three independent experiments. (D) Depletion of glutathione biosynthesis abolishes Hat1-mediated H2O2 resistance. Cells of the indicated strains were treated with H2O2 for 2 hours and plated on YPD plates containing glutathione. Colonies were counted to determine viability after growth for 3 days at 30°C. Data are shown as mean + SD from three independent experiments. (A-D) n.s.: not significant, *P<0.05, **P<0.01 and ***P<0.001 relative to the corresponding control (Student's t-test).
Fig 8
Fig 8. Higher ROS detoxification capacity of hat1Δ/Δ cells causes resistance to neutrophil killing.
(A) Superoxide dismutases Sod4 and Sod5 are induced in hat1Δ/Δ cells. Expression levels of SOD4 and SOD5 in logarithmically growing cells were detected by RT-qPCR. Transcript levels were normalized to the expression level of the reference gene (RG) RIP1. Data are shown as mean + SD from 3 independent experiments. (B) Infection of macrophages with hat1Δ/Δ cells causes reduced ROS accumulation. ROS levels were determined by measuring luminol-dependent chemiluminescence [relative luciferase units (RLU) min-1 per 1000 immune cells] in 2.5 min intervals during interaction of the indicated C. albicans strains with bone marrow-derived murine macrophages (BMDMs). One representative experiment is shown. Data were reproduced in three independent experiments. (C) Quantification of total ROS release upon interaction with BMDMs. Experiment was performed as described in (B). The area under the curve within 90 min of interaction was calculated. Data are shown as mean + SD from three independent experiments. (D) Cells lacking Hat1 show increased survival to neutrophil killing. Survival of C. albicans cells upon one hour interaction with murine bone marrow neutrophils was determined by plating and CFU counting. Data are shown as mean + SD from three independent experiments. (A-D) *P<0.05, **P<0.01 relative to the wild-type (Student's t-test).
Fig 9
Fig 9. Cells lacking Hat1 show reduced virulence but persist in mouse kidneys.
(A) Reduced growth rate of the hat1Δ/Δ strain was determined by measuring the OD600 of cells growing in YPD at 30°C. (B) Cells lacking Hat1 are not cleared efficiently from kidneys. At the indicated time points, fungal burdens in kidneys of mice infected with C. albicans strains were determined and expressed as CFUs per gram kidney. Groups of 5–10 mice were analyzed at each time point and statistical significance was determined using the non-parametric Mann-Whitney-test. n.s.: not significant, *P<0.05 and **P<0.01 relative to the corresponding wild-type. (C) hat1Δ/Δ cells are defective in killing the host. Survival of mice infected with the indicated strains was monitored over 32 days post infection (p.i.). The data are presented as Kaplan-Meier survival curves. Groups of 6 mice were infected per C. albicans strain. Statistical significance was determined using the Log-rank test. ns: not significant; (D) Fungal burdens in kidneys of surviving mice from panel C were determined and expressed as CFUs per gram organ. One mouse infected with the hat1Δ/Δ strain was able to clear Candida. (E) The cac2Δ/Δ strain is not cleared efficiently from kidneys. Experiment was performed as described in (B). Groups of 4–5 mice were analyzed at each time point. (F) Infection with hat1Δ/Δ cells causes reduced kidney damage. Urea levels were determined in sera of infected mice at day 3 and 7 post infection. n.s.: not significant, *P<0.05, **P<0.01 relative to the wild-type (Student's t-test).

Similar articles

Cited by

References

    1. Luger K, Mäder AW, Richmond RK, Sargent DF, Richmond TJ (1997) Crystal structure of the nucleosome core particle at 2.8 A resolution. Nature 389: 251–260. - PubMed
    1. Chen CC, Carson JJ, Feser J, Tamburini B, Zabaronick S, et al. (2008) Acetylated lysine 56 on histone H3 drives chromatin assembly after repair and signals for the completion of repair. Cell 134: 231–243. 10.1016/j.cell.2008.06.035 - DOI - PMC - PubMed
    1. Franco AA, Lam WM, Burgers PM, Kaufman PD (2005) Histone deposition protein Asf1 maintains DNA replisome integrity and interacts with replication factor C. Genes Dev 19: 1365–1375. - PMC - PubMed
    1. Kaplan CD, Laprade L, Winston F (2003) Transcription elongation factors repress transcription initiation from cryptic sites. Science 301: 1096–1099. - PubMed
    1. Saunders A, Werner J, Andrulis ED, Nakayama T, Hirose S, et al. (2003) Tracking FACT and the RNA polymerase II elongation complex through chromatin in vivo . Science 301: 1094–1096. - PubMed

Publication types

Substances