. 2016 Jan 15;5(1):53-64.
doi: 10.1021/acssynbio.5b00119. Epub 2015 Oct 30.

Correlating in Vitro and in Vivo Activities of Light-Inducible Dimers: A Cellular Optogenetics Guide

Affiliations

Correlating in Vitro and in Vivo Activities of Light-Inducible Dimers: A Cellular Optogenetics Guide

Ryan A Hallett et al. ACS Synth Biol. .

Abstract

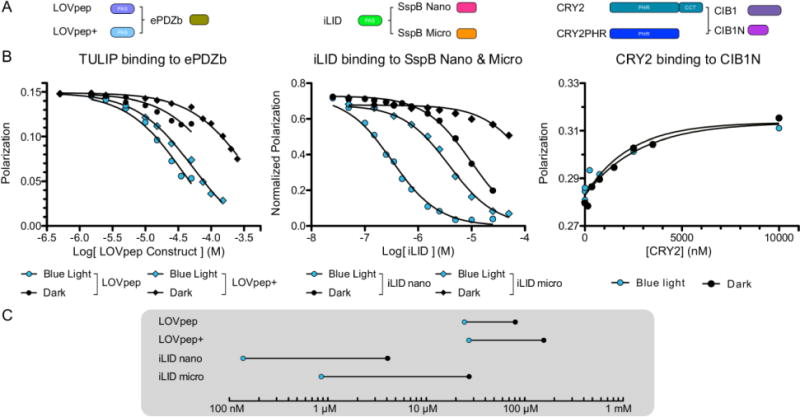
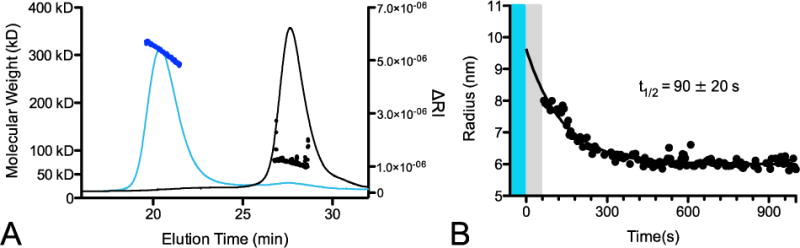
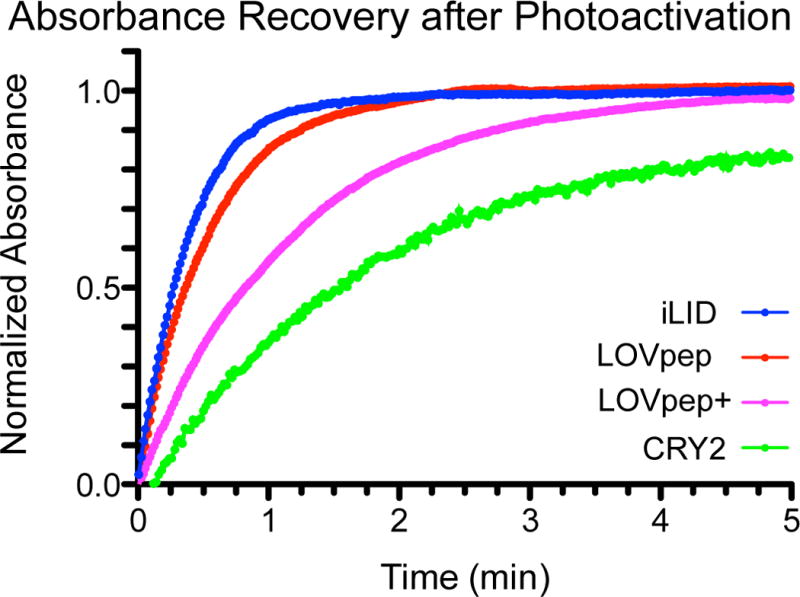
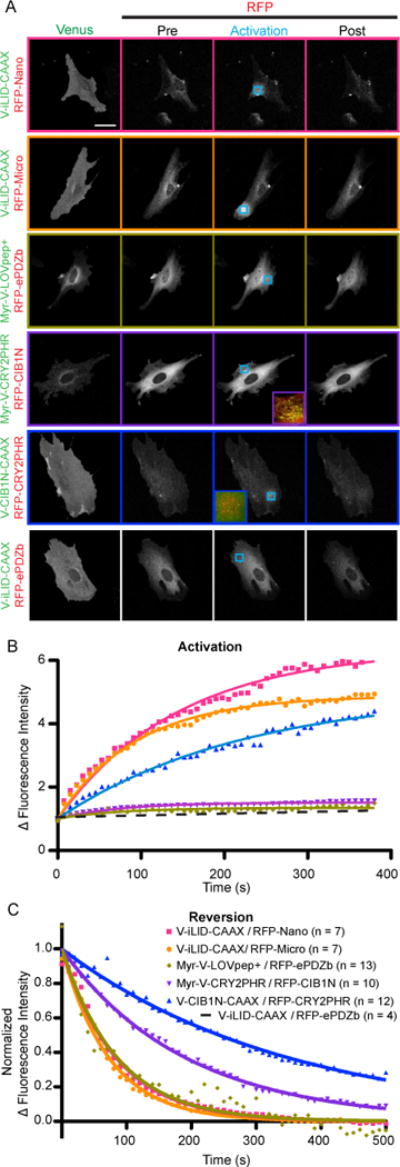
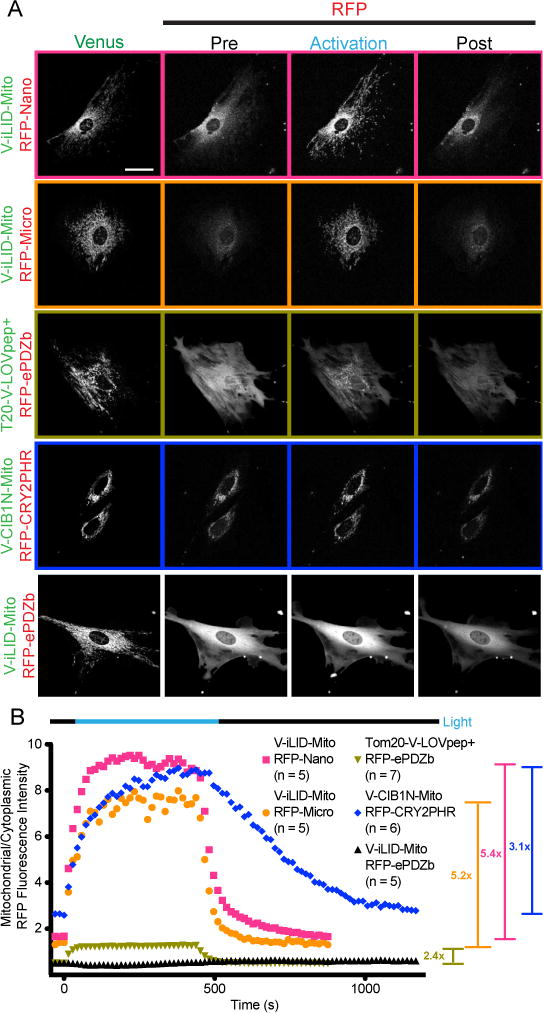
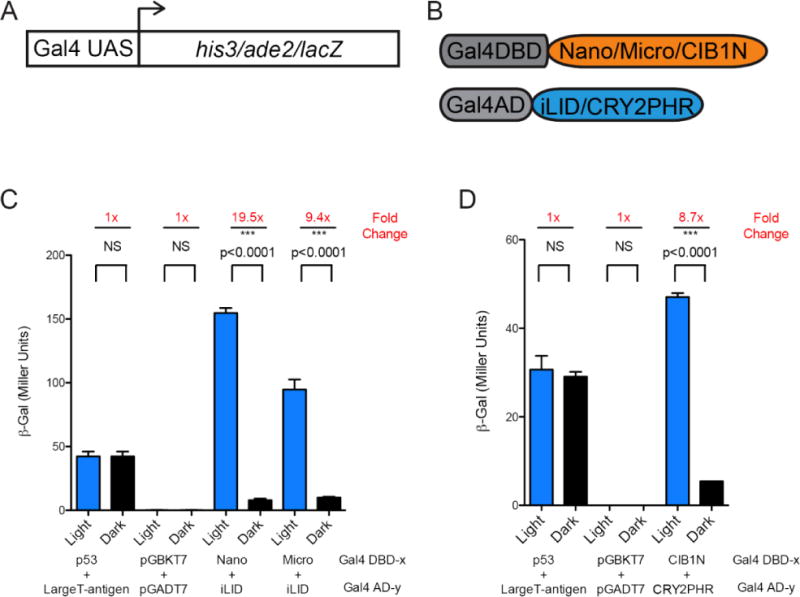
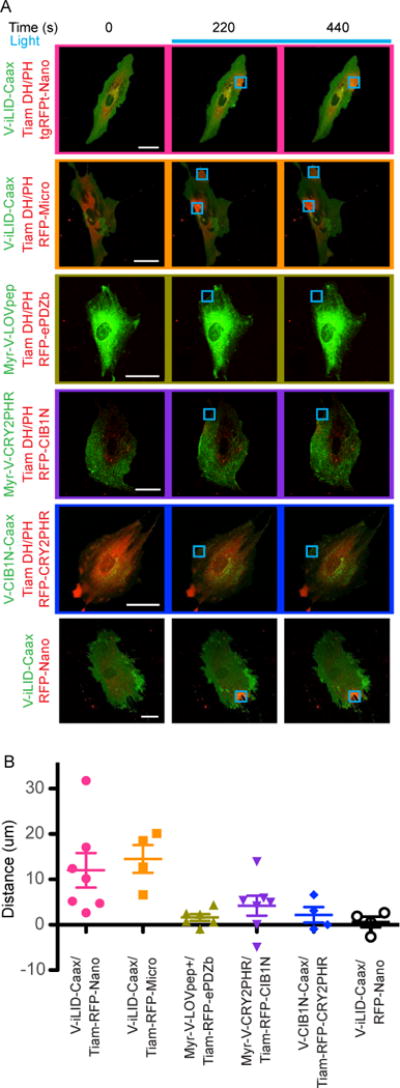
Light-inducible dimers are powerful tools for cellular optogenetics, as they can be used to control the localization and activity of proteins with high spatial and temporal resolution. Despite the generality of the approach, application of light-inducible dimers is not always straightforward, as it is frequently necessary to test alternative dimer systems and fusion strategies before the desired biological activity is achieved. This process is further hindered by an incomplete understanding of the biophysical/biochemical mechanisms by which available dimers behave and how this correlates to in vivo function. To better inform the engineering process, we examined the biophysical and biochemical properties of three blue-light-inducible dimer variants (cryptochrome2 (CRY2)/CIB1, iLID/SspB, and LOVpep/ePDZb) and correlated these characteristics to in vivo colocalization and functional assays. We find that the switches vary dramatically in their dark and lit state binding affinities and that these affinities correlate with activity changes in a variety of in vivo assays, including transcription control, intracellular localization studies, and control of GTPase signaling. Additionally, for CRY2, we observe that light-induced changes in homo-oligomerization can have significant effects on activity that are sensitive to alternative fusion strategies.

Keywords: TULIP; cell signaling; cryptochrome2 (CRY2); dimerization; iLID; optogenetics.


Figures

FIGURE 1
FIGURE 1. Binding affinities of lit and dark states highlight difference in photoswitch dynamic range
Fluorescence polarization binding plots for A) LOVpep constructs and ePDZb (left) iLID nano and micro (middle) and CRY2 and CIB1N (right). B) Fluorescence polarization of each complex was measured under blue light (blue) or darkness (black) to determine binding affinity. C) Affinity values from binding data plotted on a Dynagram highlight the dynamic range of each tool.
FIGURE 2
FIGURE 2. Light induces CRY2 oligomerization
A) Size exclusion chromatography multi-angle light scattering traces for full length CRY2 run under blue light (blue line) or darkness (black line). Fit molecular weight from MALS data for each peak is shown for lit (blue dots) and dark (black dots) peaks. B) Reversion of light induced oligomer to monomer by dynamic light scattering. Blue bar represents blue light irradiation of sample; grey bar represents instrument dead time before initial measurement
FIGURE 3
FIGURE 3. Photoreceptor reversion kinetics
Thermal reversion kinetics of the excited state for each photoreceptor show differences in timescale of deactivation. Reversions were measured at room temperature in Tris-HCl buffer.
FIGURE 4
FIGURE 4. Targeted localization to the plasma membrane shows differences in switch dynamic range and kinetics
A) Representative images of the data analyzed in B and C. Cells transfected with each membrane bound switch pair were visualized and activated by confocal microscopy. Venus labeled constructs are bound to the plasma membrane while tgRFPt labeled constructs are cytoplasmic. The activated ROI is identified by the blue arrow. The activation and post activation images represent the final image of the specified time frame. (Bar = 50 μm) B) A ratio of tgRFPt fluorescence intensity inside the activated ROI to outside the activated ROI during the period of activation as shown in A. C) A normalized ratio of tgRFPt fluorescence intensity inside the activated ROI to outside the activated ROI during the period of activation as shown in A.
FIGURE 5
FIGURE 5. Targeted mitochondrial localization identifies differences in dark state binding dynamic range and kinetics
A) Representative images of the data analyzed in B. Cells transfected with each mitochondrial bound switch pair were visualized and activated by confocal microscopy. Venus labeled constructs are bound to the plasma membrane while tgRFPt labeled constructs are cytoplasmic. The entire field of view is activated. The activation and post activation images represent the final image of the specified time frame. (Bar = 50 μm) B) A ratio of mitochondrial to cytoplasmic tgRFPt fluorescence intensity throughout the experiments shown in A.
FIGURE 6
FIGURE 6. Yeast two hybrid transcription comparison
A) A schematic of the genome reporters. B) A schematic of the constructs tested. C) ß-galactose transcription induced with the iLID paired with Nano or the Micro (n = 9 each, mean reported ± SEM and statistical significance is calculated with unpaired two-tailed t-student’s test (p<0.0001)) and D) CIB1N with CRY2PHR (n = 3 each, mean reported ± SEM and statistical significance is calculated with unpaired two-tailed t-student’s test (p<0.0001)) (Blue Bars – growth under continuous blue light at 465nm, Black Bars – growth in the dark).
FIGURE 7
FIGURE 7. Targeting Tiam DH/PH domains to the plasma membrane with each switch causes varying degrees of protrusion
A) Representative images of the data analyzed in B. Cells transfected with each membrane bound Tiam DH/PH switch pair were visualized and activated by confocal microscopy. Venus labeled constructs are bound to the plasma membrane while tgRFPt labeled constructs are cytoplasmic. The activated ROI is is represented by the blue square. (Bar = 50 μm) B) Protrusion distances for each cell were measured by kymography.

References

    1. Boyden ES, Zhang F, Bamberg E, Nagel G, Deisseroth K. Millisecond-timescale, genetically targeted optical control of neural activity. Nat Neurosci. 2005;8:1263–8. - PubMed
    1. Nagel G, Szellas T, Huhn W, Kateriya S, Adeishvili N, Berthold P, Ollig D, Hegemann P, Bamberg E. Channelrhodopsin-2, a directly light-gated cation-selective membrane channel. Proc Natl Acad Sci U S A. 2003;100:13940–5. - PMC - PubMed
    1. Shimizu-Sato S, Huq E, Tepperman JM, Quail PH. A light-switchable gene promoter system. Nat Biotechnol. 2002;20:1041–4. - PubMed
    1. Levskaya A, Weiner OD, Lim WA, Voigt CA. Spatiotemporal control of cell signalling using a light-switchable protein interaction. Nature. 2009;461:997–1001. - PMC - PubMed
    1. Wu YI, Frey D, Lungu OI, Jaehrig A, Schlichting I, Kuhlman B, Hahn KM. A genetically encoded photoactivatable Rac controls the motility of living cells. Nature. 2009;461:104–108. - PMC - PubMed

Publication types