. 2015 Oct 15;60(2):220-30.
doi: 10.1016/j.molcel.2015.09.017.

RNA Controls PolyQ Protein Phase Transitions

Affiliations

RNA Controls PolyQ Protein Phase Transitions

Huaiying Zhang et al. Mol Cell. .

Abstract

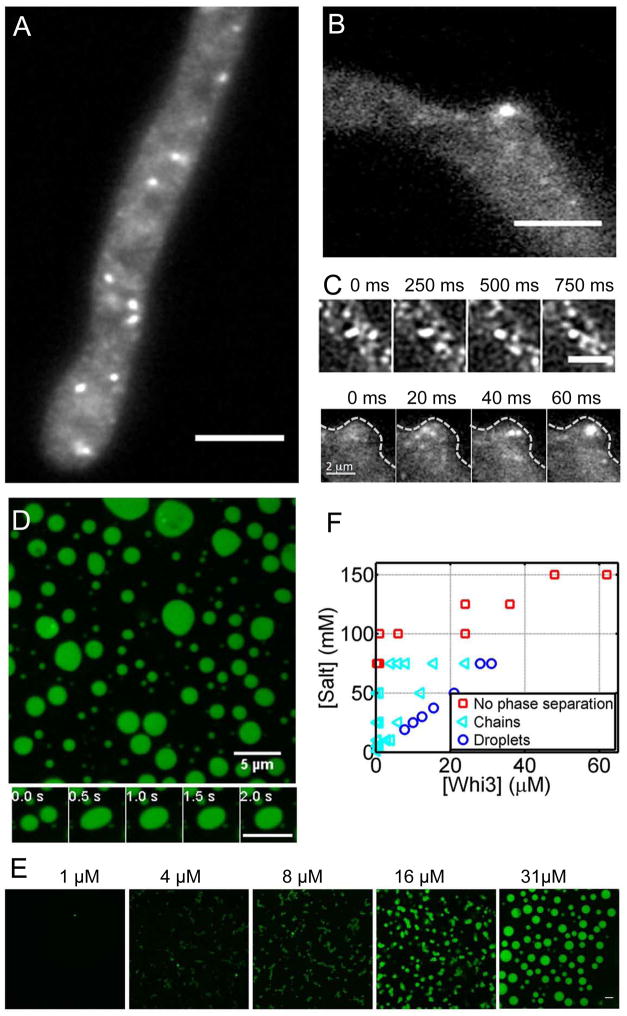
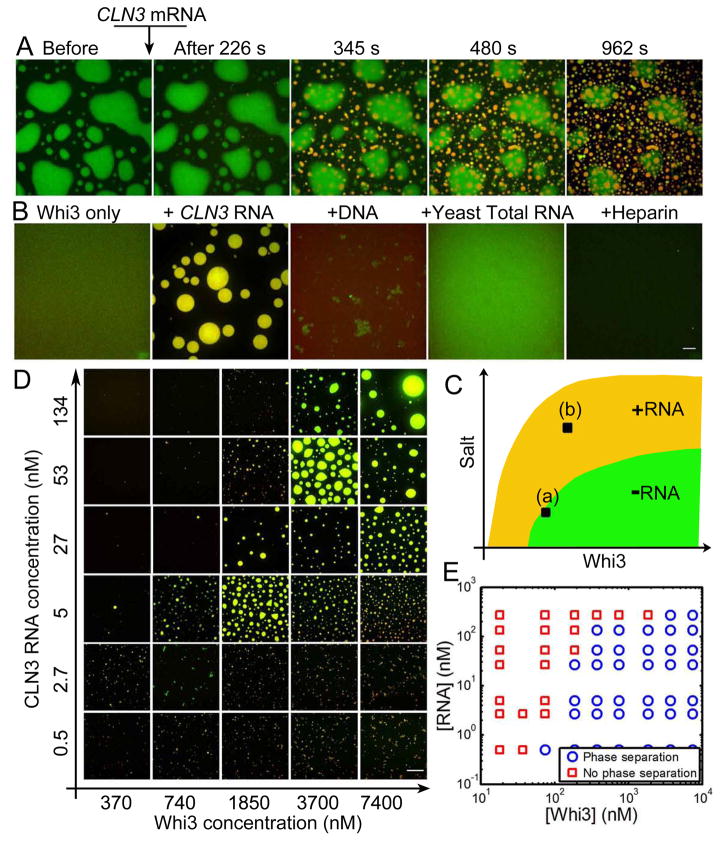
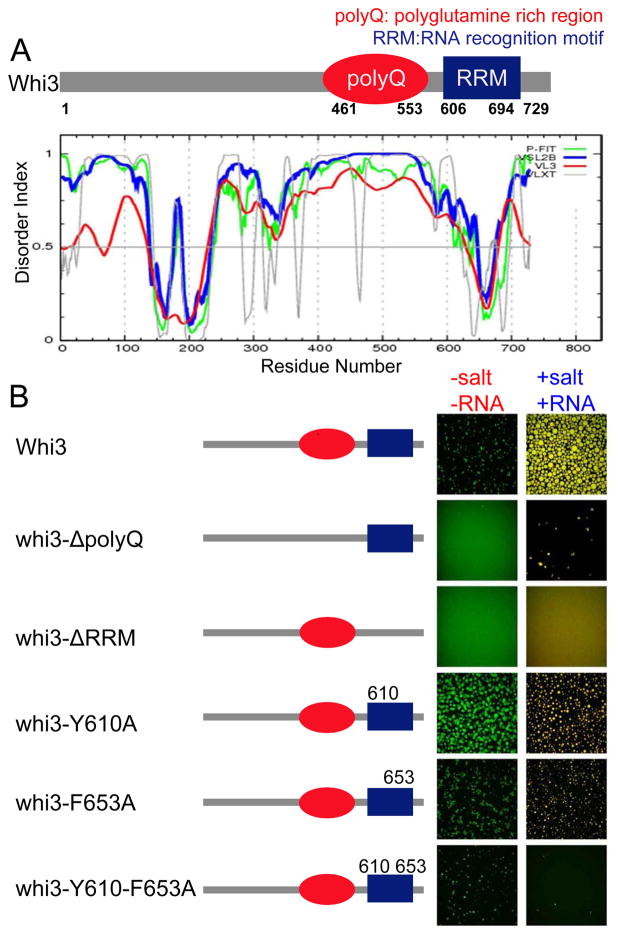
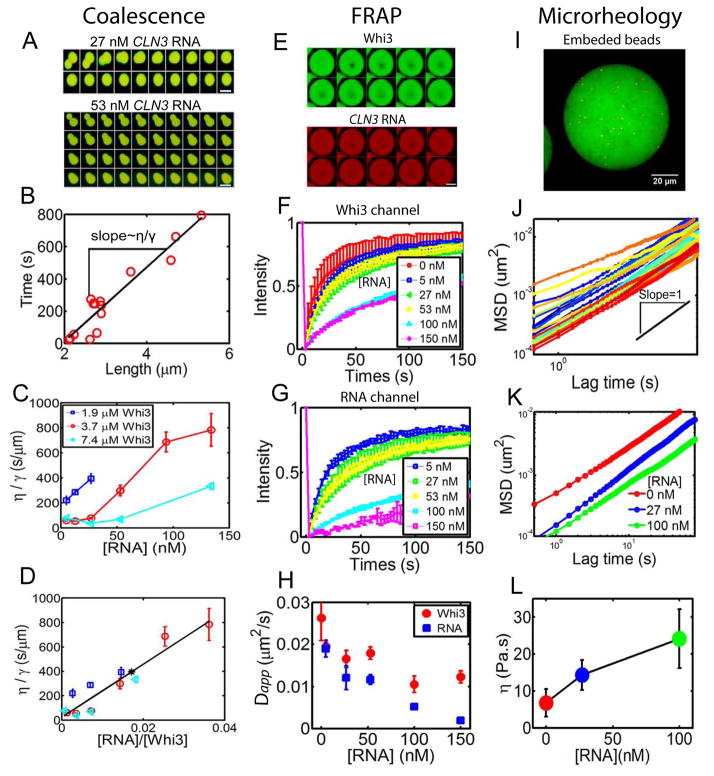
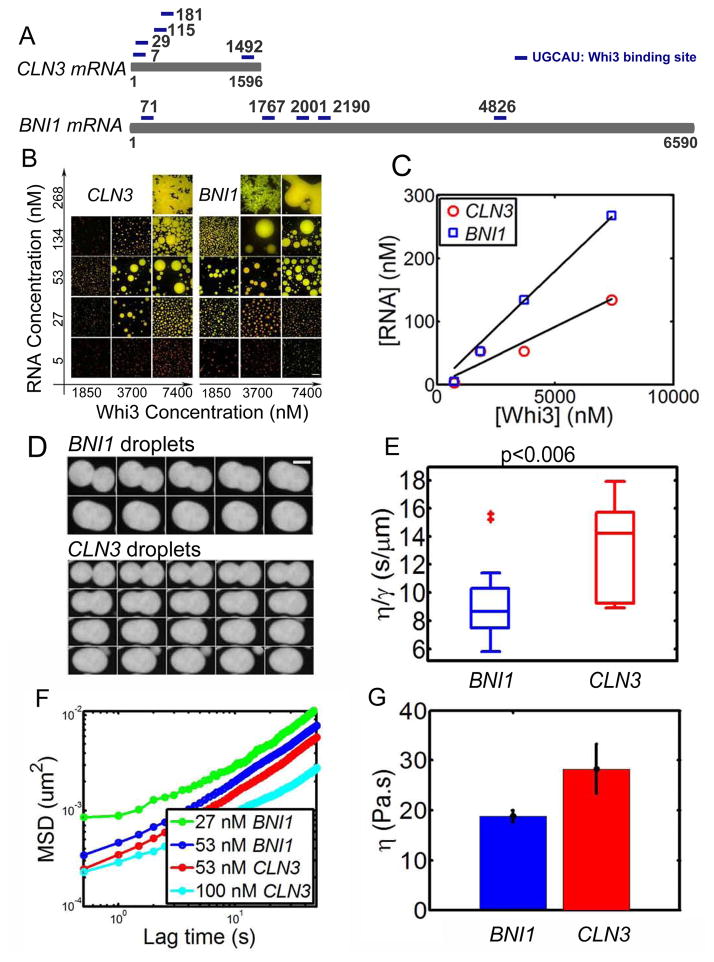
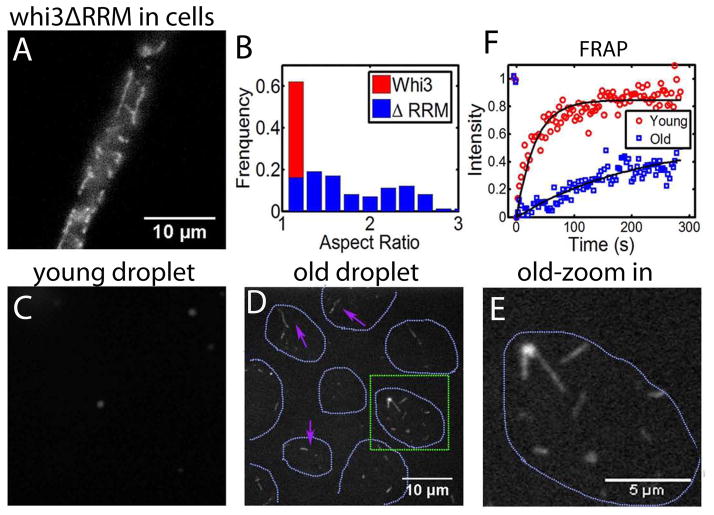
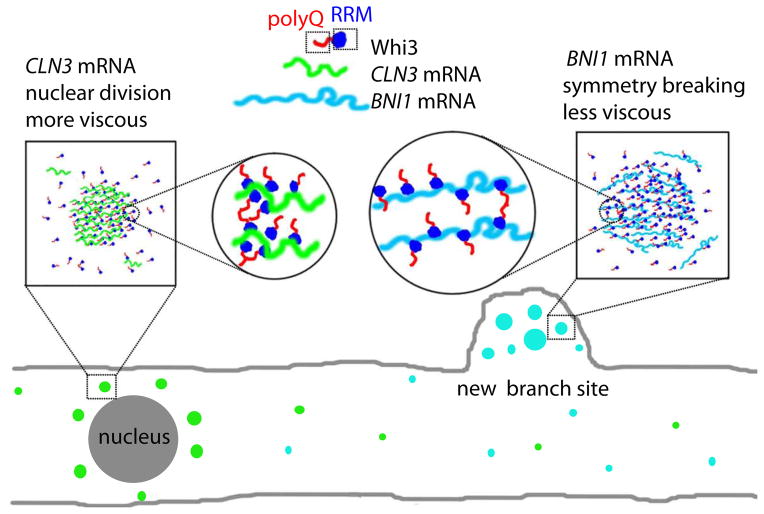
Compartmentalization in cells is central to the spatial and temporal control of biochemistry. In addition to membrane-bound organelles, membrane-less compartments form partitions in cells. Increasing evidence suggests that these compartments assemble through liquid-liquid phase separation. However, the spatiotemporal control of their assembly, and how they maintain distinct functional and physical identities, is poorly understood. We have previously shown an RNA-binding protein with a polyQ-expansion called Whi3 is essential for the spatial patterning of cyclin and formin transcripts in cytosol. Here, we show that specific mRNAs that are known physiological targets of Whi3 drive phase separation. mRNA can alter the viscosity of droplets, their propensity to fuse, and the exchange rates of components with bulk solution. Different mRNAs impart distinct biophysical properties of droplets, indicating mRNA can bring individuality to assemblies. Our findings suggest that mRNAs can encode not only genetic information but also the biophysical properties of phase-separated compartments.


Figures

Figure 1
Figure 1. Whi3 phase separates in vivo and in vitro
(A) Whi3 forms liquid-like assemblies in Ashbya cells. Scale bar is 5 μm. (B) Whi3 assemblies at a branch site. Scale bar is 5 μm. (C) Fusion events in cells. Top panel shows a fusion event in cytosol. Scale bar is 2 μm. Bottom panel shows a fusion event at a branch site indicated by dashed line. (D) Recombinant Whi3 (28 μM) forms liquid droplets at 75mM salt. Bottom panel highlights a fusion event. Scale bar is 5 μm. (E) Whi3 forms distinct small round assemblies that are attached to each other at low protein concentration, and forms round droplets at high protein concentration. Images were taken after overnight incubation at room temperature. Scale bar is 5 μm. (F) Whi3 phase diagram with varying salt concentrations. Also see Fig S1 and Movie 1, 2, and 3.
Figure 2
Figure 2. CLN3 RNA promotes Whi3 phase separation in physiological conditions
(A) Addition of 53 nM CLN3 mRNA (cy3-labled, red) to phase-separated Whi3 (10%GFP labeled, green) at 60 mM salt. (B) 3.7 μM Whi3 at 150 mM salt is not phase separated, adding 53 nM CLN3 RNA promotes liquid-liquid demixing, resulting in condensed droplets consist with both RNA (red) and protein (green). Adding DNA, total yeast RNA or Heparin that are normalized to 53 nM CLN3 RNA by charge does not promote droplet formation. Some aggregates are formed with DNA. Scale bar is 10 μm. (C) Schematics showing RNA shifts Whi3 phase boundary. (D) Images of droplets formed at various CLN3 mRNA and Whi3 concentration at 150 mM salt. Images were taken overnight after mixing Whi3 and CLN3 mRNA. Scale bar is 20 μm. (E) Phase diagram of Whi3 and CLN3 mRNA at 150 mM salt. See also Fig S2, S3, movie 4.
Figure 3
Figure 3. RNA binding through RRM domain is critical for Whi3 phase separation
(A) Schematics of Whi3 protein with a polyQ domain and an RNA recognition motif. Whi3 is predicted to be disordered in the polyQ region. (B) Schematics illustrate the mutated Whi3 constructs. In the no-RNA experiment (left column of images), salt concentration was lowered from 150mM to 75mM by adding buffer with no salt, final protein concentration was 5μM of Whi3 and for fragments and mutants the highest protein concentration each construct could be purified was used: 25 μM of whi3ΔpolyQ, 39μM of whi3-Y610A, 23 μM of whi3-F653A, 11 μM whi3-Y610-F653A, 23 μM Whi3ΔRRM. In the CLN3 mRNA experiment (right column of images), 7.4 μM protein at 150mM salt was used for all mutants and 53 nM CLN3 mRNA was added. All images were taken after 4 hours of either adding no-salt buffer or mRNA.
Figure 4
Figure 4. CLN3 RNA influence Whi3 droplet physical properties
(A) Montages show a fast fusion event with low RNA concentration (27 nM) and a slow fusion event with high RNA concentration (53 nM) for 3.7 μM Whi3 at 150 mM salt. Time interval between images is 50 seconds and scale bar is 5 μm. (B) An example plotting characteristic fusion length when two droplets initially meet against the fusion relaxation time (circles) yields a linear relation, with the slope scales with the ratio of viscosity over surface tension η/γ. (C) Viscosity over surface tension ratio (η/γ) obtained from fusion events plotted against RNA concentration for various Whi3 concentrations. Mean±SEM (D) η/γ scales roughly with RNA to Whi3 molar ratio. Mean±SEM. Black line is a linear fit. Black asterisk on line corresponds to the ratio that gives the largest apparent droplet volume from Fig. S3 that’s based on Fig. 2D. (E) FRAP images show recovery of CLN3 RNA and Whi3. Scale bar is 5 μm. Time interval is 20 seconds. (F) Normalized FRAP curves in Whi3 channel show slower recovery as RNA concentration increases in droplets with 25 μM Whi3 at 60mM salt. Mean±STD. (G) Normalized FRAP curves in RNA channel also show slower recovery as RNA concentration increases. Mean±STD. (H) Decrease in apparent diffusion coefficients with increasing RNA concentration estimated from FRAP data. Mean±STD. (I) An example of fluorescent tracer beads (red) embedded in Whi3 droplets (green). RNA not labeled. (J) An example of MSD for tracer beads in droplets. Black line shows slope=1. (K) Mean MSD with varying RNA concentration in droplets with 25 μM Whi3 at 60mM salt. (L) Viscosity calculated from MSD data. Mean±STD. See also Fig S4.
Figure 5
Figure 5. BNI1 mRNA drives Whi3 phase separate into droplets with different properties
(A) Schematics show CLN3 mRNA and BNI1 mRNA, each with five Whi3 binding sites. (B) Whi3 (green) phase diagram with BNI1 mRNA (red) and CLN3 RNA (red), images were taken after 4 hours of mixing Whi3 with RNA at 150 mM salt. Scale bar is 20 μm. (C) RNA concentration at which the largest apparent droplet volume is observed in B for each Whi3 concentration. The optimal RNA/Whi3 molar ratio estimated from linear fit (black line) for CLN3 is ~0.02 (similar to that obtained from overnight droplets for CLN3 in Fig. S3) and BNI1 is ~0.04. (D) Example of fusion images for 50 nM CLN3 and BNI1 RNA with 9 μM Whi3 at150 mM salt shows a faster fusion rate for BNI1. Time interval between images is 10 second. Scale bar is 5 μm. (E) Box plot of viscosity to surface tension ratio (η/γ) for CLN3 and BNI1 droplets obtained from fusion events. (F) Mean MSD from microrheology for CLN3 and BNI1 with 8 μM Whi3 at 150 mM salt, showing faster movement of tracer beads for less RNA both for BNI1 and CLN3 droplets. (G) Viscosity of 53 nM BNI1 and CLN3 droplets obtained from MSD data, showing BNI1 droplets are less viscous. Mean±SEM.
Figure 6
Figure 6. Maturation of droplets over time
(A) Whi3 structure after deleting RNA binding domain (Whi3ΔRRM) in Ashbya cells. (B) Aspect ratio of Whi3ΔRRM in comparison with wide type Whi3 in Ashbya cells. (C) Adding high salt (2M) to young droplets (1h) disrupted droplets. Salt concentration increased from 150 mM to 300 mM. Droplets were formed with 8 μM full length Whi3 and 200 nM RNA. (D) Adding high salt (2M) to old droplets (≥7h) disrupted droplets but fibers were left. Magenta arrows point at fibers. Green square highlights the region that is zoomed in and shown in (E). Cyan dotted line indicates where droplets were before adding salt. Droplets were formed with 8 μM full length Whi3 and 200 nM RNA. (F) FRAP shows slower Whi3 recovery in old droplets than in young droplets. See also Fig S5.
Figure 7
Figure 7. RNAs control protein phase separation to pattern cytosol in Ashbya
Model for linking biophysical properties of droplets to differences in cell function. We hypothesize that more viscous Whi3 droplets formed with CLN3 mRNA are adjacent to nuclei for controlling nuclear division timing and less viscous Whi3 droplets formed with BNI1 mRNA are at new branch sites or growth tips to establish polarity sites.

References

    1. Anderson P, Kedersha N. RNA granules. The Journal of Cell Biology. 2006;172:803–808. - PMC - PubMed
    1. Berry J, Weber SC, Vaidya N, Haataja M, Brangwynne CP. RNA transcription modulates phase transition-driven nuclear body assembly. P Natl Acad Sci USA. 2015 In press. - PMC - PubMed
    1. Brangwynne CP, Eckmann CR, Courson DS, Rybarska A, Hoege C, Gharakhani J, Julicher F, Hyman AA. Germline P granules are liquid droplets that localize by controlled dissolution/condensation. Science. 2009;324:1729–1732. - PubMed
    1. Brangwynne CP, Mitchison TJ, Hyman AA. Active liquid-like behavior of nucleoli determines their size and shape in Xenopus laevis oocytes. P Natl Acad Sci USA. 2011;108:4334–4339. - PMC - PubMed
    1. Caudron F, Barral Y. A super-assembly of Whi3 encodes memory of deceptive encounters by single cells during yeast courtship. Cell. 2013;155:1244–1257. - PubMed

Publication types

MeSH terms