. 2016 Sep;84 Suppl 1(Suppl 1):131-44.
doi: 10.1002/prot.24943. Epub 2015 Nov 17.

New encouraging developments in contact prediction: Assessment of the CASP11 results

Affiliations

New encouraging developments in contact prediction: Assessment of the CASP11 results

Bohdan Monastyrskyy et al. Proteins. 2016 Sep.

Abstract

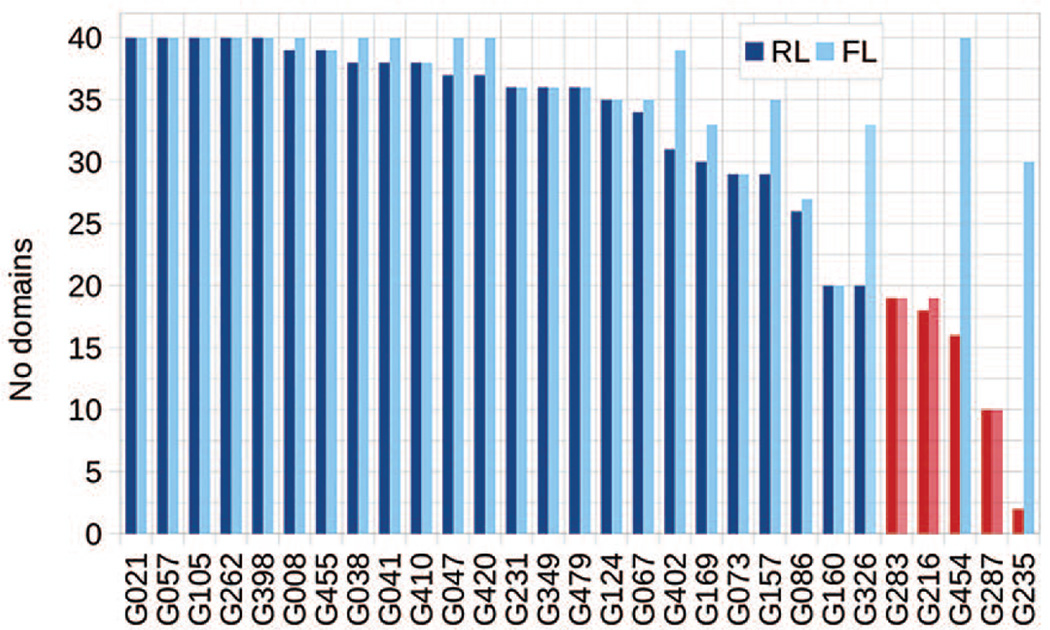
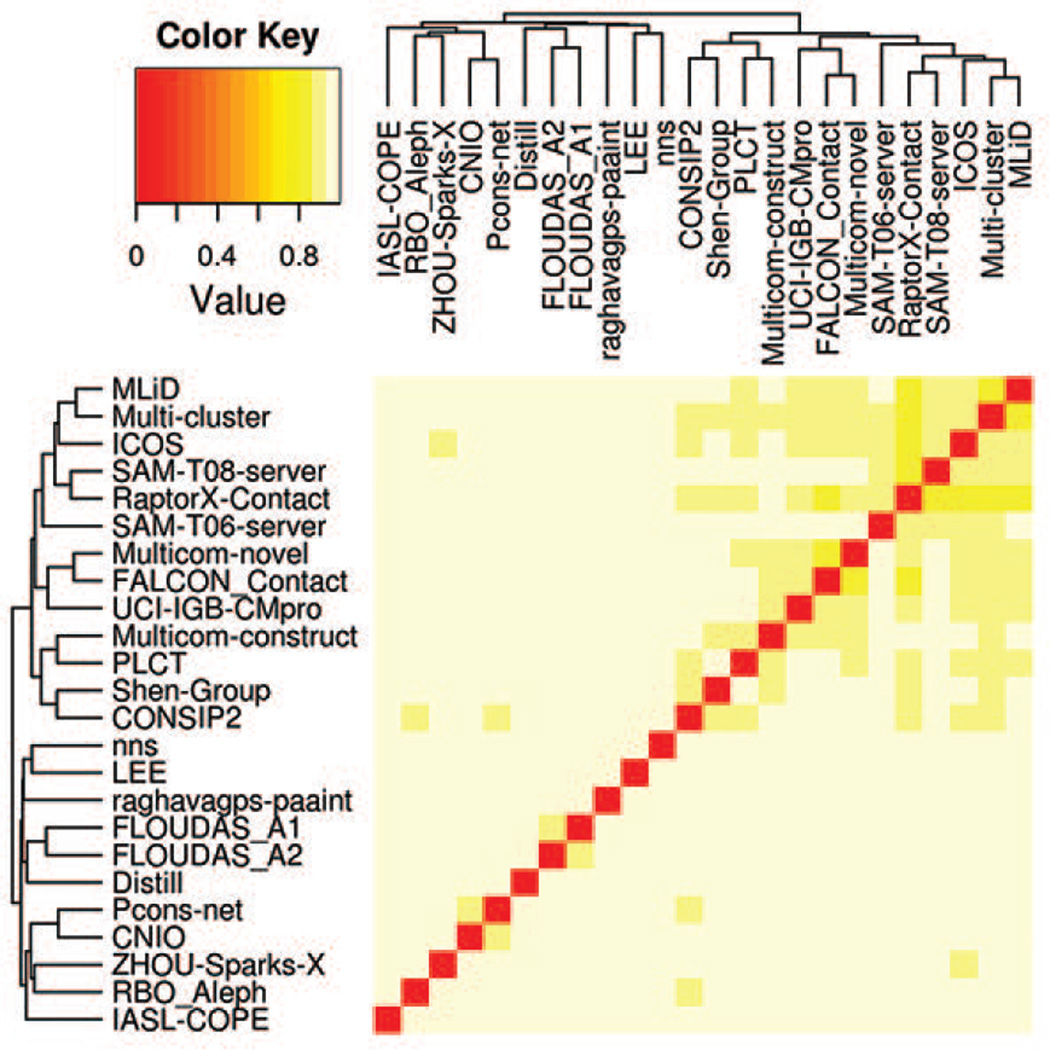
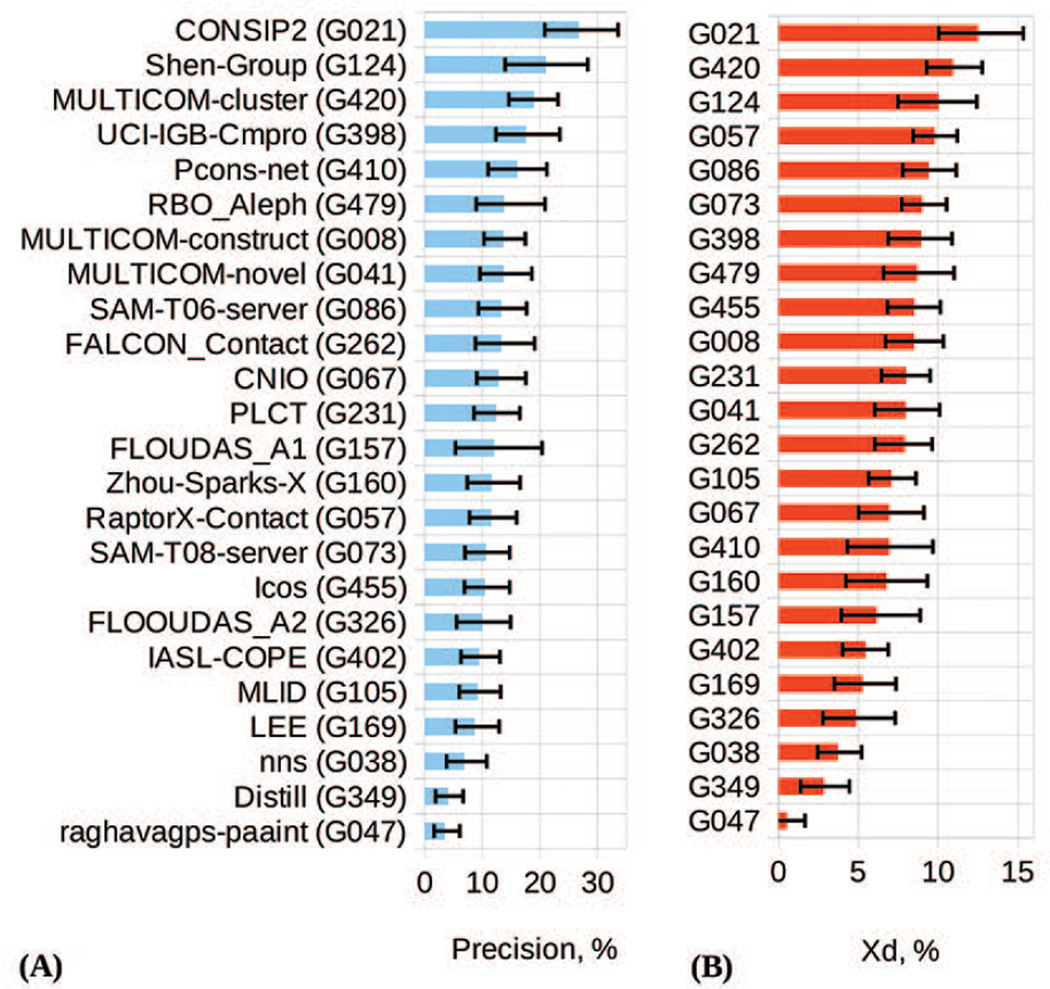
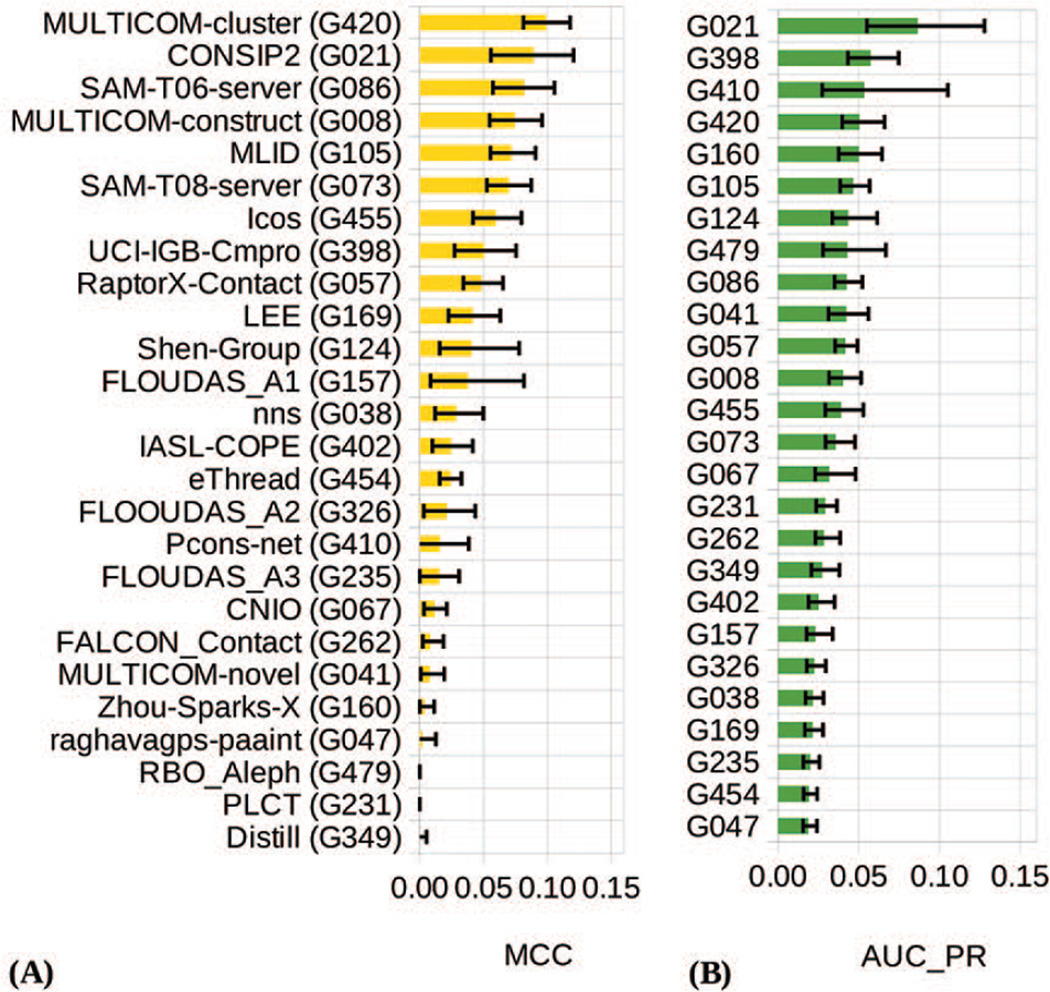
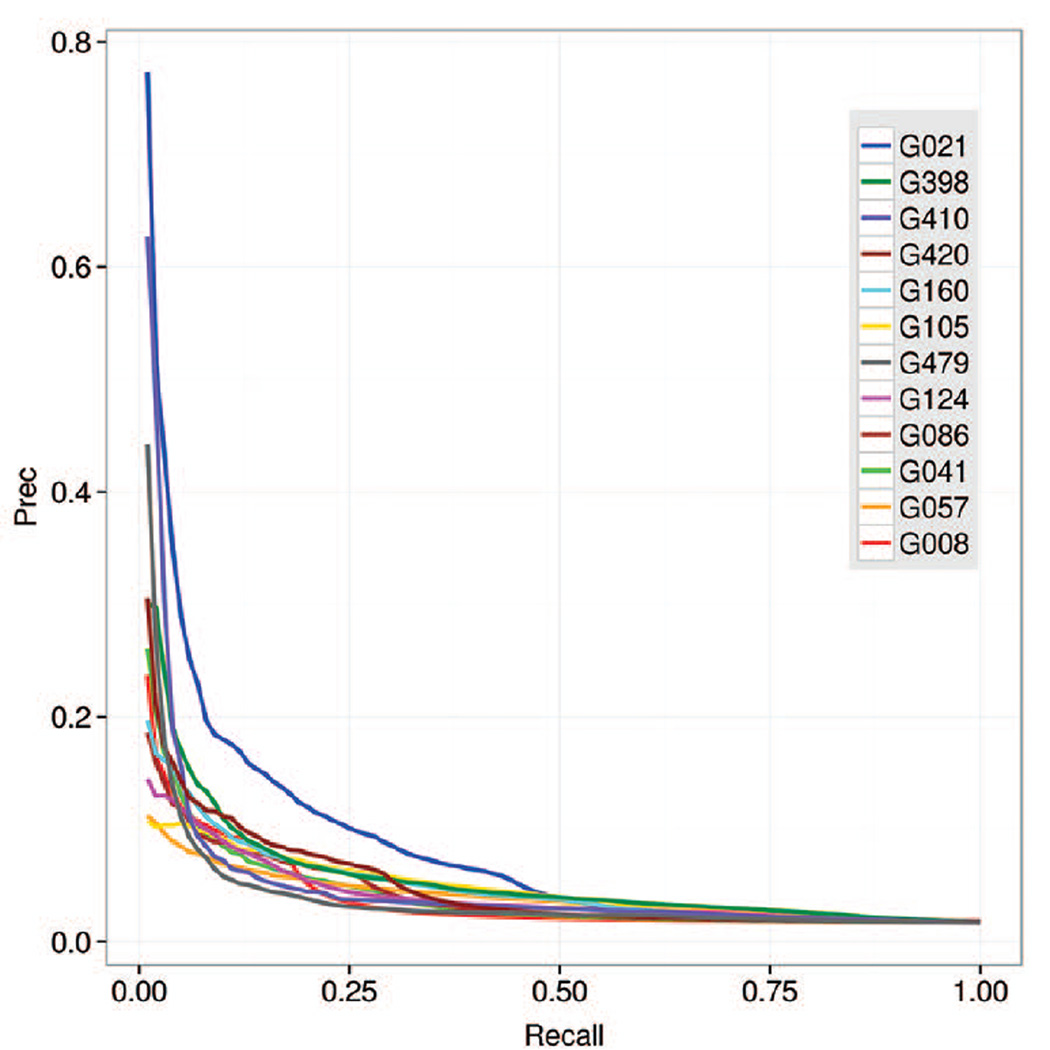
This article provides a report on the state-of-the-art in the prediction of intra-molecular residue-residue contacts in proteins based on the assessment of the predictions submitted to the CASP11 experiment. The assessment emphasis is placed on the accuracy in predicting long-range contacts. Twenty-nine groups participated in contact prediction in CASP11. At least eight of them used the recently developed evolutionary coupling techniques, with the top group (CONSIP2) reaching precision of 27% on target proteins that could not be modeled by homology. This result indicates a breakthrough in the development of methods based on the correlated mutation approach. Successful prediction of contacts was shown to be practically helpful in modeling three-dimensional structures; in particular target T0806 was modeled exceedingly well with accuracy not yet seen for ab initio targets of this size (>250 residues). Proteins 2016; 84(Suppl 1):131-144. © 2015 Wiley Periodicals, Inc.

Keywords: CASP; co-variation; contact prediction; correlated mutations; evolutionary coupling.


Figures

Figure 1
Figure 1
The number of FM domains per group for which the L/5 lists (darker color) and full lists (lighter color) of long-range contacts were evaluated. Several groups (G235, G287, G454, G216 and G283 in the RL mode; G287, G216 and G283 in the FL mode – marked red) submitted too few qualified predictions and were not included in the subsequent analyses. The correspondence between groups’ CASP IDs (Gxxx in the graph’s x-axis) and their names can be obtained from http://predictioncenter.org/casp11/docs.cgi?view=groupsbyname.
Figure 2
Figure 2
A color-coded dissimilarity matrix and a dendrogram illustrating the similarity among different methods as judged by the number of common predicted contacts for all targets. The J-scores used in the matrix are calculated on the union of the predicted top L/5 long-range contacts for each pair of groups.
Figure 3
Figure 3
Precision (panel A) and Xd score (panel B) for the participating groups on the FM domains. The data are shown for the top L/5 long-range contacts (a.k.a. reduced lists). Groups in both panels are ordered according to the decreasing score. The error bars indicate the boundaries of the 95% confidence intervals for each measure.
Figure 4
Figure 4
Matthews’ correlation coefficient (panel A) and area under the precision-recall curve (panel B) for the participating groups on the FM domains. The data are shown for all predicted long-range contacts (a.k.a. full lists). Groups in both panels are ordered according to the decreasing score. The error bars indicate boundaries of the 95% confidence intervals for each measure.
Figure 5
Figure 5
Precision-recall curves for all predicted long-range contacts on FM domains.
Figure 6
Figure 6
A boxplot showing statistics on the submitted probabilities for pairs of residues in contact. Box boundaries correspond to the Q1=25th (bottom) and Q3=75th (top) percentiles in the data; the horizontal line inside the box corresponds to the median (Q2). The height of the box defines the interquartile range (IQR = Q3 − Q1). The height of the whiskers shows the range of the values outside the interquartile range, but within 1.5*IQR. The red dots correspond to outliers, i.e. values outside the 1.5*IQR range. The black horizontal line across the plot shows the cutoff (0.5) separating confidently predicted contacts from the others. It can be seen that some groups submitted only confident contacts (p>0.5), while others likely misinterpreted the format submitting almost all of the contacts with probabilities below 0.5.
Figure 7
Figure 7
Cumulative ranking of CASP11 contact prediction groups according to the sum of z-scores calculated from the distributions of precision, Xd, MCC and AUC_PR scores (see Materials).
Figure 8
Figure 8
Percentage of cases where the first correct (panel A) and first incorrect (panel B) prediction is in the reported position for each group. Rows are ordered according to the percentage in the first column of panel A. The data are shown for the top L/5 long-range contacts in FM domains.
Figure 9
Figure 9
Number of diverse homologous sequences (depth of alignment) for the CASP11 FM targets. The effective number of sequences was calculated with the PSIBlast and HHblits programs on similar databases with similar parameters (provided in the panel).
Figure 10
Figure 10
Precision of the top L/5 long-range contacts as a function of the depth of alignment (# of PSIBLAST hits versus the UNIREF90 database). Each point corresponds to one domain. Data points are shown for the CONSIP2 group and also for two contact predictions from the Baker structure prediction group on targets T0806-D1 and T0824-D1 (not part of the CASP11 contact prediction experiment). Linear trend lines are fitted through the data points for the CONSIP2 group (blue), for the average of the top 12 groups (red, individual values not shown) and for the average of the four evolutionary coupling groups in the top 12 (CONSIP2, Shen-group, Pcons-net and CNIO – orange, individual values not shown).
Figure 11
Figure 11
Comparison of highest precision and Xd scores in CASP9, 10 and 11 (panel A: absolute values; panel B: relative to the reference SAM-T08 method).

Similar articles

Cited by

References

    1. Lesk AM. CASP2: report on ab initio predictions. Proteins. 1997;(Suppl 1):151–166. - PubMed
    1. Orengo CA, Bray JE, Hubbard T, LoConte L, Sillitoe I. Analysis and assessment of ab initio three-dimensional prediction, secondary structure, and contacts prediction. Proteins. 1999;(Suppl 3):149–170. - PubMed
    1. Lesk AM, Lo Conte L, Hubbard TJ. Assessment of novel fold targets in CASP4: predictions of three-dimensional structures, secondary structures, and interresidue contacts. Proteins. 2001;(Suppl 5):98–118. - PubMed
    1. Aloy P, Stark A, Hadley C, Russell RB. Predictions without templates: new folds, secondary structure, and contacts in CASP5. Proteins. 2003;53(Suppl 6):436–456. - PubMed
    1. Grana O, Baker D, MacCallum RM, Meiler J, Punta M, Rost B, Tress ML, Valencia A. CASP6 assessment of contact prediction. Proteins. 2005;61(Suppl 7):214–224. - PubMed

Publication types