. 2015 Nov 3;6(34):36603-14.
doi: 10.18632/oncotarget.5464.

Identification of drugs as single agents or in combination to prevent carcinoma dissemination in a microfluidic 3D environment

Affiliations

Identification of drugs as single agents or in combination to prevent carcinoma dissemination in a microfluidic 3D environment

Jing Bai et al. Oncotarget. .

Abstract

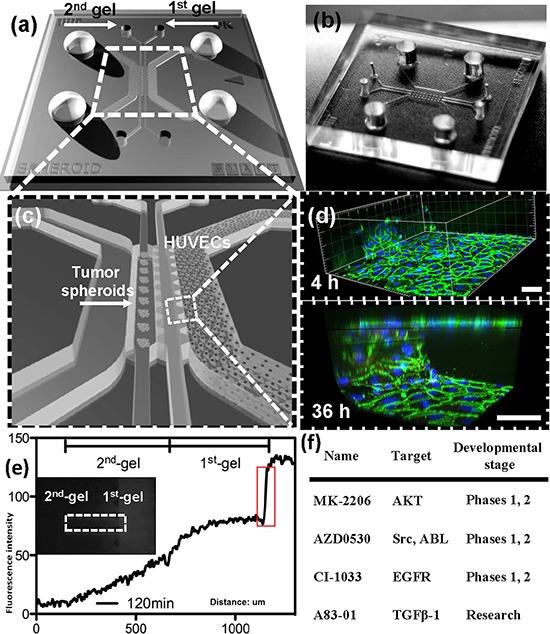
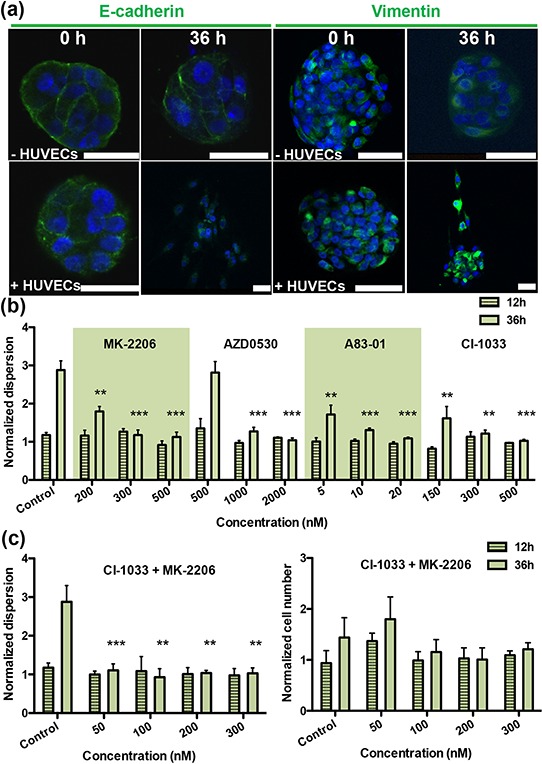
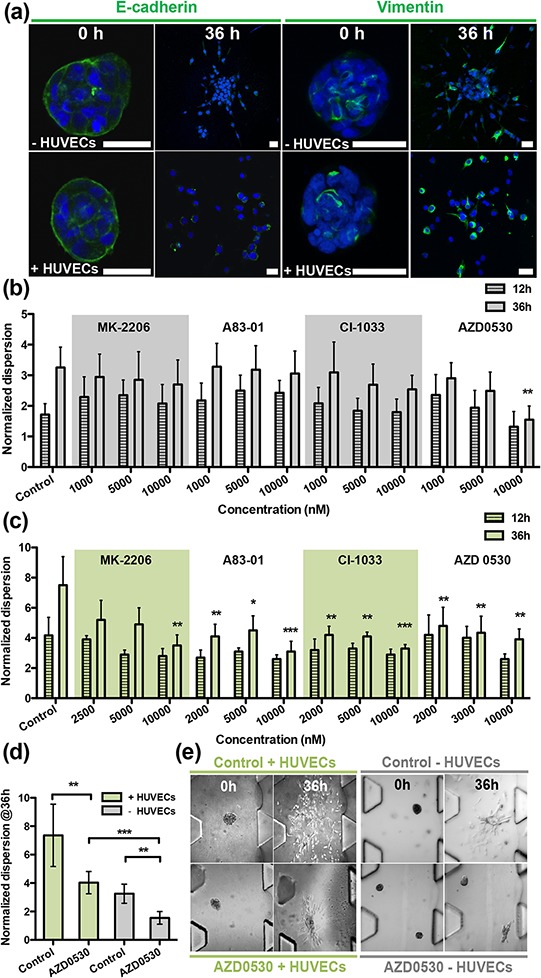
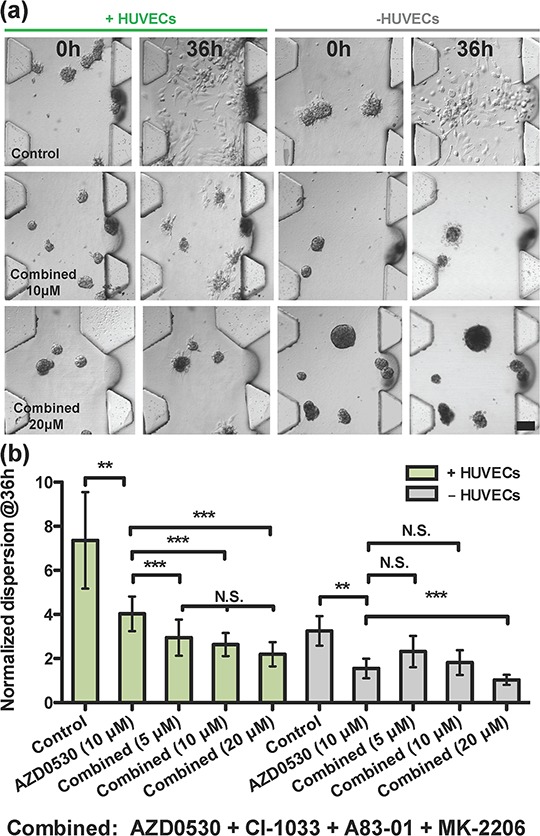
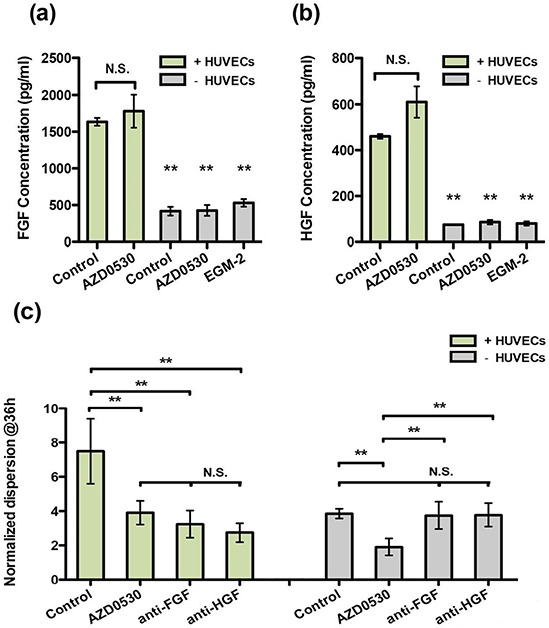
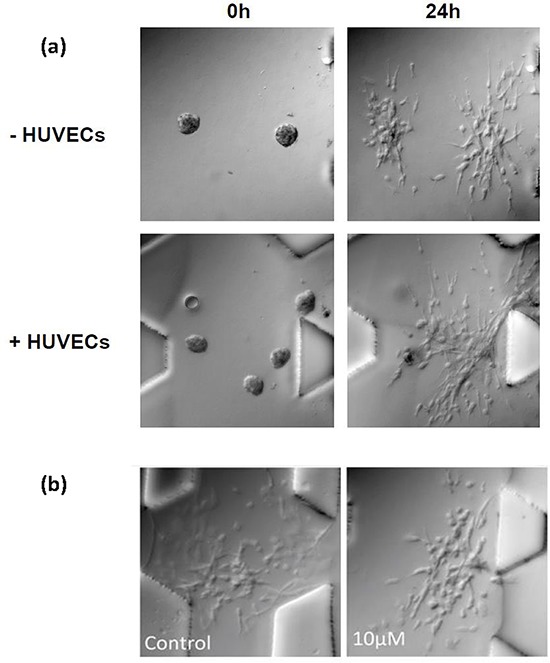
Experiments were performed in a modified microfluidic platform recapitulating part of the in vivo tumor microenvironment by co-culturing carcinoma cell aggregates embedded in a three-dimensional (3D) collagen scaffold with human umbilical vein endothelial cells (HUVECs). HUVECs were seeded in one channel of the device to initiate vessel-like structures in vitro prior to introducing the aggregates. The lung adenocarcinoma cell line A549 and the bladder carcinoma cell line T24 were tested. Dose-response assays of four drugs known to interfere with Epithelial Mesenchymal Transition (EMT) signaling pathways were quantified using relative dispersion as a metric of EMT progression. The presence of HUVECs in one channel induces cell dispersal in A549 which then can be inhibited by each of the four drugs. Complete inhibition of T24 aggregate dispersal, however, is not achieved with any single agent, although partial inhibition was observed with 10 μM of the Src inhibitor, AZD-0530. Almost complete inhibition of T24 dispersal in monoculture was achieved only when the four drugs were added in combination, each at 10 μM concentration. Coculture of T24 with HUVECs forfeits the almost-complete inhibition. The enhanced dispersal observed in the presence of HUVECs is a consequence of secretion of growth factors, including HGF and FGF-2, by endothelial cells. This 3D microfluidic co-culture platform provides an in vivo-like surrogate for anti-invasive and anti-metastatic drug screening. It will be particularly useful for defining combination therapies for aggressive tumors such as invasive bladder carcinoma.

Keywords: bladder cancer; drug screening; epithelial-mesenchymal transition; microfluidics; synergistic effect.


Conflict of interest statement

CONFLICTS OF INTEREST

The authors have declared no conflict of interest.

Figures

Figure 1
Figure 1. Microfluidic co-culture platform for drug screening
a. Schematic of device design shows the overall layout of the media channels and gel regions, where the two regions in the middle are used for introducing collagen gel and the two side channels for filling culture medium and growing of endothelial cells. b. Photograph of the PDMS device. c. An enlarged isometric view of the device showing the relative locations of co-culturing tumor aggregates and endothelial cells (HUVECs). d. HUVECs monolayer formed after 4 h and 36 h, respectively, in the microfluidic channel. Green fluorescence is used for VE-cadherin; blue fluorescence indicates DAPI-stained nuclei. e. Concentration profiles of fluorescent dextran from which permeability can be quantified. A jump in fluorescence concentration on the right side (circled in red) is due to the presence of the intact endothelial monolayer, thus small molecules can only diffuse through the monolayer, resembling drug diffusing out of a blood vessel. f. Drugs used in this study, with the targeting pathways and stage of development.
Figure 2
Figure 2. Screening therapeutic drugs on A549 aggregates over 36 h
a. Staining of EMT markers E-cadherin and vimentin in A549 aggregates at 0 h and 36 h. Green fluorescence is used for both E-cadherin (left panels) and for vimentin (right panels); blue fluorescence is DAPI-stained nuclei. b. Normalized dispersion measured for three concentrations with four drugs at 12 h and 36 h (MK-2206: Akt inhibitor; AZD-0530: Src inhibitor; A83–01: TGF-βR inhibitor; CI-1033: EGFR inhibitor), for three different concentrations in the presence of HUVEC. c. Normalized dispersion measured over time (12 h and 36 h) for analysis synergistic effects between CI-1033 and MK-2206, at four different concentrations (left: dispersion; right: cell number).
Figure 3
Figure 3. Screening therapeutic drugs on T24 aggregates over 36 h in the presence/absence of HUVECs
a. Staining of EMT markers E-cadherin and vimentin in T24 aggregates at 0 h and 36 h. Green fluorescence is used for both E-cadherin (left panels) and for vimentin (right panels); blue fluorescence is DAPI-stained nuclei. b. Normalized dispersion of T24 cells with four drugs, in the absence of HUVECs, at 12 h and 36 h, for three different concentrations. AZD-0530 is effective at 10,000 nM. c. Normalized dispersion of T24 cells with four drugs, in the presence of HUVECs, at 12 h and 36 h, for three different concentrations. AZD-0530 is not effective at 10,000 nM. d. Summary of normalized dispersion between control and AZD-0530 (10 μM), treated group, in the presence/absence of HUVECs at 36 h. e. Qualitative images of (d).
Figure 4
Figure 4. Drug combination analysis on T24 cell aggregates
a. Qualitative images showing the effect of drug used in combinations of four, in the presence or absence of HUVECs at various doses, 10 μM and 20 μM at 0 h and 36 h. b. Comparison between AZD-0530 (used alone at 10 μM) and drugs in combinations of four, in the presence or absence of HUVECs at various doses. Concentrations given are for each drug individually (e.g. combined 5 μM means each drug used at a concentration of 5 μM)
Figure 5
Figure 5. Analysis of endothelial cell secretion of HGF and FGF-2 in co-culture or by T24 cells alone (AZD-0530 was used alone at 10 μM, EGM-2 is the medium control)
a. ELISA measurement of FGF-2 concentration. b. ELISA measurement of HGF concentration. c. Neutralized antibody blocking experiment (HGF and FGF-2).
Figure 6
Figure 6. Blocking integrin β1 assay in microfluidic device
a. Qualitative image for T24 aggregate dispersion with 20 μg/ml β1 antibody, in the absence/presence of HUVECs. b. In the presence of HUVECs, qualitative image for T24 aggregate dispersion with 10 μM AZD-0530.

Similar articles

Cited by

References

    1. Talmadge JE, Fidler IJ. AACR centennial series: the biology of cancer metastasis: historical perspective. Cancer research. 2010;70:5649–5669. - PMC - PubMed
    1. Thiery JP. Epithelial-mesenchymal transitions in tumour progression. Nature reviews Cancer. 2002;2:442–454. - PubMed
    1. Thiery JP, Acloque H, Huang RY, Nieto MA. Epithelial-mesenchymal transitions in development and disease. Cell. 2009;139:871–890. - PubMed
    1. Gupta PB, Onder TT, Jiang G, Tao K, Kuperwasser C, Weinberg RA, Lander ES. Identification of selective inhibitors of cancer stem cells by high-throughput screening. Cell. 2009;138:645–659. - PMC - PubMed
    1. Polyak K, Weinberg RA. Transitions between epithelial and mesenchymal states: acquisition of malignant and stem cell traits. Nat Rev Cancer. 2009;9:265–273. - PubMed

Publication types

MeSH terms

Substances

LinkOut - more resources