. 2016 May;63(5):1455-70.
doi: 10.1002/hep.28294. Epub 2016 Jan 22.

Chronic hepatitis C viral infection subverts vaccine-induced T-cell immunity in humans

Affiliations

Chronic hepatitis C viral infection subverts vaccine-induced T-cell immunity in humans

Christabel Kelly et al. Hepatology. 2016 May.

Abstract

Adenoviral vectors encoding hepatitis C virus (HCV) nonstructural (NS) proteins induce multispecific, high-magnitude, durable CD4(+) and CD8(+) T-cell responses in healthy volunteers. We assessed the capacity of these vaccines to induce functional HCV-specific immune responses and determine T-cell cross-reactivity to endogenous virus in patients with chronic HCV infection. HCV genotype 1-infected patients were vaccinated using heterologous adenoviral vectors (ChAd3-NSmut and Ad6-NSmut) encoding HCV NS proteins in a dose escalation, prime-boost regimen, with and without concomitant pegylated interferon-α/ribavirin therapy. Analysis of immune responses ex vivo used human leukocyte antigen class I pentamers, intracellular cytokine staining, and fine mapping in interferon-γ enzyme-linked immunospot assays. Cross-reactivity of T cells with population and endogenous viral variants was determined following viral sequence analysis. Compared to healthy volunteers, the magnitude of HCV-specific T-cell responses following vaccination was markedly reduced. CD8(+) HCV-specific T-cell responses were detected in 15/24 patients at the highest dose, whereas CD4(+) T-cell responses were rarely detectable. Analysis of the host circulating viral sequence showed that T-cell responses were rarely elicited when there was sequence homology between vaccine immunogen and endogenous virus. In contrast, T cells were induced in the context of genetic mismatch between vaccine immunogen and endogenous virus; however, these commonly failed to recognize circulating epitope variants and had a distinct partially functional phenotype. Vaccination was well tolerated but had no significant effect on HCV viral load.

Conclusion: Vaccination with potent HCV adenoviral vectored vaccines fails to restore T-cell immunity except where there is genetic mismatch between vaccine immunogen and endogenous virus; this highlights the major challenge of overcoming T-cell exhaustion in the context of persistent antigen exposure with implications for cancer and other persistent infections.


Figures

Figure 1
Figure 1
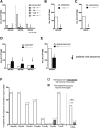
Magnitude of HCV‐specific T‐cell responses after ChAd3‐NSmut (prime) and Ad6‐NSmut (boost) vaccination. The total ex vivo IFN‐γ ELISpot responses across all NS peptide pools are shown. The kinetics of the response in individual patients receiving single‐prime (A) or double‐prime (B) vaccination (dose 2.5 × 10¹⁰ vp) with PEG‐IFN‐α/RIB. A comparative analysis of the magnitude of HCV‐specific T cells following single‐prime or double‐prime vaccination (C) and at baseline in comparison to peak postprime and peak postboost vaccination is shown (D). The kinetics of the HCV‐specific T‐cell response (solid lines) and HCV RNA (gray dotted lines) in individual patients receiving heterologous prime/boost vaccination at low, medium, and high doses (groups B1, B2, and B3, respectively; Table 1) without PEG‐IFN‐α/RIB (E). The magnitude of the T‐cell response in low (A4 and A6), medium (A3 and A5), and high (B3) viral load patient groups 14 or 2 weeks into or without PEG‐IFN‐α/RIB (all high‐dose vaccination; 2.5 × 10¹⁰ vp) (F). Dotted line at positive cutoff (C,D,F). Patients with a positive response are underlined (A,B,E). **P ≤ 0.01. Abbreviations: S, screening; PP, prepriming.
Figure 2
Figure 2
Magnitude of HCV‐specific T‐cell responses in healthy volunteers compared to HCV‐infected patients. A comparison of the magnitude of the T‐cell responses to HCV antigens after high‐dose vaccination with single/double ChAd3‐NSmut (prime) and Ad6‐NSmut (boost) (2.5 × 10¹⁰ vp) in individual healthy volunteers (gray n = 10; groups 7 and 10 as published6) and HCV patients (black, n = 20, groups A3‐6). Responses shown are the total positive ex vivo IFN‐γ ELISpot responses across all NS peptide pools at peak magnitude postprime and peak postboost. Bars at median (A). Kinetics of the total ex vivo IFN‐γ ELISpot response across all NS peptide pools in HCV‐infected patients (A3‐4) and healthy volunteers (group 10 as published6) receiving single‐prime and boost vaccination (B). Bars at mean and standard error of the mean. **P ≤ 0.01, ****P < 0.0001. Abbreviations: S, screening; PP, prepriming.
Figure 3
Figure 3
Antivector immunity after ChAd3‐NSmut (prime) and Ad6‐NSmut (boost) vaccination. Shown are nAbs to priming vector (ChAd3) and the heterologous boosting vector for single‐prime (A) and double‐prime (B) vaccinees as group data (dose 2.5 × 10¹⁰ vp), arms A3‐A6. The magnitude of antiadenovirus (Ad5 hexon proteins) T‐cell responses (by ex vivo IFN‐γ ELISpot) in patients receiving single‐prime (C) or double‐prime vaccination is shown (D). Abbreviations: S, screening; PP, prepriming.
Figure 4
Figure 4
Cross‐reactivity of vaccine‐induced T cells to circulating viral antigen and the frequency of responders to vaccination when viral sequence is matched or mismatched with vaccine immunogen. T‐cell responses (IFN‐γ ELISpot) to peptide variants homologous to vaccine immunogen and circulating autologous virus at epitopes KLSGLGINAV (patients 040, 050, and 055) (A), HSKKKCDEL (patient 045) (B), LTRDPTTPLA (patient 055) (C), CVNGVCWTV (patients 027, 055, and 053) (D), and GINAVAYYRGLDVSV (patient 052) (E). Vaccine sequence in italics, with endogenous variants below. Arrows show patient's viral sequence. The percentage of HCV patients (with endogenous viral sequence that is completely homologous [matched] or mismatched with vaccine immunogen) who have a detectable T‐cell response (IFN‐γ ELISpot) at any time after vaccination to a given epitope target with known HLA restriction. Only patients with the corresponding HLA type are included. Data are presented for each epitope and as summary data (F). **P ≤ 0.01. Abbreviation: nd, not done.
Figure 5
Figure 5
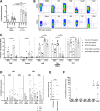
Comparison of phenotype and function of vaccine‐induced HCV‐specific T cells in patients versus healthy volunteers. Magnitude of HCV‐specific CD8+ T‐cell responses ex vivo detected by major histocompatibility complex class I pentamers (NS31436 ATDALMTY, NS31406 KLSGLGINAV, NS31073 CVNGVCWTV) in healthy volunteers (gray) versus HCV‐infected patients (black) prevaccination, postprime 2‐4 weeks after ChAd3, 2‐8 weeks post‐Ad6 boost vaccination, and at the end of the vaccine study (EOS), 22‐50 weeks postboost. Bars at median. Mann‐Whitney t test (A). Representative fluorescence‐activated cell sorting plots are shown for major histocompatibility complex class I pentamer and marker staining (NS31406 KLSGLGINAV) (B). Percentage of pentamer‐positive cells expressing a given marker in patients prevaccination (triangles), at the peak of the response (dots, 2‐4 weeks post‐Ad6 boost), or at the EOS (squares, 22‐50 weeks post‐Ad6 boost). For comparison the percentage of pentamer‐positive cells expressing a given marker in healthy volunteers (gray) receiving the same vaccinations is shown at the peak of the response (dots, 2‐4 weeks post‐ChAd3 prime) or at the EOS (squares, 22‐50 weeks post‐Ad6 boost). Bars at median. Mann‐Whitney t test (patient pre‐vax versus patient EOS, healthy peak versus patient peak, healthy EOS versus patient EOS) (C). Intracellular cytokine staining: PBMCs stimulated with peptide pools F + G + H (NS3‐4) or I + L + M (NS5). The percentage of total CD4+/CD8+ IFN‐γ, TNF‐α, or IL‐2 producing T cells at peak postboost vaccination (2‐8 weeks post‐Ad6) or postboost (2‐4 weeks post‐Ad6). Intracellular cytokine staining was performed on all patients with an IFN‐γ ELISpot response >150 SFCs/106 PBMCs. All values are after background subtraction (DMSO wells), and only positive responses are shown. Bars at median. (D) Breadth of responses ex vivo: IFN‐γ ELISpot data for HCV‐infected patients versus healthy volunteers. Responses are the number of positive pools (see Materials and Methods) measured at peak magnitude during the study (E). Proliferative responses to HCV proteins: in patients 4 weeks post‐Ad6 boost, plotted as SI. SI ≥3 was defined as positive. Responses to positive control antigens (concanavalin A and CMV peptides) are shown. Bars represent the median (F). *P ≤ 0.05, **P ≤ 0.01, ***P ≤ 0.001, ****p < 0.0001. Abbreviations: EOS, end of the vaccine study; GzA, granzyme A; GzB, granzyme B; PB, post‐Ad6 boost; PP, postprime; pre‐vax, prevaccination.

Comment in

References

    1. Messina JP, Humphreys I, Flaxman A, Brown A, Cooke GS, Pybus OG, et al. Global distribution and prevalence of hepatitis C virus genotypes. Hepatology 2015;61:77‐87. - PMC - PubMed
    1. Razavi H, Elkhoury AC, Elbasha E, Estes C, Pasini K, Poynard T, et al. Chronic hepatitis C virus (HCV) disease burden and cost in the United States. Hepatology 2013;57:2164‐2170. - PMC - PubMed
    1. Barnes E, Folgori A, Capone S, Swadling L, Aston S, Kurioka A, et al. Novel adenovirus‐based vaccines induce broad and sustained T cell responses to HCV in man. Sci Transl Med 2012;4:115ra1. - PMC - PubMed
    1. Swadling L, Capone S, Antrobus RD, Brown A, Richardson R, Newell EW, et al. A human vaccine strategy based on chimpanzee adenoviral and MVA vectors that primes, boosts, and sustains functional HCV‐specific T cell memory. Sci Transl Med 2014;6:261ra153. - PMC - PubMed
    1. McKiernan SM, Hagan R, Curry M, McDonald GS, Kelly A, Nolan N, et al. Distinct MHC class I and II alleles are associated with hepatitis C viral clearance, originating from a single source. Hepatology 2004;40:108‐114. - PubMed

Publication types

MeSH terms