. 2015 Oct 16;10(10):e0140797.
doi: 10.1371/journal.pone.0140797. eCollection 2015.

The Features of Copper Metabolism in the Rat Liver during Development

Affiliations

The Features of Copper Metabolism in the Rat Liver during Development

Yulia A Zatulovskaia et al. PLoS One. .

Abstract

Strong interest in copper homeostasis is due to the fact that copper is simultaneously a catalytic co-factor of the vital enzymes, a participant in signaling, and a toxic agent provoking oxidative stress. In mammals, during development copper metabolism is conformed to two types. In embryonic type copper metabolism (ETCM), newborns accumulate copper to high level in the liver because its excretion via bile is blocked; and serum copper concentration is low because ceruloplasmin (the main copper-containing protein of plasma) gene expression is repressed. In the late weaning, the ETCM switches to the adult type copper metabolism (ATCM), which is manifested by the unlocking of copper excretion and the induction of ceruloplasmin gene activity. The considerable progress has been made in the understanding of the molecular basis of copper metabolic turnover in the ATCM, but many aspects of the copper homeostasis in the ETCM remain unclear. The aim of this study was to investigate the copper metabolism during transition from the ETCM (up to 12-days-old) to the ATCM in the rats. It was shown that in the liver, copper was accumulated in the nuclei during the first 5 days of life, and then it was re-located to the mitochondria. In parallel with the mitochondria, copper bulk bound with cytosolic metallothionein was increased. All compartments of the liver cells rapidly lost most of their copper on the 13th day of life. In newborns, serum copper concentration was low, and its major fraction was associated with holo-Cp, however, a small portion of copper was bound to extracellular metallothionein and a substance that was slowly eluted during gel-filtration. In adults, serum copper concentration increased by about a factor of 3, while metallothionein-bound copper level decreased by a factor of 2. During development, the expression level of Cp, Sod1, Cox4i1, Atp7b, Ctr1, Ctr2, Cox17, and Ccs genes was significantly increased, and metallothionein was decreased. Atp7a gene's activity was fully repressed. The copper routes in newborns are discussed.


Conflict of interest statement

Competing Interests: The authors have declared that no competing interests exist.

Figures

Fig 1
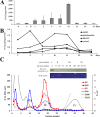
Fig 1. Hepatic copper concentration and copper distribution in the liver cells of newborn rats.
(А) Copper is accumulated in the liver from embryonic stage development to 12 th day of life. Ordinate axis: hepatic copper concentrations, μg/g wet weight (the means ± SD, n = 5); abscissa axis: age, days. (B) During accumulation copper is redistributed between subcellular compartments. Each dot represents the average from 3 experiments, in which the differences were not more than 10%. For each point, depending on the age of rats, 2–10 livers were combined to isolate subcellular fractions (nuclei–circle, mitochondria–rhomb, (endoplasmic reticulum + Golgi complex)–triangle, cytosol–rectangle). Ordinate axis: copper concentrations, μg/mg total protein; abscissa axis: age, days. (C) Gel-filtration distribution of copper in cytosol of the newborn (P9, red) and adult (P60, blue) rats. Cytosolic fraction was isolated from about 1 g liver tissue (a mixture of ∼350 mg of liver tissue from three rats) as described in Methods. Ordinate axis (left): copper (closed dots) or zinc (open dots) concentration, μg/L, Arrow shows eluted position of cytochrome C. Ordinate axis (right): optical density–D280 (dotted line) and D254 (dots). Abscissa axis: fraction number. Inset: WB with antibodies to ceruloplasmin (8% SDS-PAGE) and SOD activity (gel-test, 8% PAGE); the samples content 10 μl of the major copper fractions from peaks I, II, III, and IV of P9 cytosol.
Fig 2
Fig 2. Ontogenetic changes of copper balance in the blood serum of rats.
(A) Serum copper concentration and ceruloplasmin protein level increased coordinately during development. Ordinate axis: (left) copper concentration, μg/L (light bars), (right) ceruloplasmin protein concentration measured by rocket immunoelectrophoresis, mg/L (black bars), the means ± SD, n = 5. Inset: the representative protocol of immunoelectrophoresis. *Serum of adult rat was 2-fold diluted. Abscissa axis: age, days. (B) Blood serum oxidase and ferroxidase activities increased after ETCM→ATCM transition. Enzymatic activities were determined by gel-assay and expressed as a. u., the means ± SD, n = 3. Abscissa axis: age, days, *Р<0.05 in comparison with newborns. (C) In the serum of newborn and adult rats, the main copper portion was precipitated with ceruloplasmin. Ordinate axis: copper concentration, μg/L, light bars–actual serum copper concentration; black bars–copper concentration in ceruloplasmin precipitates. (D) Gel-filtration distribution of blood serum copper of P9 (red) and P60 (blue) rats. Ordinate axis: cooper concentration, μg/L; abscissa axis: gel-filtration fraction number. *—position of the maximum oxidase activity. Arrow show eluted position of cytochrome C. Inset: 12% SDS-PAGE of fractions from peak III of P9 and P60 rats. The samples were treated with SDS and 2-mercaptoethanol at 95°C, 5 min. Gel was stained with AgNO3. Right lane: molecular weight calibration markers from 3.4–100 kDa (ThermoScientific, cat. N26632, USA). (E) Metallothionein (MT) presents in the serum of newborn and adult rats. Upper: WB protocol of blood serum P9 and P60 rats with antibodies to MT (samples content 1.0 μl serum); below: relative level of MT in newborn and adult rats, the means ± SD (n = 3). (F) Serum copper and zinc are precipitated by antibodies to MT. Ordinate axis: Copper or zinc content in MT precipitates, % from atomic concentration copper or zinc in serum (n = 2).
Fig 3
Fig 3. Hepatic expression of the genes associated with copper metabolism during ETCM→ATCM transition.
(A) RT-PCR analysis of the relative levels of mRNAs. Ordinate axis: the data expressed as a. u., the means ± SD (n = 4); *—P<0.05, **—P<0.01, ***—P<0.005. Light bars–P3, grey bars–P12, black bars–P60. (B) Western blot analysis of the relative content of proteins associated with copper metabolism. Upper: examples of WB and SOD activity protocols. The molecular weight of WB identified proteins corresponds to: Cp ∼130 kDa (8% SDS-PAGE), SOD1 ∼17 kDa (12% SDS-PAGE), COX4 ∼20 kDa (12% SDS-PAGE), MT ∼8 kDa (15% SDS-PAGE), COMMD1 ∼23 kDa (12% SDS-PAGE); SOD activity was identified by gel-assay (blue gel) as described in Methods. Below: densitometric quantification of WB and SOD1 activity data. Abscissa axis: relative protein content, a. u., the means ± SD (n = 4). Light bars–P9, black bars–P60 rats.
Fig 4
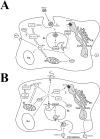
Fig 4. Schema illustrating copper turnover in the hepatocytes newborns (A) and adults rats (B).
(A) In newborns, milk Cp enters to gastrointestinal tract and due to transcytosis transfers into bloodstream, and then it binds with hepatic Cp receptor and proceeds into endolysosomes (EL). At pH > 5, Cu(II) ions are dissociated from milk Cp molecule, Cu(II) is reduced to Cu(I) by STEAP4 and imported by CTR2 in cytosol. Here, Cu(I) is redistributed between Cu(I)-chaperons to be delivered to the places of apo-cuproenzymes formation (trans Golgi network (TGN), cytosol, mitochondria (M)). Also copper is bound with MT, and involved to redox cycle MT/glutathione or delivered to nucleus (Nu) and M as well as exported to extracellular space. As MT is found in mitochondria and nucleus [40], possibly, it transferred copper to the nucleus and mitochondria (or brings copper to their cytosolic surface). (B) In adults, absorbed nutrient copper is imported by CTR1 and distributed between Nu, M, cytosol, and MT [5]. Copper of disturbed cuproenzymes can be re-cyclized via endocytosis or autophagy. In both cases, the copper return in metabolic cycle through STEAP4/CTR2 endolysosomal system.

Similar articles

Cited by

References

    1. Tapiero H, Townsend DM, Tew KD. Trace elements in human physiology and pathology. Copper. Biomed Pharmacother. 2003; 57: 386–398. - PMC - PubMed
    1. Rubino JT, Franz KJ. Coordination chemistry of copper proteins: how nature handles a toxic cargo for essential function. J Inorg Biochem. 2012; 107: 129–143. 10.1016/j.jinorgbio.2011.11.024 - DOI - PubMed
    1. Gulec S, Collins JF. Molecular Mediators Governing Iron-Copper Interactions. Annu Rev Nutr. 2014; 34: 95–116. 10.1146/annurev-nutr-071812-161215 - DOI - PMC - PubMed
    1. Kozlowski H, Kozlkowska P, Watly J, Krzywoszynska K, Potocki S. General Aspects of Metal Toxicity. Curr Med Chem. 2014; 21: 3721–3740. - PubMed
    1. Nevitt T, Öhrvik H, Thiele DJ. Charting the travels of copper in eukaryotes from yeast to mammals. Biochim Biophys Acta. 2012; 1823: 1580–1593. 10.1016/j.bbamcr.2012.02.011 - DOI - PMC - PubMed

Publication types