. 2015 Dec 8;6(39):41884-901.
doi: 10.18632/oncotarget.6099.

Caveolin-1-negative head and neck squamous cell carcinoma primary tumors display increased epithelial to mesenchymal transition and prometastatic properties

Affiliations

Caveolin-1-negative head and neck squamous cell carcinoma primary tumors display increased epithelial to mesenchymal transition and prometastatic properties

Alain C Jung et al. Oncotarget. .

Abstract

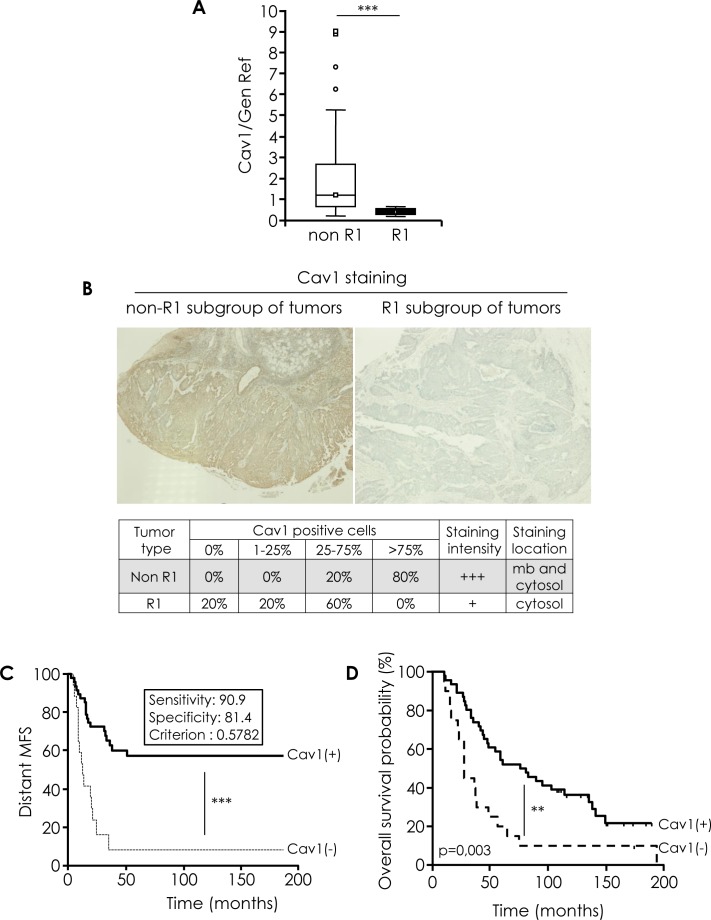
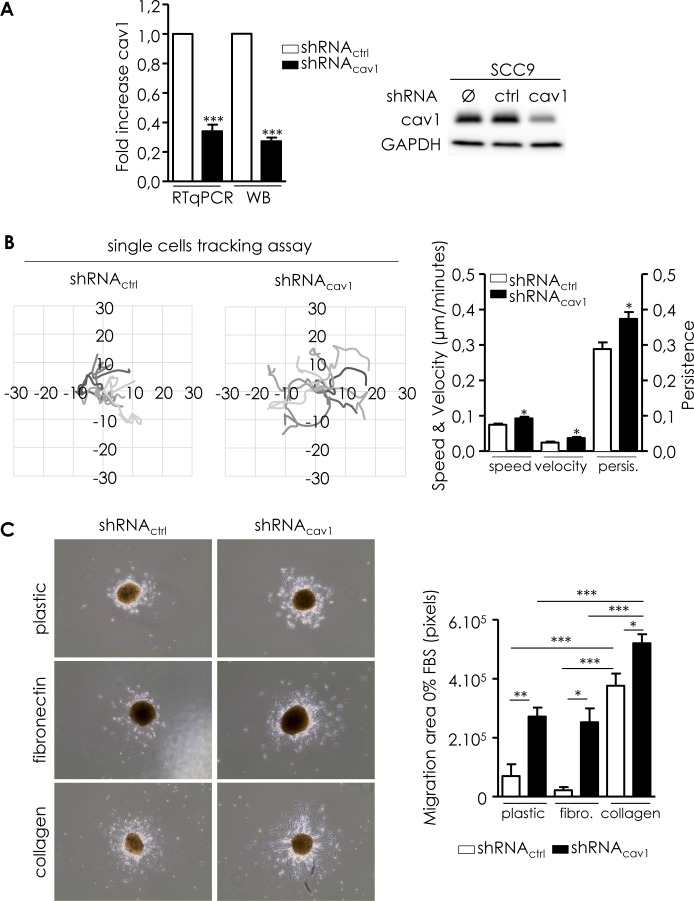
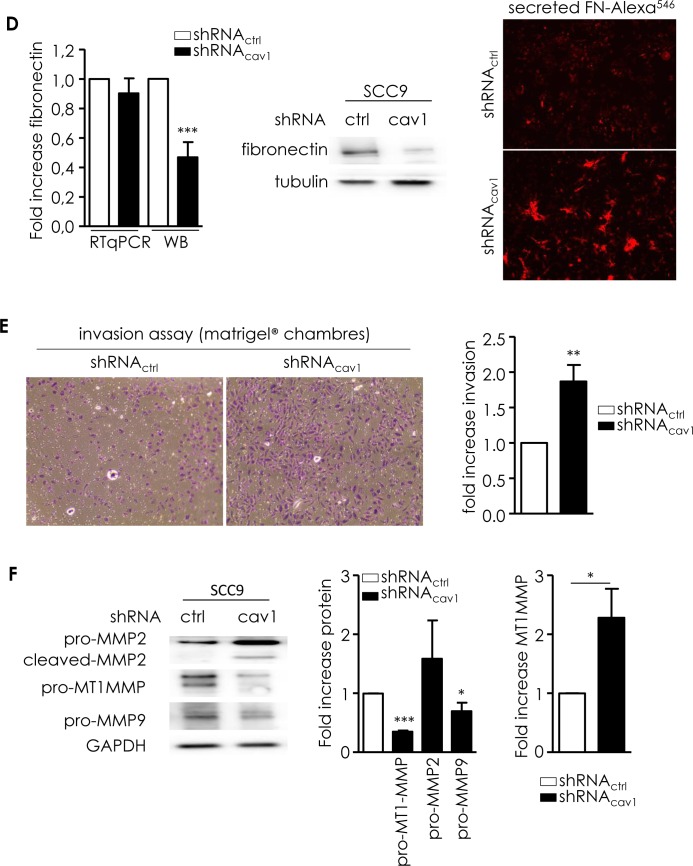
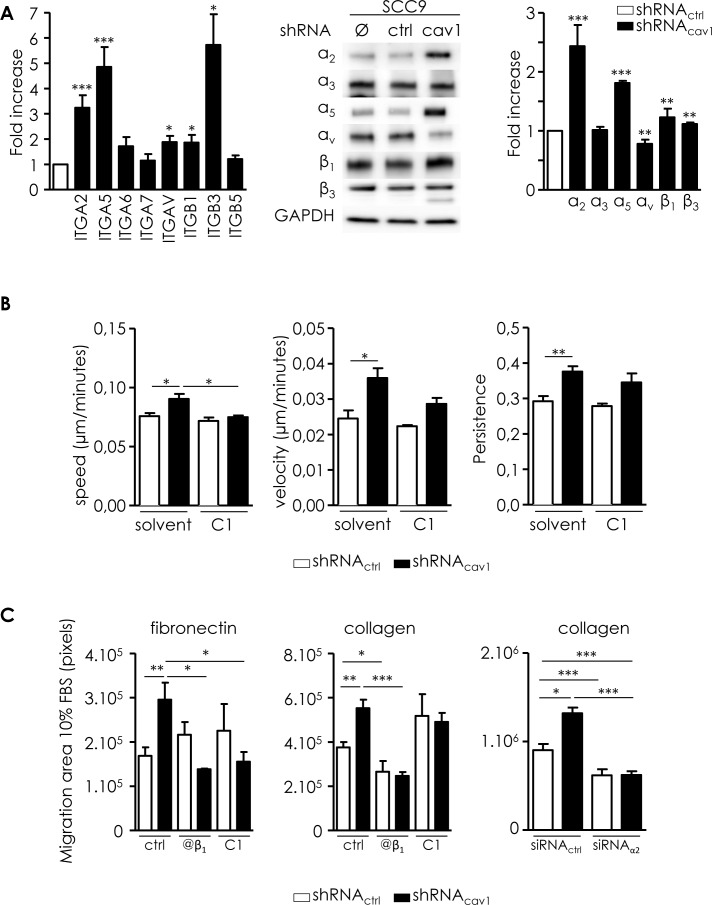
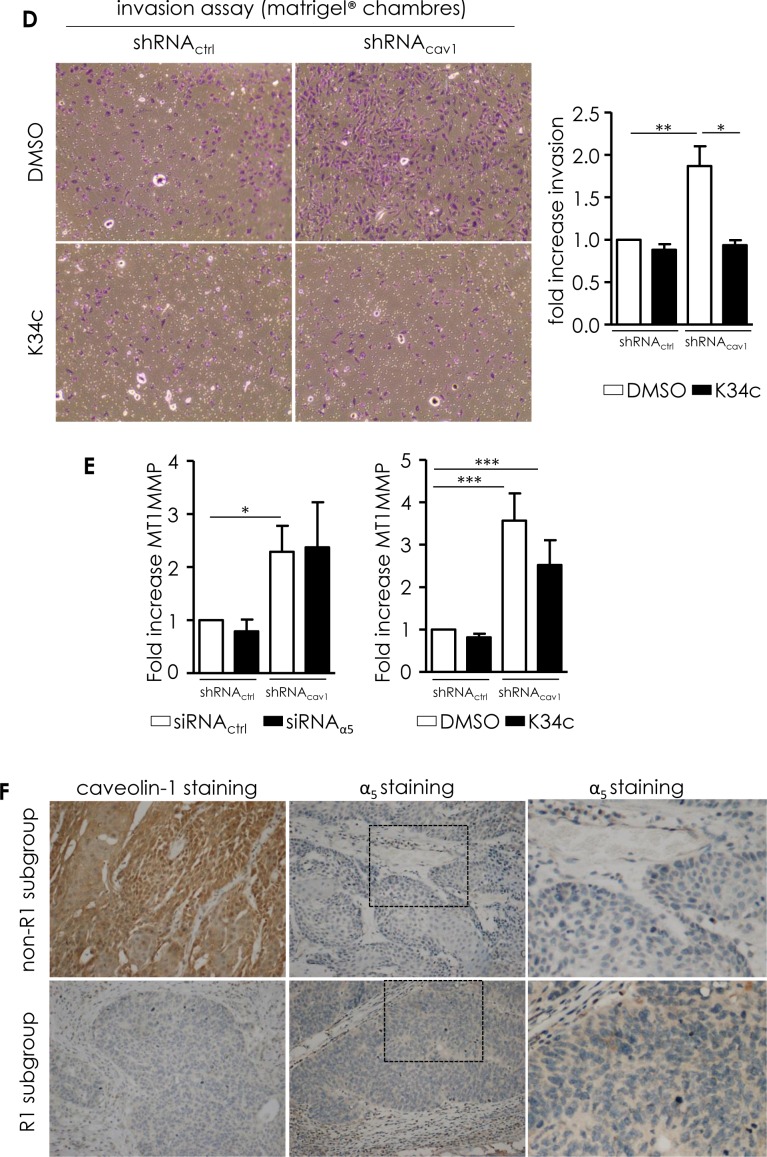
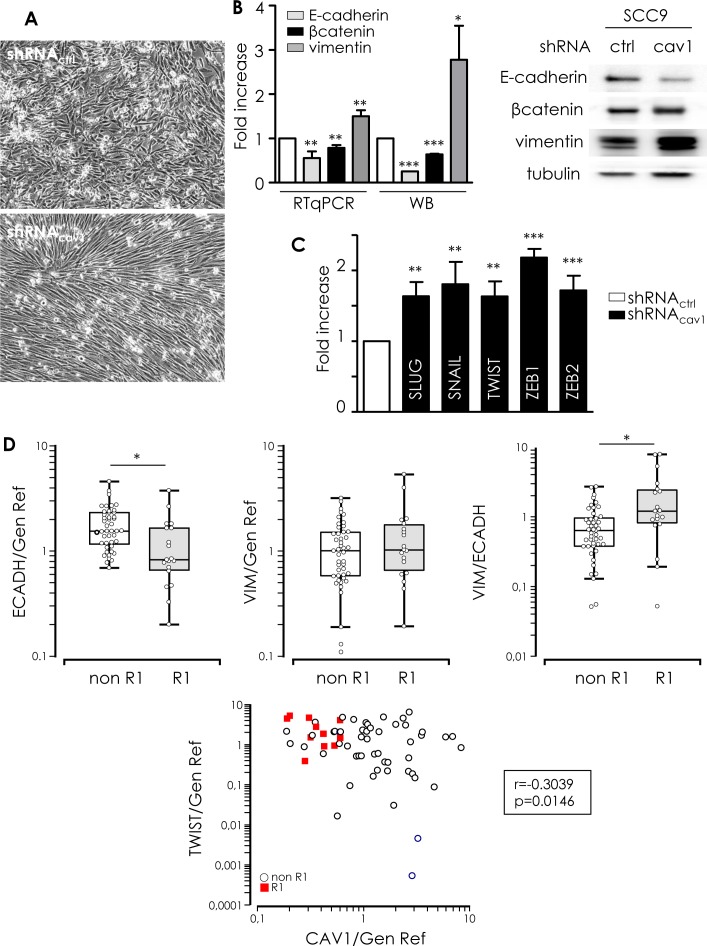
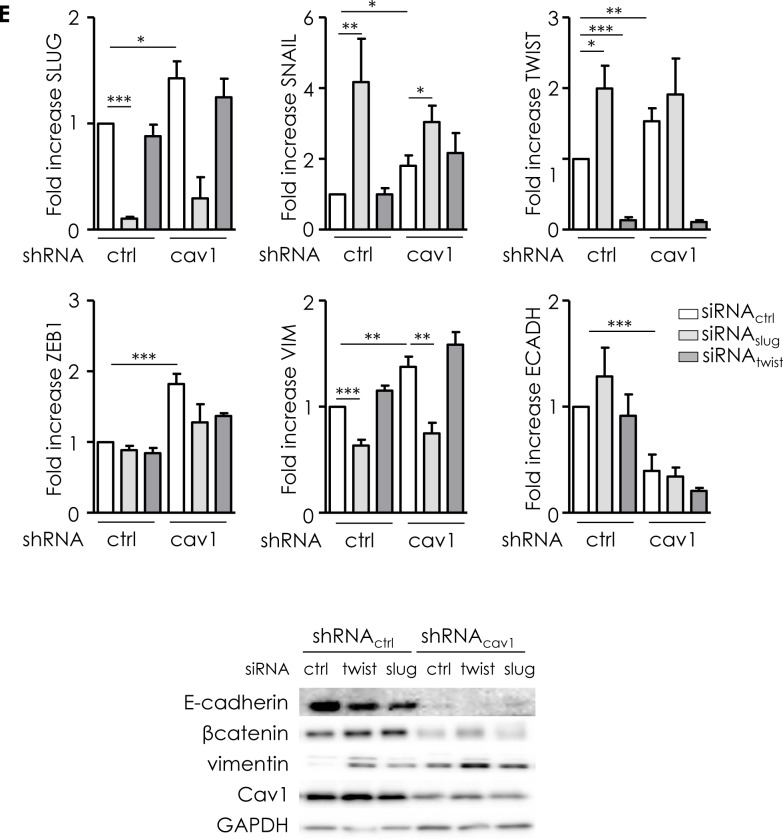
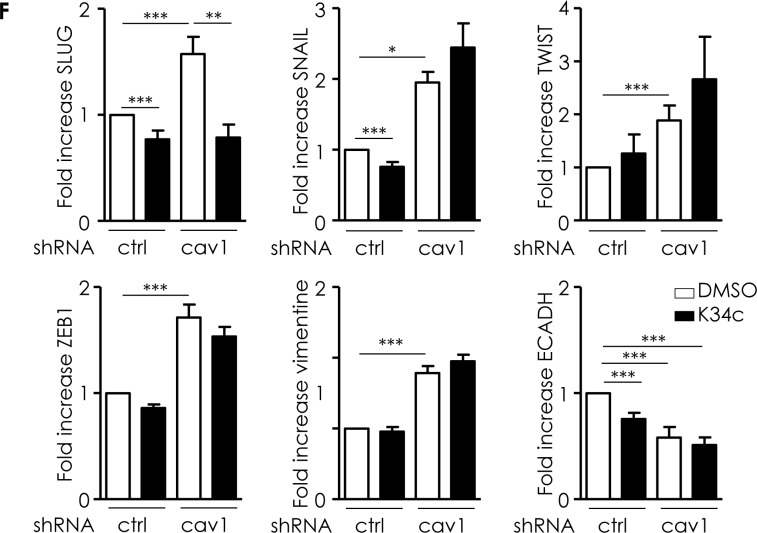
Distant metastases arise in 20-30% of patients with squamous cell carcinoma of the head and neck (HNSCC) in the 2 years following treatment. Therapeutic options are limited and the outcome of the patients is poor. The identification of predictive biomarkers of patient at risk for distant metastasis and therapies are urgently needed. We previously identified a clinical subgroup, called "R1" characterized by high propensity for rapid distant metastasis. Here, we showed that "R1" patients do not or at very low level express caveolin-1 (Cav1). Low or no expression of Cav1 is of bad prognosis. Disappearance of Cav1 enables cells to undergo epithelial-mesenchymal transition (EMT). EMT is associated with enhanced migration and invasion. Our study uncovered a new target, α5β1 integrin. Targeting α5β1 integrins might not only prevent metastasis of HNSCC but also delay the development of the primary tumor by reducing tumor cell viability. Cav1 detection might be taken into consideration in the future in the clinic not only to identify patients at high risk of metastasis but also to select patient who might benefit from an anti-integrin therapy.

Keywords: caveolin-1; head and neck cancer; integrins; metastasis.


Conflict of interest statement

CONFLICTS OF INTEREST

The authors declare that they have no conflict of interest.

Figures

Figure 1
Figure 1. Cav1 expression in human HNSCC tissue specimens
A. Quantified analysis of CAV1 transcripts determined in 11 primary tumor samples of patients that developed metastasis (“R1”) and 57 primary tumor samples of patients that did not developed metastasis (“non-R1”). The line within the bar represents the mean value and “o” represent individual data point. (***p < 0.001). B. Immunohistochemical analysis of Cav1 in R1 and non-R1 FFPE tissus (original magnification: X100). Table show % of non-R1 and R1 tumors with 0%, 1-25%, 25-75% and >75% Cav1-positive cells. C. Kaplan-Meier analysis of the distant metastasis-free survival (MFS) in patients stratified according Cav1 gene expression (CAV1(+) and CAV1 (−)). A cut-off value was determined for Cav1 gene expression (measured by qRT-PCR), corresponding to a 90.1% sensitivity and a 81.4% specificity with respect to the “R1” status (i.e. 90.1% of the “R1” lesions display a Cav1 expression level below this cut-off, and 81.4% of the “non-R1” tumours express Cav1 levels above this cut-off. More detail in suppl. material and methods). Samples were considered as Cav1-negative is the qRT-PCR value was ≤ to the cut-off. Shorter time to metastasis ***p < 0.001). D. Kaplan-Meier analysis of the overall survival (OS) in patients stratified according Cav1 gene expression (CAV1(+) and CAV1 (−)) as described in Fig 1C. Shorter time to death, **p = 0.003).
Figure 2
Figure 2. Reduction of Cav1 enables cells motile and invasive properties
A. Quantitative determination of transcripts and protein expression of Cav1 in shRNActrl- or shRNAcav1-SCC9 cells using qRT-PCR with RNA18S as control and western blot using GAPDH as a loading control. Each bar represents the mean±SEM with ***p < 0.001. B. Analysis of single cell migration of shRNActrl- and shRNAcav1-transfected SCC9. Diagrams represent the migrating trajectories of cells covered during 6 hours by ten representative shRNActrl and shRNAcav1-transfected SCC9. Each bar represents the mean±SEM of the speed, the velocity and the persistence recorded during 6 hours for each cell type (n = 4, *p < 0.05). C. Analysis of collective cell migration of shRNActrl- and shRNAcav1-transfected SCC9. Phase contrast images showing the evasion of shRNActrl- and shRNAcav1-transfected SCC9 from spheroids after 12 hours growth on plastic-, fibronectin- or collagen-coated cells. Each bar represents the mean±SEM area covered by cells evading from the spheroid (n = 7-9, *p < 0.05, **p < 0.01 and ***p < 0.001). D. Left panel: quantitative determination of transcripts and protein expression of fibronectin in shRNActrl- or shRNAcav1-SCC9 cells using qRT-PCR with RNA18S as control and western blot using tubulin as a loading control. Each bar represents the mean±SEM with ***p < 0.001, n = 8. Right panel: immunofluorescence analysis of extracellular secreted fibronectin by shRNActrl- or shRNAcav1-SCC9 cells. Images were taken at 4x magnification with an AXIO Zeiss microscope. E. Phase contrast images showing the invasion of shRNActrl- and shRNAcav1-transfected SCC9 through BioCoat Matrigel® invasion chambers. Cells were stained with crystal violet after 22 hours invasion. Each bar represents the mean±SEM fold increase in invasion (n = 6, **p < 0.01). F. MMPs protein levels were analyzed by western blot analysis using GAPDH as a loading control. Each bar represents the mean±SEM with *p < 0.05 and ***p < 0.001. MT1-MMP was analyzed in shRNActrl- or shRNAcav1-SCC9 cells using qRT-PCR with RNA18S as control. Each bar represents the mean±SEM with *p < 0.05, n = 4.
Figure 3
Figure 3. Integrins are involved in the motile and invasive properties of low Cav1 expressing cells
A. Left panel: quantitative determination of transcripts expression of integrins (α2, α5, α6, α7, αv, β1, β3, β5 integrin subunits) in shRNActrl- or shRNAcav1-SCC9 cells using qRT-PCR with RNA18S as control. Each bar represents the mean±SEM with *p < 0.05, and ***p < 0.001. Right panel: integrin subunit protein levels (α2, α3, α5, αv, β1 and β3 integrin subunits) were analyzed by western blot analysis using GAPDH as a loading control. Each bar represents the mean±SEM with **p < 0.01 and ***p < 0.001. B. Analysis of single cell migration of shRNActrl- and shRNAcav1-transfected SCC9. Migrating trajectories of shRNActrl- and shRNAcav1-transfected SCC9 exposed to solvent or to a specific α5β1 integrin antagonist component 1 (C1, 20μmol/L) were recorded during 6 hours. Each bar represents the mean±SEM of the speed, the velocity and the persistence recorded during 6h for each cell type (n = 3-5, *p < 0.05 and **p < 0.01). C. Analysis of collective cell migration of shRNActrl and shRNAcav1-transfected SCC9. Evasion of shRNActrl- and shRNAcav1-transfected SCC9 from spheroids exposed to solvent, to a specific α5β1 integrin antagonist component 1 (C1, 20 μmol/L) and to a β1 integrin specific blocking antibody OS2966 (10 μg/mL) were determined after 12 hours growth on fibronectin- or collagen-coated cells. Evasion of shRNActrl- and shRNAcav1-SCC9 transfected with siRNActrl or siRNAα2 from spheroids were determined after 12 hours growth on collagen-coated cells. Each bar represents the mean±SEM area covered by cells evading from the spheroid (n = 4, *p < 0.05, **p < 0.01 and ***p < 0.001). D. Phase contrast images showing the invasion of shRNActrl- and shRNAcav1-transfected SCC9 exposed to solvent or to a specific α5β1 integrin antagonist K34c (20 μmol/L) through BioCoat Matrigel® invasion chambers. Cells were stained with crystal violet after 22 hours invasion. Each bar represents the mean±SEM fold increase in invasion (n = 4-6, *p < 0.05 and **p < 0.01). E. Quantitative determination of transcripts expression of MT1-MMP in shRNActrl- or shRNAcav1-SCC9 cells transfected with siRNActrl and siRNAα5 integrin subunits or exposed to solvent and K34c (20 μmol/L) using qRT-PCR with RNA18S as control. Each bar represents the mean±SEM with *p < 0.05 and ***p < 0.001. F. Immunohistochemical (IHC) analysis of Cav1 (left panels) and α5 integrin subunit (middle panels) in representative “R1” and “non-R1” FFPE tissues are shown (original magnification: X200). Magnifications of insets shown in middle pictures are shown in the corresponding right panels (original magnification: X400).
Figure 4
Figure 4. Low Cav1 expressing cells undergo an EMT
A. Phase contrast images of stable SCC9 cells expressing shRNActrl or shRNAcav1 in culture. B. Quantitative determination of transcripts expression of epithelial (E-cadherin and β-catenin) and mesenchymal (vimentin) markers in shRNActrl- or shRNAcav1-SCC9 cells using qRT-PCR with RNA18S as control and western blot using tubulin as a loading control. Each bar represents the mean±SEM with **p < 0.01 and *** < p0.001. C. Quantitative determination of transcripts expression of key regulator of E-cadherin and EMT (including Slug, Snail, Twist, ZEB1 and ZEB2) in shRNActrl- or shRNAcav1-SCC9 cells using qRT-PCR with RNA18S as control. Each bar represents the mean±SEM with **p < 0.01 and ***p < 0.001. D. Quantified analysis of E-cadherin, vimentin, Twist and Cav1 transcripts determined in primary tumor samples of patients that developed metastasis (“R1”) and primary tumor samples of patients that did not developed metastasis (“non-R1”). The line within the bar represents the mean value and “o” represent individual data point. (***p < 0.001). E. Quantitative determination of transcripts expression of Slug, Snail, Twist, Zeb1, vimentin and E-cadherin in shRNActrl- or shRNAcav1-SCC9 cells transfected by siRNActrl or siRNASLUG or siRNATWIST using qRT-PCR with RNA18S as control. Each bar represents the mean±SEM with *p < 0.05, **p < 0.01 and *** < p0.001. F. Quantitative determination of transcripts expression of Slug, Snail, Twist, Zeb1, vimentin and E-cadherin in shRNActrl- or shRNAcav1-SCC9 cells exposed to DMSO or 20 μmol/L K34c using qRT-PCR with RNA18S as control. Each bar represents the mean±SEM with *p < 0.05, **p < 0.01 and *** < p0.001.
Figure 5
Figure 5. Low Cav1 expression is associated with a reduction of growth and survival capacities partially preserved by α5β1 integrins
A. shRNActrl- and shRNAcav1-transfected SCC9 growth index was analyzed by regular cell counting using the TC20 counter (BioRad). Each bar represents the mean±SEM growth index of shRNAcav1- versus shRNActrl-transfected cells (n = 14, ***p < 0.001). B. ShRNActrl- and shRNAcav1- SCC9 were subjected to a clonogenic assay. Photograph represents phase contrast images of shRNActrl- and shRNAcav1- SCC9 colonies after staining with crystal violet. Each bar represents the mean±SEM surviving fraction of shRNAcav1- versus shRNActrl-transfected cells. Plating efficiency are 0.23±0.02, and 0.17±0.02 for shRNActrl and shRNAcav1-transfected SCC9 respectively (n = 17, ***p < 0.001). C. Phase contrast images of stable shRNActrl or shRNAcav1 SCC9 cells exposed to solvent or 20 μmol/L K34c up to 72 hours in 0% FBS containing medium. Each bar represents the mean±SEM number of cells and the percentage of proliferation and viability after trypan blue staining with *p < 0.05, **p < 0.01 and *** < p0.001. D. Phase contrast images of shRNActrl- and shRNAcav1- SCC9 colonies stained with crystal violet exposed to solvent or 20 μmol/L K34c up to 72 hours in 0% FBS containing medium. After refreshment, cells are allowed to grow 7 days in 10% FBS containing medium. Each bar represents the mean±SEM surviving fraction with **p < 0.01 and *** < p0.001.

Similar articles

Cited by

References

    1. Hashibe M, Brennan P, Chuang SC, Boccia S, Castellsague X, Chen C, Curado MP, Dal Maso L, Daudt AW, Fabianova E, Fernandez L, Wunsch-Filho V, Franceschi S, Hayes RB, Herrero R, Kelsey K, et al. Interaction between tobacco and alcohol use and the risk of head and neck cancer: pooled analysis in the International Head and Neck Cancer Epidemiology Consortium. Cancer epidemiology, biomarkers & prevention : a publication of the American Association for Cancer Research, cosponsored by the American Society of Preventive Oncology. 2009;18:541–550. - PMC - PubMed
    1. Dayyani F, Etzel CJ, Liu M, Ho CH, Lippman SM, Tsao AS. Meta-analysis of the impact of human papillomavirus (HPV) on cancer risk and overall survival in head and neck squamous cell carcinomas (HNSCC) Head & neck oncology. 2010;2:15. - PMC - PubMed
    1. Jemal A, Bray F, Center MM, Ferlay J, Ward E, Forman D. Global cancer statistics. CA: a cancer journal for clinicians. 2011;61:69–90. - PubMed
    1. Denaro N, Russi EG, Adamo V, Merlano MC. State-of-the-art and emerging treatment options in the management of head and neck cancer: news from 2013. Oncology. 2014;86:212–229. - PubMed
    1. Ma J, Liu Y, Yang X, Zhang CP, Zhang ZY, Zhong LP. Induction chemotherapy in patients with resectable head and neck squamous cell carcinoma: a meta-analysis. World journal of surgical oncology. 2013;11:67. - PMC - PubMed

Publication types

MeSH terms