. 2015 Oct 16;11(10):e1005593.
doi: 10.1371/journal.pgen.1005593. eCollection 2015 Oct.

A Phenomic Scan of the Norfolk Island Genetic Isolate Identifies a Major Pleiotropic Effect Locus Associated with Metabolic and Renal Disorder Markers

Affiliations

A Phenomic Scan of the Norfolk Island Genetic Isolate Identifies a Major Pleiotropic Effect Locus Associated with Metabolic and Renal Disorder Markers

Miles C Benton et al. PLoS Genet. .

Abstract

Multiphenotype genome-wide association studies (GWAS) may reveal pleiotropic genes, which would remain undetected using single phenotype analyses. Analysis of large pedigrees offers the added advantage of more accurately assessing trait heritability, which can help prioritise genetically influenced phenotypes for GWAS analysis. In this study we performed a principal component analysis (PCA), heritability (h2) estimation and pedigree-based GWAS of 37 cardiovascular disease -related phenotypes in 330 related individuals forming a large pedigree from the Norfolk Island genetic isolate. PCA revealed 13 components explaining >75% of the total variance. Nine components yielded statistically significant h2 values ranging from 0.22 to 0.54 (P<0.05). The most heritable component was loaded with 7 phenotypic measures reflecting metabolic and renal dysfunction. A GWAS of this composite phenotype revealed statistically significant associations for 3 adjacent SNPs on chromosome 1p22.2 (P<1x10⁻⁸). These SNPs form a 42kb haplotype block and explain 11% of the genetic variance for this renal function phenotype. Replication analysis of the tagging SNP (rs1396315) in an independent US cohort supports the association (P = 0.000011). Blood transcript analysis showed 35 genes were associated with rs1396315 (P<0.05). Gene set enrichment analysis of these genes revealed the most enriched pathway was purine metabolism (P = 0.0015). Overall, our findings provide convincing evidence for a major pleiotropic effect locus on chromosome 1p22.2 influencing risk of renal dysfunction via purine metabolism pathways in the Norfolk Island population. Further studies are now warranted to interrogate the functional relevance of this locus in terms of renal pathology and cardiovascular disease risk.


Conflict of interest statement

The authors have declared that no competing interests exist.

Figures

Fig 1
Fig 1. Venn diagram showing the inter-correlation and heritabilities of components extracted from the PCA of 37 quantitative traits.
Relationships between components were inferred either by variable overlap, or loadings on a component greater than 0.35. Heritability of each component is colour coded (as per key) with the non-significant traits being coloured white.
Fig 2
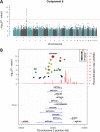
Fig 2. Manhattan plot of Chromosome 2 showing Component 6 associations.
A) shows the genome-wide associations statistics with a distinct peak on chromosome 2 for bilirubin, B) refines the location of the peak to chr2q37.1, a region containing the UDP-glucuronosyltransferase gene family well known to metabolise bilirubin (UCSC track demonstrates the numerous isoforms). The blue dotted line indicates genome-wide significance level.
Fig 3
Fig 3. Manhattan plot for Component 3 showing an association peak on chr 1p22.2.
The red dotted line indicates the study-wide M eff significance threshold.
Fig 4
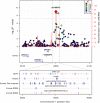
Fig 4. LocusTrack plot showing detailed annotation information of the associated chr1p22.2 region.
The significance level of association is given on the left y axis (-log10(p-value)), while genomic recombination is displayed on the right y axis. Pairwise LD between the tagging SNP and each other SNP is indicated by colour. In the bottom panel several relevant tracks of UCSC data are provided, including: evofold RNA loop prediction; ENCODE transcription factor binding sites from ChIP-SEQ, and tissue specific RRBS methylation information from liver and kidney (both relevant tissue types for the identified phenotype).
Fig 5
Fig 5. Significantly enriched pathways identified from KEGG enrichment analysis.

References

    1. Laslett LJ, Alagona P, Clark BA, Drozda JP, Saldivar F, Wilson SR, et al. The worldwide environment of cardiovascular disease: prevalence, diagnosis, therapy, and policy issues: a report from the American College of Cardiology. J Am Coll Cardiol. 2012;60: S1–49. 10.1016/j.jacc.2012.11.002 - DOI - PubMed
    1. Avery CL, He Q, North KE, Ambite JL, Boerwinkle E, Fornage M, et al. A Phenomics-Based Strategy Identifies Loci on APOC1, BRAP, and PLCG1 Associated with Metabolic Syndrome Phenotype Domains. PLoS Genet. Public Library of Science; 2011;7: e1002322. - PMC - PubMed
    1. Kraja AT, Chasman DI, North KE, Reiner AP, Yanek LR, Kilpeläinen TO, et al. Pleiotropic genes for metabolic syndrome and inflammation. Mol Genet Metab. 2014;112: 317–338. 10.1016/j.ymgme.2014.04.007 - DOI - PMC - PubMed
    1. Lowe JK, Maller JB, Pe’er I, Neale BM, Salit J, Kenny EE, et al. Genome-Wide Association Studies in an Isolated Founder Population from the Pacific Island of Kosrae. PLoS Genet. Public Library of Science; 2009;5: e1000365. - PMC - PubMed
    1. Sanna S, Li B, Mulas A, Sidore C, Kang HM, Jackson AU, et al. Fine mapping of five loci associated with low-density lipoprotein cholesterol detects variants that double the explained heritability. Gibson G, editor. PLoS Genet. Public Library of Science; 2011;7: e1002198. - PMC - PubMed

Publication types

LinkOut - more resources