

Association of Patient-Reported Readiness for Discharge and Hospital Consumer Assessment of Health Care Providers and Systems Patient Satisfaction Scores: A Retrospective Analysis
- PMID: 26474513
- PMCID: PMC4662900
- DOI: 10.1016/j.jamcollsurg.2015.09.009
Association of Patient-Reported Readiness for Discharge and Hospital Consumer Assessment of Health Care Providers and Systems Patient Satisfaction Scores: A Retrospective Analysis
Abstract
Background: Patient-reported outcomes (PRO) have been increasingly emphasized, however, determining clinically valuable PRO has been problematic and investigation limited. This study examines the association of readiness for discharge, which has been described previously, with patient satisfaction and readmission.
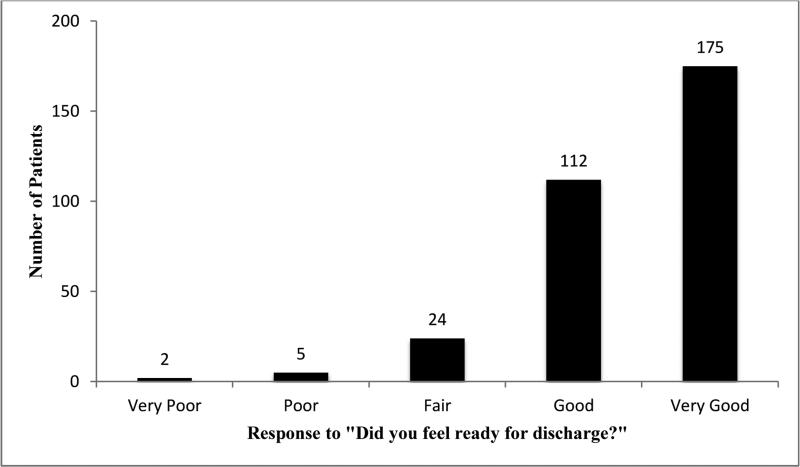
Study design: Data from adult patients admitted to our institution from 2009 to 2012 who completed both the Hospital Consumer Assessment of Healthcare Providers and Systems and the Press Ganey surveys post discharge were extracted from an existing database of patients (composed of 220 patients admitted for small bowel obstruction and 98 patients with hospital stays ≥ 21 days). Using the survey question, "Did you feel ready for discharge?" (RFD), 2 groups were constructed, those RFD and those with lesser degrees of readiness (ie, less ready for discharge [LRFD]) using topbox methodology. Outcomes, readmission rates, and satisfaction were compared between RFD and LRFD groups.
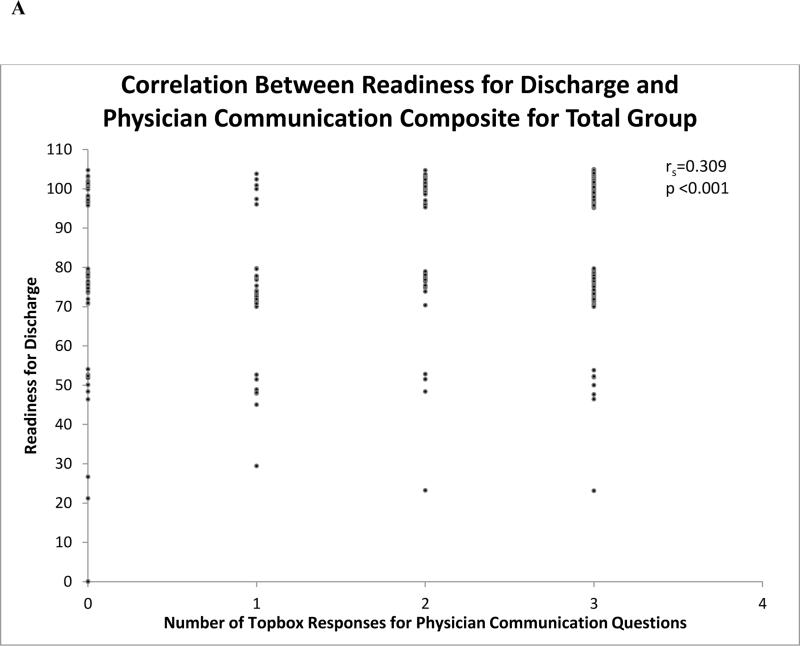
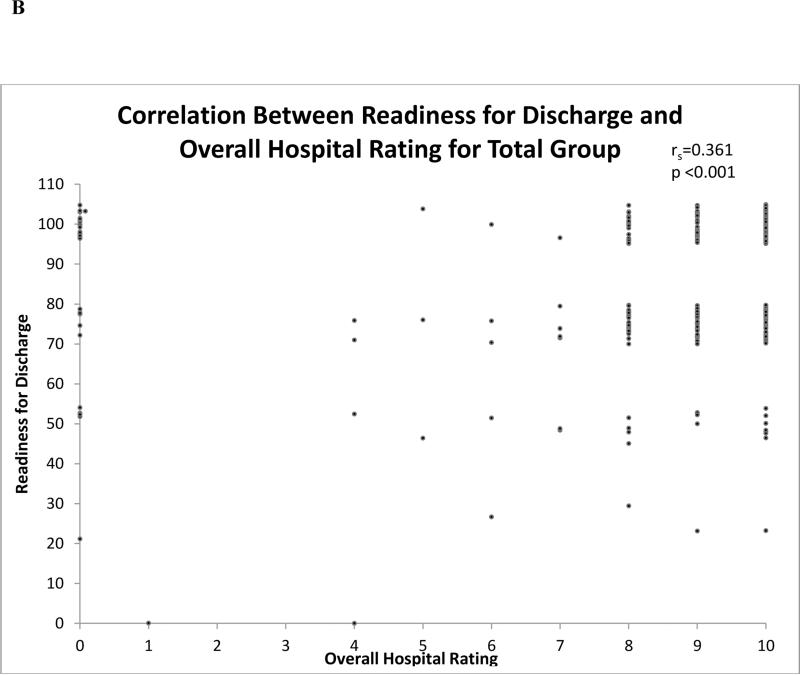
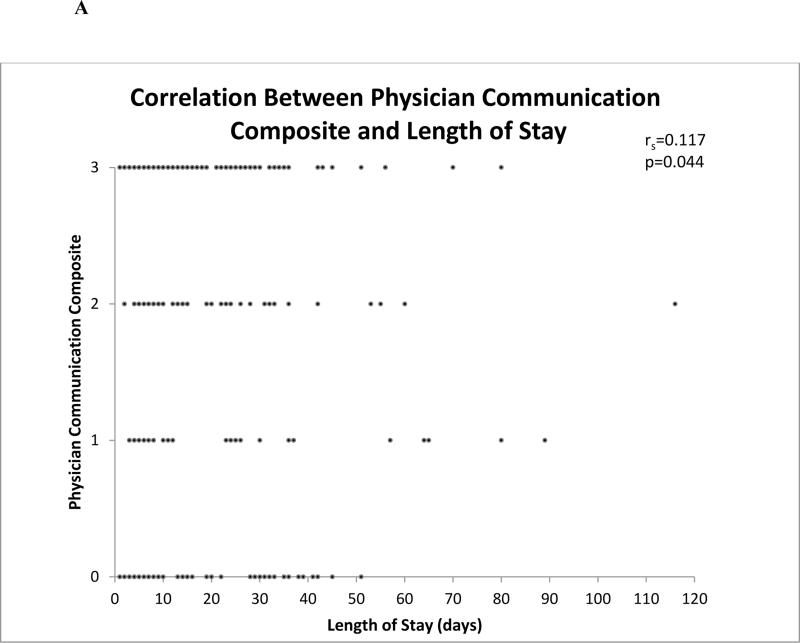
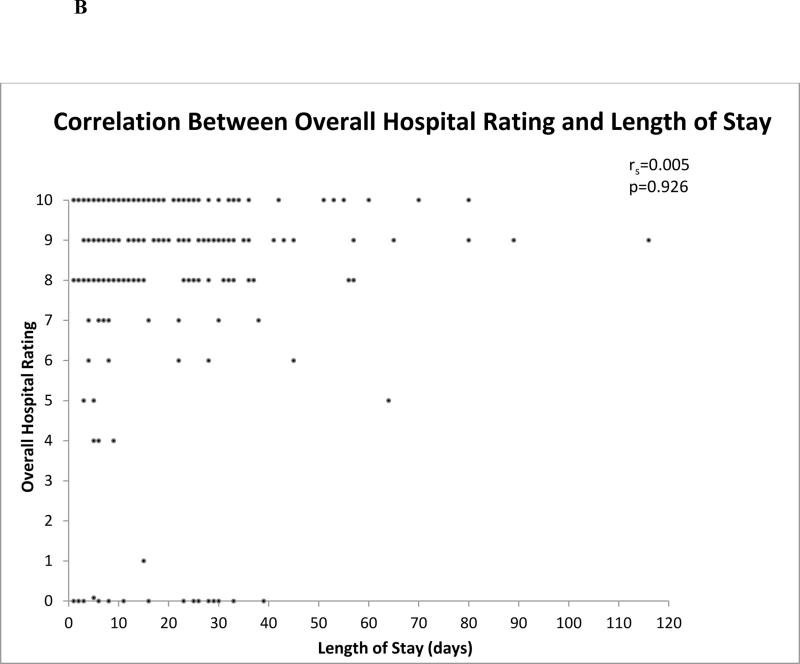
Results: Three hundred and eighteen patients met the inclusion criteria; 45% were female and 94% were Caucasian. Median age was 62.3 years (interquartile range 52.5 to 70.8 year). Median length of stay was 10 days (interquartile range 6.0 to 24.0 days) and 69.2% were admitted with small bowel obstruction. The 30-day readmission rate was 14.3% and 55% indicated they were RFD. Those RFD and LRFD had similar demographics, comorbidity scores, and rates of surgery. Those RFD had higher overall hospital satisfaction (87.3% RFD vs 62.4% LRFD; p < 0.001), higher physician communication scores (median 3.0 RFD vs 2.0 LRFD; p < 0.001), and higher nursing communication scores (median 3.0 RFD vs 2.0 LRFD, p < 0.001). Readmission rates were similar between the groups (11.4% RFD vs 18.2% LRFD; p = 0.09).
Conclusions: Readiness for discharge appears to be a clinically useful patient-reported metric, as those RFD have higher satisfaction with the hospital and physicians. Prospective investigation into variables affecting patient satisfaction in those LRFD is needed.
Copyright © 2015 American College of Surgeons. Published by Elsevier Inc. All rights reserved.
Figures
Similar articles
-
Impact of care coaching on hospital length of stay, readmission rates, postdischarge phone calls, and patient satisfaction after bariatric surgery.Surg Obes Relat Dis. 2016 Nov;12(9):1737-1745. doi: 10.1016/j.soard.2016.02.020. Epub 2016 Feb 24. Surg Obes Relat Dis. 2016. PMID: 27320222 Free PMC article.
-
Patient-Reported Discharge Readiness and 30-Day Risk of Readmission or Death: A Prospective Cohort Study.Am J Med. 2016 Jan;129(1):89-95. doi: 10.1016/j.amjmed.2015.08.018. Epub 2015 Sep 5. Am J Med. 2016. PMID: 26344631
-
Emergency department visits after lumbar spine surgery are associated with lower Hospital Consumer Assessment of Healthcare Providers and Systems scores.Spine J. 2018 Feb;18(2):226-233. doi: 10.1016/j.spinee.2017.06.043. Epub 2017 Jul 21. Spine J. 2018. PMID: 28739479
-
Effect of HCAHPS reporting on patient satisfaction with physician communication.J Hosp Med. 2016 Feb;11(2):105-10. doi: 10.1002/jhm.2490. Epub 2015 Sep 25. J Hosp Med. 2016. PMID: 26404621 Review.
-
Predictors of Patient Satisfaction in Spine Surgery: A Systematic Review.World Neurosurg. 2021 Feb;146:e1160-e1170. doi: 10.1016/j.wneu.2020.11.125. Epub 2020 Nov 28. World Neurosurg. 2021. PMID: 33253954
Cited by
-
Factors influencing patient experience in hospital wards: a systematic review.BMC Nurs. 2024 Aug 1;23(1):527. doi: 10.1186/s12912-024-02054-0. BMC Nurs. 2024. PMID: 39090643 Free PMC article.
-
Correlation between quality of discharge teaching, readiness for hospital discharge and health outcomes of hysterectomy patients: A structural equation model analysis.Nurs Open. 2023 Jun;10(6):3817-3827. doi: 10.1002/nop2.1640. Epub 2023 Feb 18. Nurs Open. 2023. PMID: 36802197 Free PMC article.
-
Association of Hospital Characteristics and Previous Hospitalization-Related Experiences with Patients' Perceptions of Hospital Care in China.Int J Environ Res Public Health. 2022 Jun 27;19(13):7856. doi: 10.3390/ijerph19137856. Int J Environ Res Public Health. 2022. PMID: 35805515 Free PMC article.
-
Assessing Patient Satisfaction With the Discharge Process Through a Patient-Centered Lens.Cureus. 2025 Jul 14;17(7):e87923. doi: 10.7759/cureus.87923. eCollection 2025 Jul. Cureus. 2025. PMID: 40809598 Free PMC article.
-
Effectiveness of nurse-led discharge service on adult surgical inpatients: A meta-analysis of randomized controlled trials.Nurs Open. 2022 Sep;9(5):2250-2262. doi: 10.1002/nop2.1268. Epub 2022 Jun 6. Nurs Open. 2022. PMID: 35661429 Free PMC article. Review.
References
-
- Transforming healthcare: IOM panel discusses vision and reality after Crossing the Quality Chasm. Qual Lett Healthc Lead. 2004;16:9–12, 1. - PubMed
-
- Kotronoulas G, Kearney N, Maguire R, et al. What is the value of the routine use of patient-reported outcome measures toward improvement of patient outcomes, processes of care, and health service outcomes in cancer care? A systematic review of controlled trials. J Clin Oncol. 2014;32:1480–1501. - PubMed
-
- Patient Reported Outcomes (PRO) in Performace Measurement. National Quality Forum; Washington, DC: Jan 10, 2013. 2013.
-
- Black N. Patient reported outcome measures could help transform healthcare. BMJ. 2013;346:f167. - PubMed
-
- Jha AK, Orav EJ, Zheng J, Epstein AM. Patients' perception of hospital care in the United States. N Engl J Med. 2008;359:1921–1931. - PubMed
Publication types
MeSH terms
Grants and funding
LinkOut - more resources
Full Text Sources
Other Literature Sources
Miscellaneous
