

Sustaining food self-sufficiency of a nation: The case of Sri Lankan rice production and related water and fertilizer demands
- PMID: 26474766
- PMCID: PMC4815756
- DOI: 10.1007/s13280-015-0720-2
Sustaining food self-sufficiency of a nation: The case of Sri Lankan rice production and related water and fertilizer demands
Abstract
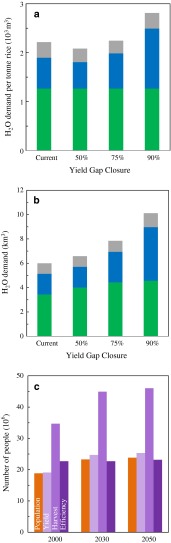
Rising human demand and climatic variability have created greater uncertainty regarding global food trade and its effects on the food security of nations. To reduce reliance on imported food, many countries have focused on increasing their domestic food production in recent years. With clear goals for the complete self-sufficiency of rice production, Sri Lanka provides an ideal case study for examining the projected growth in domestic rice supply, how this compares to future national demand, and what the associated impacts from water and fertilizer demands may be. Using national rice statistics and estimates of intensification, this study finds that improvements in rice production can feed 25.3 million Sri Lankans (compared to a projected population of 23.8 million people) by 2050. However, to achieve this growth, consumptive water use and nitrogen fertilizer application may need to increase by as much as 69 and 23 %, respectively. This assessment demonstrates that targets for maintaining self-sufficiency should better incorporate avenues for improving resource use efficiency.
Keywords: Agricultural intensification; Food security; Nitrogen runoff; Self-sufficiency; Water footprint; Water resources.
Figures

References
-
- Alexandratos N, Bruinsma J. World agriculture towards 2030/2050: The 2012 revision. Rome: FAO; 2012.
-
- Amarasinghe, U.A., L. Mutuwatta, and R. Sakthivadivel. 1999. Water scarcity variations within a country: A case study of Sri Lanka. International Water Management Institute, Research Report 32, Colombo, Sri Lanka.
-
- Amarasinghe UA, Samad M, Anputhas M. Spatial clustering of rural poverty and food insecurity in Sri Lanka. Food Security. 2005;30:493–509.
-
- Bruinsma, J. 2009. The resource outlook to 2050: By how much do land, water use and crop yields need to increase by 2050? Expert meeting on how to feed the world in 2050. Rome: FAO and ESDD. Retrieved October 20, 2014, from ftp://ftp.fao.org/docrep/fao/012/ak542e/ak542e06.pdf.
-
- Chapagain AK, Hoekstra AY. The blue, green and grey water footprint of rice production and consumption perspectives. Ecological Economics. 2011;70:749–758. doi: 10.1016/j.ecolecon.2010.11.012. - DOI
Publication types
MeSH terms
Substances
LinkOut - more resources
Full Text Sources
Other Literature Sources
