Gene expression and splicing alterations analyzed by high throughput RNA sequencing of chronic lymphocytic leukemia specimens
- PMID: 26474785
- PMCID: PMC4609092
- DOI: 10.1186/s12885-015-1708-9
Gene expression and splicing alterations analyzed by high throughput RNA sequencing of chronic lymphocytic leukemia specimens
Abstract
Background: To determine differentially expressed and spliced RNA transcripts in chronic lymphocytic leukemia specimens a high throughput RNA-sequencing (HTS RNA-seq) analysis was performed.
Methods: Ten CLL specimens and five normal peripheral blood CD19+ B cells were analyzed by HTS RNA-seq. The library preparation was performed with Illumina TrueSeq RNA kit and analyzed by Illumina HiSeq 2000 sequencing system.
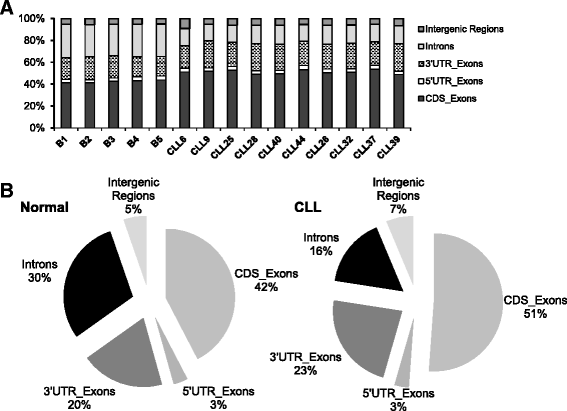
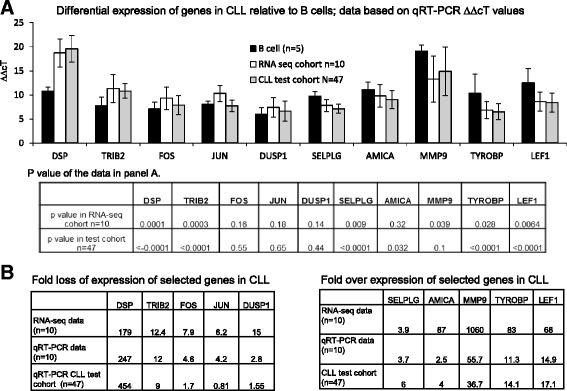
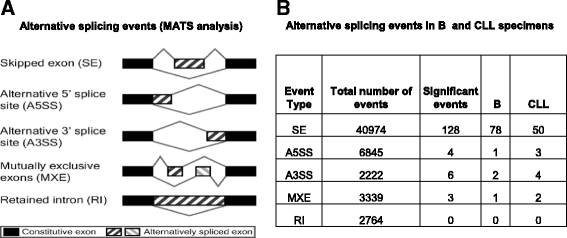
Results: An average of 48.5 million reads for B cells, and 50.6 million reads for CLL specimens were obtained with 10396 and 10448 assembled transcripts for normal B cells and primary CLL specimens respectively. With the Cuffdiff analysis, 2091 differentially expressed genes (DEG) between B cells and CLL specimens based on FPKM (fragments per kilobase of transcript per million reads and false discovery rate, FDR q < 0.05, fold change >2) were identified. Expression of selected DEGs (n = 32) with up regulated and down regulated expression in CLL from RNA-seq data were also analyzed by qRT-PCR in a test cohort of CLL specimens. Even though there was a variation in fold expression of DEG genes between RNA-seq and qRT-PCR; more than 90 % of analyzed genes were validated by qRT-PCR analysis. Analysis of RNA-seq data for splicing alterations in CLL and B cells was performed by Multivariate Analysis of Transcript Splicing (MATS analysis). Skipped exon was the most frequent splicing alteration in CLL specimens with 128 significant events (P-value <0.05, minimum inclusion level difference >0.1).
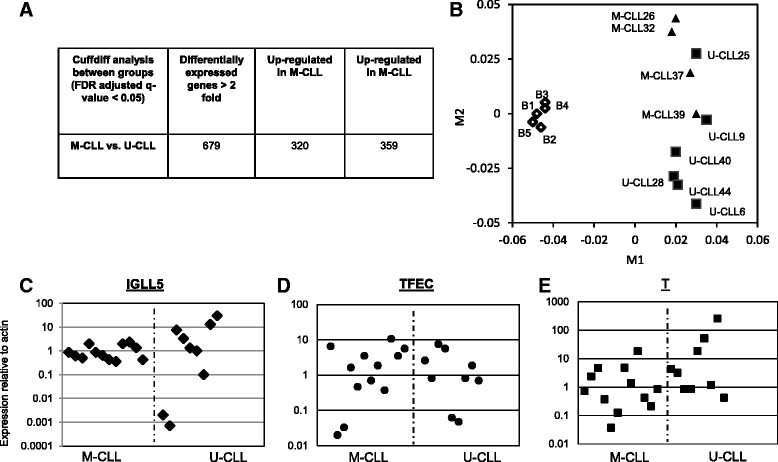
Conclusion: The RNA-seq analysis of CLL specimens identifies novel DEG and alternatively spliced genes that are potential prognostic markers and therapeutic targets. High level of validation by qRT-PCR for a number of DEG genes supports the accuracy of this analysis. Global comparison of transcriptomes of B cells, IGVH non-mutated CLL (U-CLL) and mutated CLL specimens (M-CLL) with multidimensional scaling analysis was able to segregate CLL and B cell transcriptomes but the M-CLL and U-CLL transcriptomes were indistinguishable. The analysis of HTS RNA-seq data to identify alternative splicing events and other genetic abnormalities specific to CLL is an added advantage of RNA-seq that is not feasible with other genome wide analysis.
Figures

Similar articles
-
Identification of altered cell signaling pathways using proteomic profiling in stable and progressive chronic lymphocytic leukemia.J Leukoc Biol. 2022 Feb;111(2):313-325. doi: 10.1002/JLB.4HI0620-392R. Epub 2021 Jul 20. J Leukoc Biol. 2022. PMID: 34288092
-
E-cadherin gene re-expression in chronic lymphocytic leukemia cells by HDAC inhibitors.BMC Cancer. 2013 Feb 25;13:88. doi: 10.1186/1471-2407-13-88. BMC Cancer. 2013. PMID: 23432814 Free PMC article.
-
Overlapped differentially expressed genes between acute lymphoblastic leukemia and chronic lymphocytic leukemia revealed potential key genes and pathways involved in leukemia.J Cell Biochem. 2019 Sep;120(9):15980-15988. doi: 10.1002/jcb.28876. Epub 2019 May 13. J Cell Biochem. 2019. PMID: 31081970
-
Chronic lymphocytic leukemia: a clinical and molecular heterogenous disease.Cancer Genet. 2013 Mar;206(3):49-62. doi: 10.1016/j.cancergen.2013.01.003. Epub 2013 Mar 24. Cancer Genet. 2013. PMID: 23531595 Review.
-
Decoding co-/post-transcriptional complexities of plant transcriptomes and epitranscriptome using next-generation sequencing technologies.Biochem Soc Trans. 2020 Dec 18;48(6):2399-2414. doi: 10.1042/BST20190492. Biochem Soc Trans. 2020. PMID: 33196096 Review.
Cited by
-
Differential Levels of mRNAs in Normal B Lymphocytes, Monoclonal B Lymphocytosis and Chronic Lymphocytic Leukemia Cells from the Same Family Identify Susceptibility Genes.Oncol Ther. 2021 Dec;9(2):621-634. doi: 10.1007/s40487-021-00172-2. Epub 2021 Oct 7. Oncol Ther. 2021. PMID: 34622420 Free PMC article.
-
Identification of Six Diagnostic Biomarkers for Chronic Lymphocytic Leukemia Based on Machine Learning Algorithms.J Oncol. 2022 Nov 24;2022:3652107. doi: 10.1155/2022/3652107. eCollection 2022. J Oncol. 2022. PMID: 36467501 Free PMC article.
-
Integrative Analysis of Multi-Omics Data to Identify Deregulated Molecular Pathways and Druggable Targets in Chronic Lymphocytic Leukemia.J Pers Med. 2024 Aug 6;14(8):831. doi: 10.3390/jpm14080831. J Pers Med. 2024. PMID: 39202022 Free PMC article.
-
Integrated bioinformatics analysis reveals novel key biomarkers in diabetic nephropathy.SAGE Open Med. 2022 Nov 11;10:20503121221137005. doi: 10.1177/20503121221137005. eCollection 2022. SAGE Open Med. 2022. PMID: 36385790 Free PMC article.
-
Aberrant spliceosome activity via elevated intron retention and upregulation and phosphorylation of SF3B1 in chronic lymphocytic leukemia.Mol Ther Nucleic Acids. 2024 Apr 26;35(2):102202. doi: 10.1016/j.omtn.2024.102202. eCollection 2024 Jun 11. Mol Ther Nucleic Acids. 2024. PMID: 38846999 Free PMC article.
References
-
- Damle RN, Wasil T, Fais F, Ghiotto F, Valetto A, Allen SL, Buchbinder A, Budman Dittmar K, Kolitz J, et al. Ig V gene mutation status and CD38 expression as novel prognostic indicators in chronic lymphocytic leukemia. Blood. 1999;94(6):1840–1847. - PubMed
-
- Hamblin TJ, Davis Z, Gardiner A, Oscier DG, Stevenson FK. Unmutated Ig V(H) genes are associated with a more aggressive form of chronic lymphocytic leukemia. Blood. 1999;94(6):1848–1854. - PubMed
-
- Crespo M, Bosch F, Villamor N, Bellosillo B, Colomer D, Rozman M, Marce S, Lopez-Guillermo A, Campo E, Montserrat E. ZAP-70 expression as a surrogate for immunoglobulin-variable-region mutations in chronic lymphocytic leukemia. N Engl J Med. 2003;348(18):1764–1775. doi: 10.1056/NEJMoa023143. - DOI - PubMed
Publication types
MeSH terms
LinkOut - more resources
Full Text Sources
Other Literature Sources
Molecular Biology Databases

