. 2016 Feb;63(2):538-49.
doi: 10.1002/hep.28301. Epub 2015 Dec 14.

Regulation of mechanosensitive biliary epithelial transport by the epithelial Na(+) channel

Affiliations

Regulation of mechanosensitive biliary epithelial transport by the epithelial Na(+) channel

Qin Li et al. Hepatology. 2016 Feb.

Abstract

Intrahepatic biliary epithelial cells (BECs), also known as cholangiocytes, modulate the volume and composition of bile through the regulation of secretion and absorption. While mechanosensitive Cl(-) efflux has been identified as an important secretory pathway, the counterabsorptive pathways have not been identified. In other epithelial cells, the epithelial Na(+) channel (ENaC) has been identified as an important contributor to fluid absorption; however, its expression and function in BECs have not been previously studied. Our studies revealed the presence of α, β, and γ ENaC subunits in human BECs and α and γ subunits in mouse BECs. In studies of confluent mouse BEC monolayers, the ENaC contributes to the volume of surface fluid at the apical membrane during constitutive conditions. Further, functional studies using whole-cell patch clamp of single BECs demonstrated small constitutive Na(+) currents, which increased significantly in response to fluid-flow or shear. The magnitude of Na(+) currents was proportional to the shear force, displayed inward rectification and a reversal potential of +40 mV (ENa+ = +60 mV), and were abolished with removal of extracellular Na(+) (N-methyl-d-glucamine) or in the presence of amiloride. Transfection with ENaCα small interfering RNA significantly inhibited flow-stimulated Na(+) currents, while overexpression of the α subunit significantly increased currents. ENaC-mediated currents were positively regulated by proteases and negatively regulated by extracellular adenosine triphosphate.

Conclusion: These studies represent the initial characterization of mechanosensitive Na(+) currents activated by flow in biliary epithelium; understanding the role of mechanosensitive transport pathways may provide strategies to modulate the volume and composition of bile during cholestatic conditions. (Hepatology 2016;63:538-549).


Figures

Figure 1
Figure 1. Expression and localization of ENaC in biliary epithelium
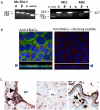
A. RT-PCR. Species specific ENaC subunit primers were used to detect ENaC subunits in all models. In human biliary Mz-Cha-1 cells, ENaC α, β, and γ were detected (band sizes of 349, 349, and 288 respectively). In mouse large cholangiocytes (MLC, left panel) and mouse small cholangiocytes (MSC, right panel) ENaCα and γ (band sizes of 424 and 427, respectively) were detected. B. Membrane localization of ENaCα protein in polarized MLC monolayers. Staining with Alexa Fluor 555 phalloidin (red), to label the cell membrane, anti-ENaCα antibody (green), and DAPI (blue), demonstrates ENaCα protein in the apical plasma membrane, right panel (x-z plane shown below each image, arrow head indicates apical membrane). Control preparations (without primary antibody), right panel. Scale bar =10μm. C. Localization of ENaCα in mouse whole liver sections. Left panel, ENaCα was expressed on the apical membrane of intrahepatic bile ducts (arrow) and hepatic artery (arrow head). Middle panel, ENaCα is also detected in hepatic sinusoids lined by endothelial cells, while the portal vein (pv) and central vein (cv), have weaker expression. Right panel, the gallbladder shows strong staining in both the apical surface of the epithelial cells as well as macrophages in the lamina propria (arrow). All images at 400x magnification.
Figure 2
Figure 2. Fluid-flow/shear activates Na+ currents
Whole-cell currents were measured during basal conditions and during exposure to flow of isotonic low Cl extracellular buffer (Methods). A. Representative whole-cell recording of Mz-Cha-1 cell. Currents measured at −100 mV and at 100 mV are shown. Flow exposure (shear of 0. 24 dyne/cm2) is indicated by the bar. Addition of amiloride (100 μM) or replacement of Na+ with NMDG is indicated by the lower bars. The I–V plot shown in the right panel was generated from the voltage-step protocol (Methods) and currents during basal (-□-) and flow-stimulated (-○-) conditions in the presence of amiloride (-△-) and with replacement of Na+ with NMDG (-●-) are shown. B. Cumulative data demonstrating maximal flow-stimulated current density in Mz-Cha-1 cells. Bars represent maximal current density (pA/pF) measured at −100 mV; n = 50 each, *p<0.01. C. Shear-dependent response curve for Na+ currents. Data were plotted from maximum current density (pA/pF) measured at −100 mV in response to different flow rates. Each point represents mean ± S.E. (n= 4-15) fit to the Hill equation. Calculated K1/2 max = 0.06 dyne/cm2. D. Cumulative data demonstrating % maximal flow-stimulated Na+ currents in the presence of amiloride (n=56) left panel; or after replacement of Na+ with NMDG (n=12), right panel. Values represent % of maximal current density measured at −100 mV. *p<0.05 and **p<0.01.
Figure 3
Figure 3. Role of ENaCα subunit in flow-stimulated Na+ currents
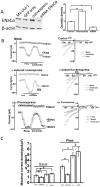
A. Representative Western blot (left panel), and cumulative data (middle) demonstrating ENaCα protein levels in cells transfected with non-targeting siRNA (scramble), and cells transfected with ENaCα siRNA. β-actin used as loading control (*p < 0.05 versus scramble levels). Right panel, relative mRNA levels, assessed by real-time PCR, in cells transfected with non-targeting siRNA (scramble) and cells transfected with ENaCα siRNA (*p < 0.05 versus scramble levels). B. Representative whole-cell current recordings from Mz-Cha-1 cells transfected with non-targeting siRNA (control), left panel, or with ENaCα siRNA, right panel, under basal and flow-stimulated conditions. Flow exposure (0.24 dyne/cm2) and amiloride application indicated by bars below the current trace. Currents measured at −100 mV and at +100 mV are shown. The I–V plots shown below the traces were generated from the step protocol (Methods) and show currents during basal (-□-), flow-stimulated (-△-) conditions, and flow-stimulated in the presence of amiloride (-□-). C. Cumulative data demonstrating maximal current density (pA/pF) measured at −100 mV under basal (constitutive) conditions and in response to flow in cells transfected with non-targeting siRNA (control), or cells transfected with ENaCα siRNA (bars represent mean ± S.E.; n=5 each). *p<0.05 versus control; **p=n.s.
Figure 4
Figure 4. Functional effects of overexpression of ENaC subunits on flow-stimulated Na+ currents
A. Representative Western blot (left panel) and cumulative data (right panel) demonstrating relative change in ENaCα protein level in control Mz-Cha-1 cells, cells transfected with non-targeting siRNA (mock), ENaCα siRNA, ENaC α subunit (overexpression), and GFP alone. β-actin used as loading control. *p<0.05 and **p<0.01 versus control protein levels. B. Representative whole cell recordings from cells transfected with non-targeting siRNA (mock, top panel), ENaCα (overexpression, middle) or ENaC α, β, and γ together (bottom panel). Flow exposure, and addition of amiloride, indicated by lines at bottom. IV plots for each transfection condition shown on the right and demonstrate currents during basal (-□-), flow (-△-), and flow in presence of amiloride (-□-) conditions. C. Cumulative data demonstrating maximal current density (pA/pF) measured at −100 mV in response to flow in cells transfected with non-targeting siRNA (non-coding, nc), ENaCα siRNA, ENaC α subunit (overexpression), and ENaCα, β, and γ subunits together under basal conditions and in response to flow (shear of 0.24 dyne/cm2 ). Bars represent mean ± S.E., n=5 – 10 each, *p<0.05 versus mock (nc), p= n.s.
Figure 5
Figure 5. Modulation of Na+ currents by proteases
Representative whole-cell recordings of Mz-Cha-1 cells in the presence or absence of trypsin or trypsin inhibitor. A. Currents in response to trypsin (10 μM) followed by flow (shear 0.24 dyne/cm2; top), and cumulative data demonstrating maximal current density measured at −100 mV during this sequential exposure (bottom). B. Top panel, currents in response to flow (shear =0.24 dyne/cm2) in the presence of trypsin inhibitor (25 μg/ml). Bottom panel, cumulative data demonstrating maximal current density at −100 mV under basal conditions, in response to trypsin inhibitor (TI), trypsin inhibitor (TI) and flow together, flow, and trypsin (20 μM); n=4 - 5 each, **p<0.05; p=n.s. C. Western blot analysis. Incubation with trypsin (10 μM) resulted in appearance of secondary band at ~37kD in addition to the full length band at ~90kD by 2 minutes (top panel); cumulative data represents relative band density of ratio of cleaved to full-length fragment after incubation with trypsin for 2 or 5 minutes, control cells treated with PBS (bottom panel); n=4-5 trials each, *p<0.05, **p<0.01 versus control.
Figure 6
Figure 6. Apical Surface Liquid (ASL) height in mouse cholangiocyte monolayers
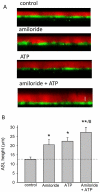
A. Representative X-Z confocal images of confluent polarized mouse cholangiocyte monolayers (green) after apical addition of Dextran-Red (red) to the apical compartment. Monolayers include control conditions (top), and after addition of amiloride (100 μM), ATP (100 μM), or amiloride and ATP together (bottom). Bar shown in bottom panel represents 10 μm. B. Cumulative data demonstrating effect of amiloride (n=8), ATP (n=8), or amiloride and ATP together (n=9) on ASL height compared to control monolayers (n=9), *p<0.05 versus control, **p<0.01 versus control, #p<0.05 versus amiloride alone.
Figure 7
Figure 7. Flow-stimulated Na+ currents are regulated by extracellular ATP
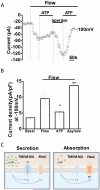
Whole-cell currents were measured during basal conditions and during exposure to flow (shear =0.24 dyne/cm2) in the absence or presence of ATP (100 μM) or apyrase (5 unit/ml). A. Representative whole-cell recording with currents measured at −100 mV and at 100 mV shown. Flow exposure (shear of 0. 24 dyne/cm2) is indicated by the top bar. Currents activated rapidly with the onset of flow and were partially inhibited when ATP was included in the perfusate as indicated by the lower line. Subsequent removal of ATP and addition of apyrase resulted in rapid activation of currents. Re-application of ATP inhibited currents. B. Cumulative data demonstrating maximal flow-stimulated current density in control conditions or in the presence of ATP, or apyrase. Values represent maximal current density measured at −100 mV (n=4-5 each), *p< 0.05 versus control, **p<0.01 versus control. C. Proposed model for the coordination of biliary epithelial secretion and absorption by extracellular ATP. According to this model, when the concentration of ATP in bile is high, TMEM16A is activated, ENaC is inhibited, and net secretion occurs. When the concentration of ATP in bile drops, TMEM16A inactivates, the inhibitory effect of ATP on ENaC is abolished, and net absorption occurs.

Similar articles

Cited by

References

    1. Fitz JG. Cellular mechanisms of bile secretion. In: Zakim D, Boyer TD, editors. Hepatology. 3 W.B. Saunders Company; Philadelphia: 1996. pp. 362–376.
    1. Fitz JG, Basavappa S, McGill J, Melhus O, Cohn JA. Regulation of membrane chloride currents in rat bile duct epithelial cells. J Clin Invest. 1993;91:319–328. - PMC - PubMed
    1. Roman RM, Feranchak AP, Salter KD, Wang Y, Fitz JG. Endogenous ATP regulates Cl− secretion in cultured human and rat biliary epithelial cells. Am J Physiol. 1999;276:G1391–G1400. - PubMed
    1. Dutta AK, Woo K, Doctor RB, Fitz JG, Feranchak AP. Extracellular nucleotides stimulate Cl-currents in biliary epithelia through receptor-mediated IP3 and Ca2+ release. Am J Physiol Gastrointest Liver Physiol. 2008;295:G1004–G1015. - PMC - PubMed
    1. Fiorotto R, Spirli C, Fabris L, Cadamuro M, Okolicsanyi L, Strazzabosco M. Ursodeoxycholic acid stimulates cholangiocyte fluid secretion in mice via CFTR-dependent ATP secretion. Gastroenterology. 2007 Nov;133(5):1603–1613. - PubMed

Publication types

Substances