. 2015 Oct;27(10):2727-42.
doi: 10.1105/tpc.15.00400. Epub 2015 Oct 16.

Cyclin-Dependent Kinase Regulation of Diurnal Transcription in Chlamydomonas

Affiliations

Cyclin-Dependent Kinase Regulation of Diurnal Transcription in Chlamydomonas

Frej Tulin et al. Plant Cell. 2015 Oct.

Abstract

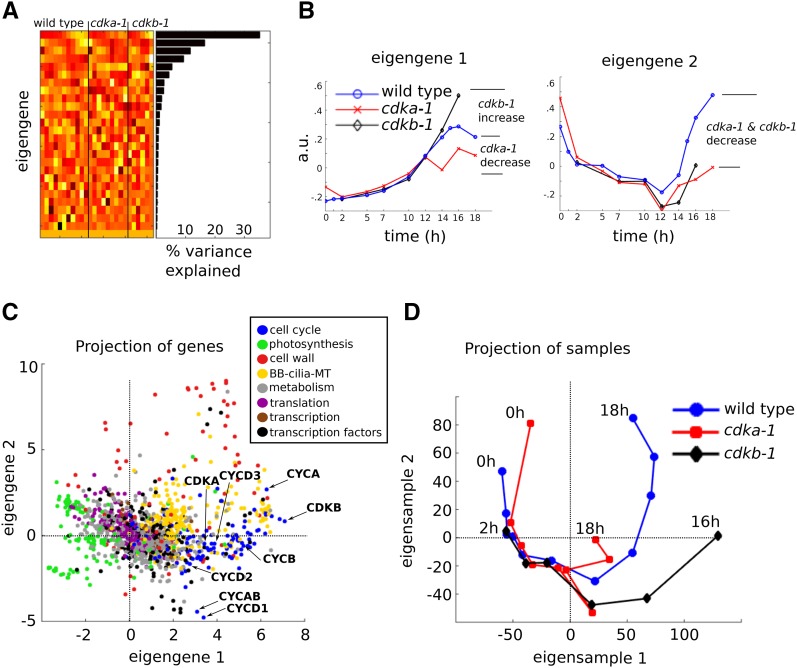
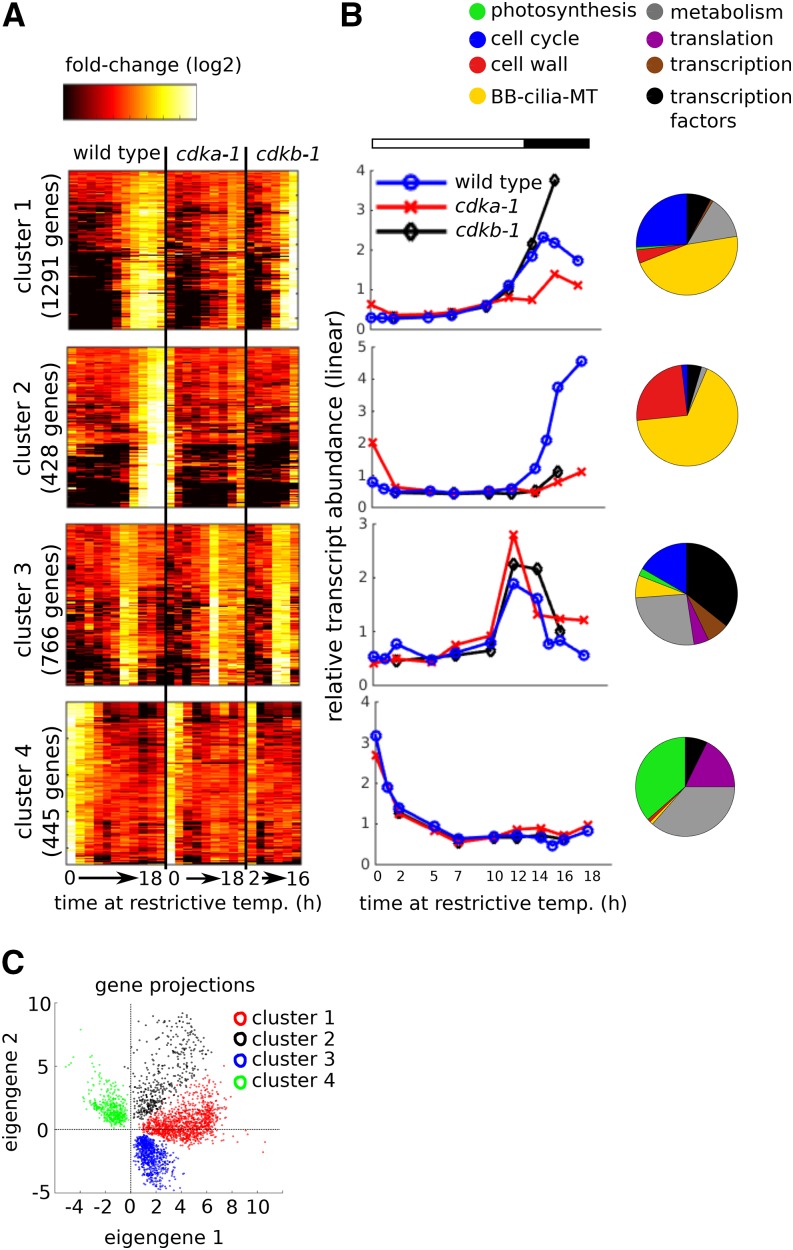
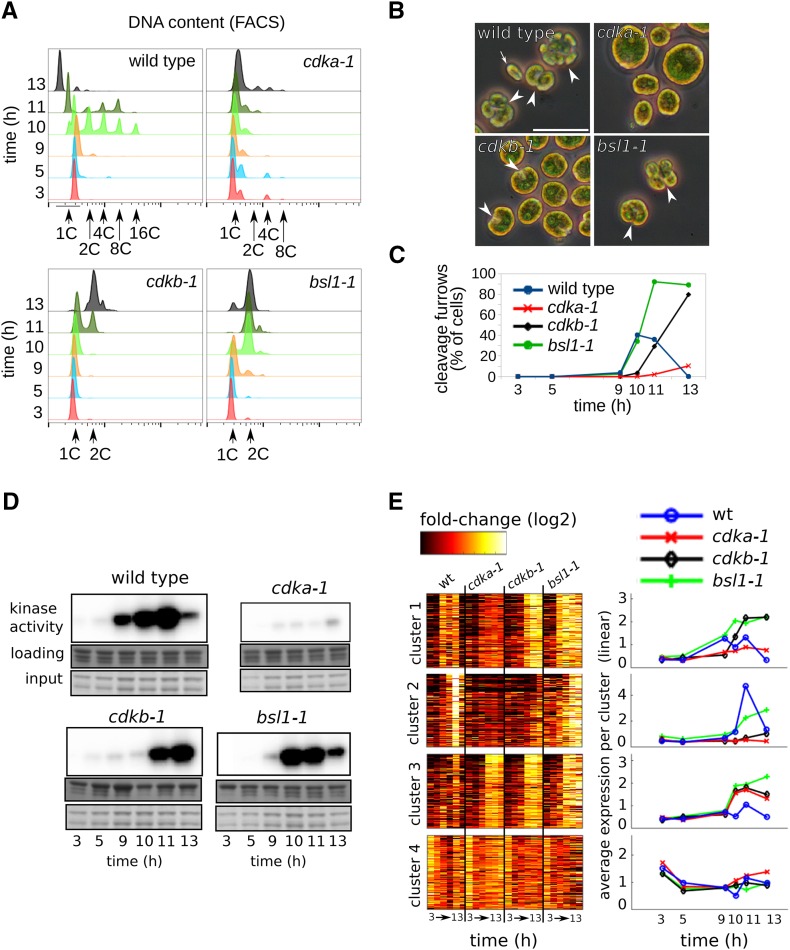
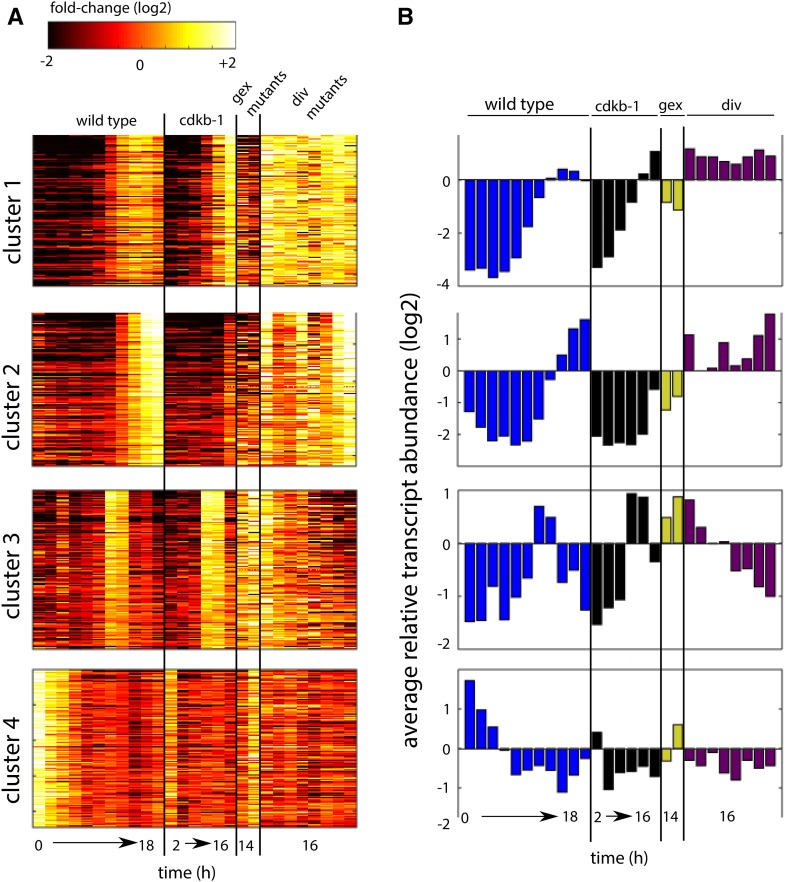
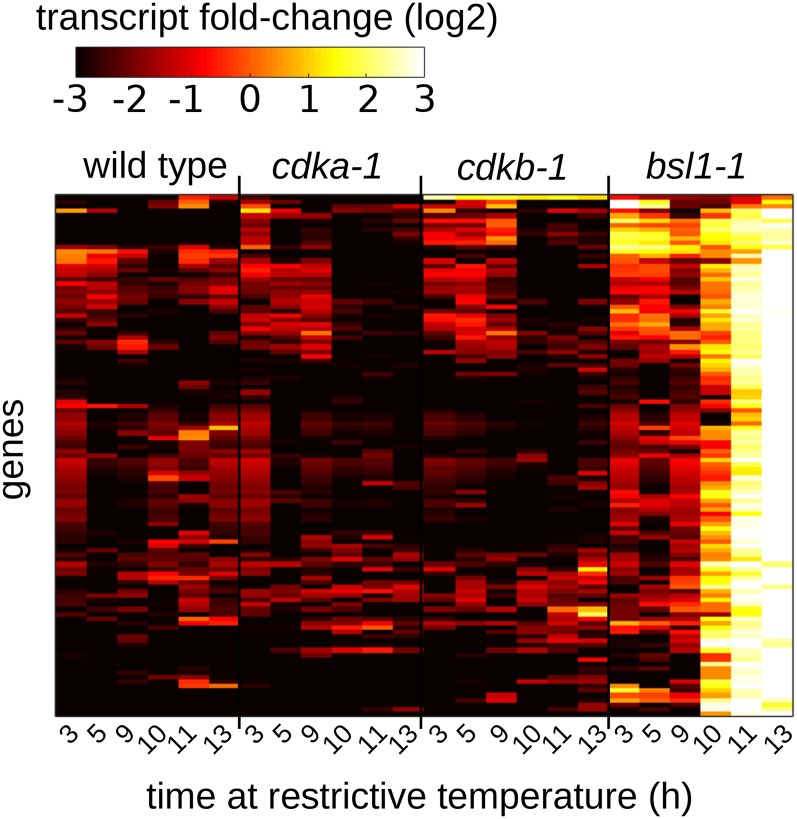
We analyzed global transcriptome changes during synchronized cell division in the green alga Chlamydomonas reinhardtii. The Chlamydomonas cell cycle consists of a long G1 phase, followed by an S/M phase with multiple rapid, alternating rounds of DNA replication and segregation. We found that the S/M period is associated with strong induction of ∼2300 genes, many with conserved roles in DNA replication or cell division. Other genes, including many involved in photosynthesis, are reciprocally downregulated in S/M, suggesting a gene expression split correlating with the temporal separation between G1 and S/M. The Chlamydomonas cell cycle is synchronized by light-dark cycles, so in principle, these transcriptional changes could be directly responsive to light or to metabolic cues. Alternatively, cell-cycle-periodic transcription may be directly regulated by cyclin-dependent kinases. To distinguish between these possibilities, we analyzed transcriptional profiles of mutants in the kinases CDKA and CDKB, as well as other mutants with distinct cell cycle blocks. Initial cell-cycle-periodic expression changes are largely CDK independent, but later regulation (induction and repression) is under differential control by CDKA and CDKB. Deviation from the wild-type transcriptional program in diverse cell cycle mutants will be an informative phenotype for further characterization of the Chlamydomonas cell cycle.


Figures

Figure 1.
Figure 1.
Culturing and Sampling Wild-Type and cdk Mutant Cells. Parallel cultures of wild type, cdka-1, and cdkb-1 were transferred to 33°C (restrictive temperature) at time zero. (A) Schematic of the Chlamydomonas mitotic cell cycle in a light/dark-synchronized culture. (B) Cell number and density by Coulter counter. (C) DNA content by FACS. Wild-type cells replicate DNA between 14 and 16 h, as indicated by an increase in ploidy. Release of daughter cells is indicated by a return to 1C DNA content (arrow, newborn). cdka-1 cells have not initiated DNA replication by 18 h. cdkb-1 cells initiate replication at 16 h and arrest after one round of DNA replication (2C). (D) Correlations of independent wild-type cDNA libraries from the same or different time points. R2 = variation explained by linear fit through the origin.
Figure 2.
Figure 2.
Differentially Expressed Genes. Wild-type cells were samples in mid-G1 (t = 5 or 7 h) and during the S/M phase (t = 16 h) in three independent experiments. (A) Differentially expressed genes were calculated by edgeR and plotted as log(fold-change) versus log(counts per million). Positive log(fold-change) indicates differential upregulation during S/M, and negative log(fold-change) indicates differential upregulation in mid-G1. Horizontal black bars represent 4-fold up- or downregulation. (B) Distribution of functional classes among differentially expressed genes, nondifferential genes, and all genes (17,741 gene models). Genes implicated in photosynthesis and metabolism are overrepresented in mid-G1. Genes implicated in cell cycle, tubulin/cilia, and cell wall are overrepresented in S/M.
Figure 3.
Figure 3.
Principal Component Analysis. Normalized read counts from wild-type, cdka-1, and cdkb-1 cDNA libraries were analyzed by PCA. (A) Heat map display of the principal components, eigengenes, arranged as rows, and the corresponding percentage of the variance explained by each eigengene. (B) Line plots of the first two eigengenes. (C) Projection of the genes on the 2D space spanned by eigengenes 1 and 2. Only genes that were assigned to one of eight functional categories are shown. Cyclins and CDKs of particular interest are marked. (D) Projections of the samples on the 2D space spanned by eigensamples 1 and 2.
Figure 4.
Figure 4.
CDK-Dependent and CDK-Independent Transcriptional Programs. (A) Clusters 1 through 4 represent major patterns of transcript accumulation during one cell cycle. Rows = genes; columns = samples. Samples are arranged from early to late for each genotype (wild type: 0, 1, 2, 5, 7, 10, 12, 14, 15, 16, and 18 h; cdka-1: 0, 2, 5, 7, 10, 12, 14, 16, and 18 h; cdkb-1: 2, 7, 10, 12, 14, and 16 h). The genes were clustered hierarchically within each cluster for improved visualization. (B) Average relative transcript abundance for each cluster plotted on a linear scale. Pie charts indicate distribution of functional classes within each cluster. (C) Projection of the genes in the four clusters onto the eigengene 1/2 subspace.
Figure 5.
Figure 5.
Cell Cycle Analysis of Plate-Grown Wild-Type and Mutant Cells. Wild-type, cdka-1, cdkb-1, and bsl1-1 mutant cells were grown in parallel on agar plates and shifted to restrictive temperature (33°C) at time zero. (A) DNA content as determined by FACS. Wild-type cells go through S/M phase at 10 to 11 h, as determined by accumulation of cells with 2, 4, 8, and 16C DNA content. Newborn cells emerge at 13 h with 1C DNA. cdka-1 fails to replicate during the course of the experiment. cdkb-1 initiate DNA replication ∼1 h after the wild type and arrest with once-replicated 2C DNA. The bsl1-1 mutant initiates DNA replication with normal timing and arrests with 2C DNA. (B) Representative micrographs of cells at the 11-h time point. White arrowheads, cleavage furrow; white arrow, newborn wild-type cell. Bar = 25 μm. (C) Quantification of cleavage furrow development. (D) Cks1-associated kinase activity. The sample for cdka-1 at 3 h was lost. (E) Transcript abundance (relative to mean for each gene) is shown on a log2 scale for clusters 1 through 4 (left panel). Average transcript abundance for each cluster and genotype is shown on a linear scale (right panel).
Figure 6.
Figure 6.
Transcript Accumulation in div and gex Mutants. (A) Transcript accumulation in the wild type and ckdb-1 (same time points as in Figure 4), the gex mutants (gex1-3 and gex26-1), and div mutants (div13-1, div20-1, div17-1, div24-1, div44-1, div39-1, div42-1, and div43-1). Genes (rows) in each cluster same as in Figure 4. (B) Average transcript abundance for each strain and time point.
Figure 7.
Figure 7.
Loss of BSL1 Is Associated with a Strong Transcriptional Response. Transcript accumulation in wild-type, cdka-1, cdkb-1, and bsl1-1 cells at the indicated times following a shift to restrictive temperature. The cell cycle arrest in bsl1-1 at 11 to 13 h (see Figure 5) is associated with strong induction of 115 genes.
Figure 8.
Figure 8.
Transcript Accumulation from Core Cell Cycle Genes. (A) Hierarchical clustering (Euclidean distance) of transcript abundance patterns of CDKA, CDKB, and six cyclins. (B) Individual traces of relative transcript abundances for each gene in wild-type, cdka-1, and cdkb-1 cells.

References

    1. Adachi S., Uchimiya H., Umeda M. (2006). Expression of B2-type cyclin-dependent kinase is controlled by protein degradation in Arabidopsis thaliana. Plant Cell Physiol. 47: 1683–1686. - PubMed
    1. Albee A.J., Kwan A.L., Lin H., Granas D., Stormo G.D., Dutcher S.K. (2013). Identification of cilia genes that affect cell-cycle progression using whole-genome transcriptome analysis in Chlamydomonas reinhardtti. G3 (Bethesda) 3: 979–991. - PMC - PubMed
    1. Alter O., Brown P.O., Botstein D. (2000). Singular value decomposition for genome-wide expression data processing and modeling. Proc. Natl. Acad. Sci. USA 97: 10101–10106. - PMC - PubMed
    1. Amon A., Tyers M., Futcher B., Nasmyth K. (1993). Mechanisms that help the yeast cell cycle clock tick: G2 cyclins transcriptionally activate G2 cyclins and repress G1 cyclins. Cell 74: 993–1007. - PubMed
    1. Anders S., Pyl P.T., Huber W. (2014). HTSeq: A Python framework to work with high-throughput sequencing data. Bioinformatics 31: 166–169. - PMC - PubMed

Publication types

MeSH terms

Substances

LinkOut - more resources