

A metric and workflow for quality control in the analysis of heterogeneity in phenotypic profiles and screens
- PMID: 26476369
- PMCID: PMC5200891
- DOI: 10.1016/j.ymeth.2015.10.007
A metric and workflow for quality control in the analysis of heterogeneity in phenotypic profiles and screens
Abstract
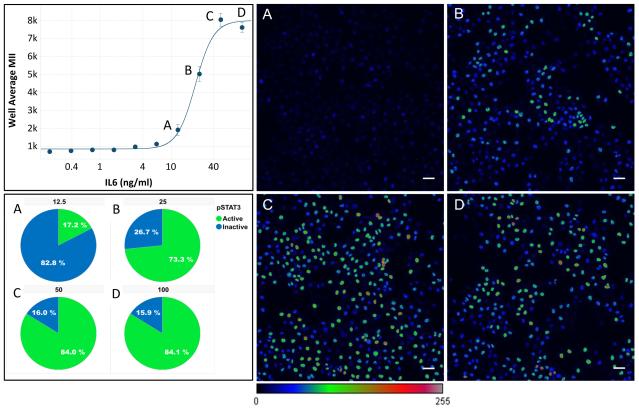
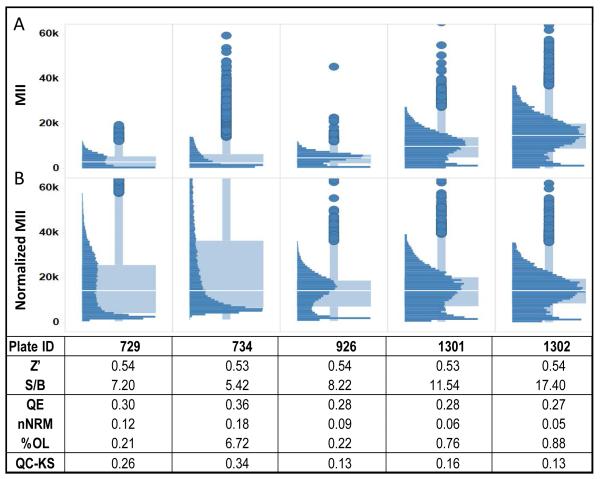
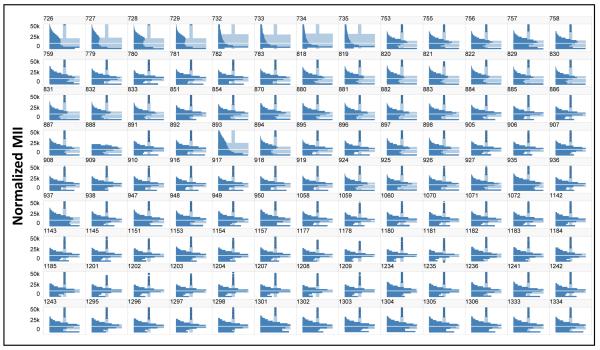
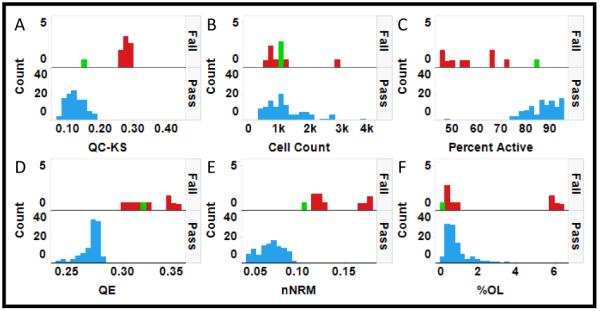
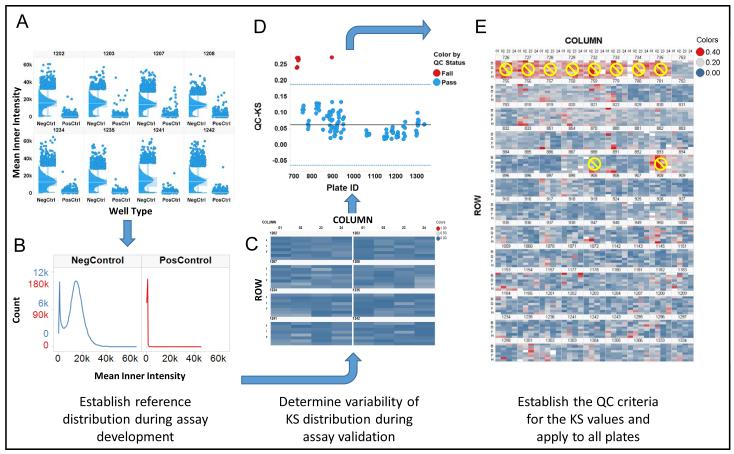
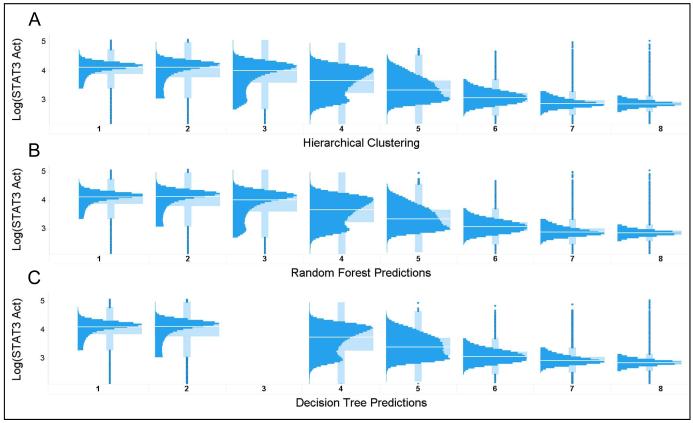
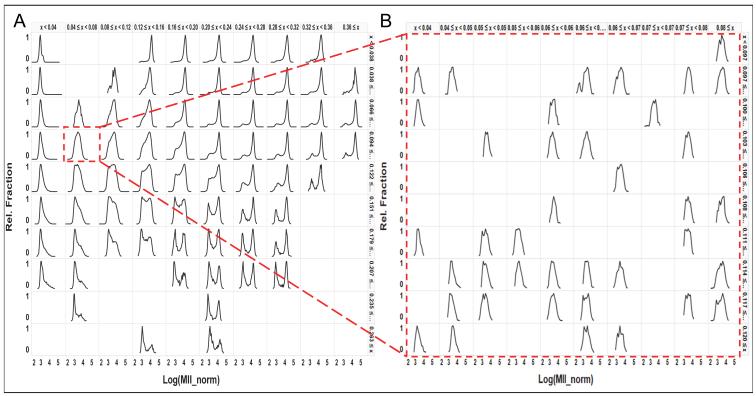
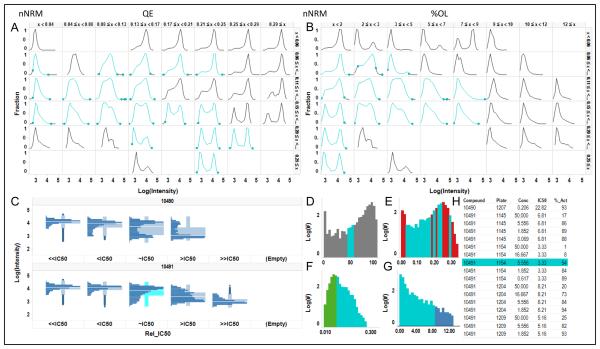
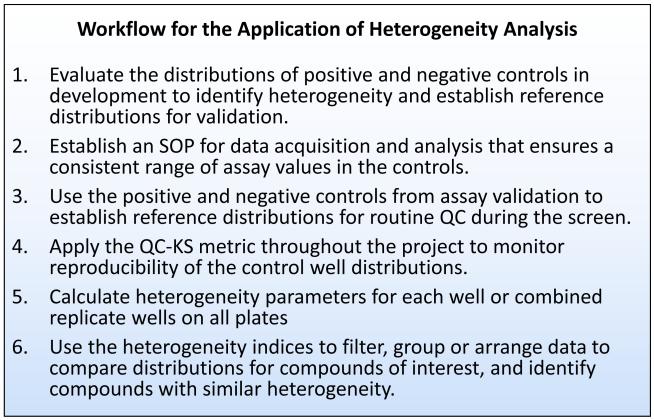
Heterogeneity is well recognized as a common property of cellular systems that impacts biomedical research and the development of therapeutics and diagnostics. Several studies have shown that analysis of heterogeneity: gives insight into mechanisms of action of perturbagens; can be used to predict optimal combination therapies; and can be applied to tumors where heterogeneity is believed to be associated with adaptation and resistance. Cytometry methods including high content screening (HCS), high throughput microscopy, flow cytometry, mass spec imaging and digital pathology capture cell level data for populations of cells. However it is often assumed that the population response is normally distributed and therefore that the average adequately describes the results. A deeper understanding of the results of the measurements and more effective comparison of perturbagen effects requires analysis that takes into account the distribution of the measurements, i.e. the heterogeneity. However, the reproducibility of heterogeneous data collected on different days, and in different plates/slides has not previously been evaluated. Here we show that conventional assay quality metrics alone are not adequate for quality control of the heterogeneity in the data. To address this need, we demonstrate the use of the Kolmogorov-Smirnov statistic as a metric for monitoring the reproducibility of heterogeneity in an SAR screen, describe a workflow for quality control in heterogeneity analysis. One major challenge in high throughput biology is the evaluation and interpretation of heterogeneity in thousands of samples, such as compounds in a cell-based screen. In this study we also demonstrate that three heterogeneity indices previously reported, capture the shapes of the distributions and provide a means to filter and browse big data sets of cellular distributions in order to compare and identify distributions of interest. These metrics and methods are presented as a workflow for analysis of heterogeneity in large scale biology projects.
Keywords: Drug discovery; Heterogeneity; High content screening; Phenotypic profiling; Systems biology.
Copyright © 2015 The Authors. Published by Elsevier Inc. All rights reserved.
Figures
Similar articles
-
Integrating Analysis of Cellular Heterogeneity in High-Content Dose-Response Studies.Methods Mol Biol. 2018;1745:25-46. doi: 10.1007/978-1-4939-7680-5_2. Methods Mol Biol. 2018. PMID: 29476461
-
Cell-based fuzzy metrics enhance high-content screening (HCS) assay robustness.J Biomol Screen. 2013 Dec;18(10):1270-83. doi: 10.1177/1087057113501554. Epub 2013 Sep 17. J Biomol Screen. 2013. PMID: 24045580
-
Identifying and quantifying heterogeneity in high content analysis: application of heterogeneity indices to drug discovery.PLoS One. 2014 Jul 18;9(7):e102678. doi: 10.1371/journal.pone.0102678. eCollection 2014. PLoS One. 2014. PMID: 25036749 Free PMC article.
-
Biologically Relevant Heterogeneity: Metrics and Practical Insights.SLAS Discov. 2017 Mar;22(3):213-237. doi: 10.1177/2472555216682725. Epub 2017 Jan 6. SLAS Discov. 2017. PMID: 28231035 Free PMC article. Review.
-
Large-scale image-based screening and profiling of cellular phenotypes.Cytometry A. 2017 Feb;91(2):115-125. doi: 10.1002/cyto.a.22909. Epub 2016 Jul 19. Cytometry A. 2017. PMID: 27434125 Review.
Cited by
-
Quality Control for Single Cell Imaging Analytics Using Endocrine Disruptor-Induced Changes in Estrogen Receptor Expression.Environ Health Perspect. 2022 Feb;130(2):27008. doi: 10.1289/EHP9297. Epub 2022 Feb 15. Environ Health Perspect. 2022. PMID: 35167326 Free PMC article.
-
Single-Cell Distribution Analysis of AR Levels by High-Throughput Microscopy in Cell Models: Application for Testing Endocrine-Disrupting Chemicals.SLAS Discov. 2020 Aug;25(7):684-694. doi: 10.1177/2472555220934420. Epub 2020 Jun 18. SLAS Discov. 2020. PMID: 32552291 Free PMC article.
-
Exploiting Analysis of Heterogeneity to Increase the Information Content Extracted from Fluorescence Micrographs of Transgenic Zebrafish Embryos.Assay Drug Dev Technol. 2017 Aug/Sep;15(6):257-266. doi: 10.1089/adt.2017.793. Epub 2017 Aug 11. Assay Drug Dev Technol. 2017. PMID: 28800244 Free PMC article.
-
Connecting Neuronal Cell Protective Pathways and Drug Combinations in a Huntington's Disease Model through the Application of Quantitative Systems Pharmacology.Sci Rep. 2017 Dec 19;7(1):17803. doi: 10.1038/s41598-017-17378-y. Sci Rep. 2017. PMID: 29259176 Free PMC article.
-
High-throughput Imaging as a versatile and unbiased discovery tool.Methods. 2016 Mar 1;96:1-2. doi: 10.1016/j.ymeth.2016.01.003. Epub 2016 Jan 13. Methods. 2016. PMID: 26774352 Free PMC article. No abstract available.
References
-
- Giuliano KA, Haskins JR, Taylor DL. Advances in high content screening for drug discovery. Assay Drug Dev Technol. 2003;1(4):565–77. - PubMed
-
- Gough A, et al. High-Content Analysis with Cellular and Tissue Systems Biology: a Bridge between Cancer Cell Biology and Tissue-Based Diagnostics. In: Mendelsohn J, et al., editors. The molecular basis of cancer. Saunders/Elsevier; Philadelphia, PA: 2015. pp. 369–392.
-
- Balluff B, et al. De novo discovery of phenotypic intratumour heterogeneity using imaging mass spectrometry. J Pathol. 2015;235(1):3–13. - PubMed
-
- Spiller DG, et al. Measurement of single-cell dynamics. Nature. 2010;465(7299):736–45. - PubMed
Publication types
MeSH terms
Substances
Grants and funding
LinkOut - more resources
Full Text Sources
Other Literature Sources
Miscellaneous
