

Directly lighting up RNA G-quadruplexes from test tubes to living human cells
- PMID: 26476445
- PMCID: PMC4787783
- DOI: 10.1093/nar/gkv1040
Directly lighting up RNA G-quadruplexes from test tubes to living human cells
Abstract
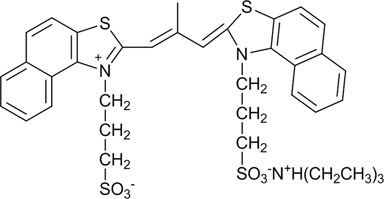
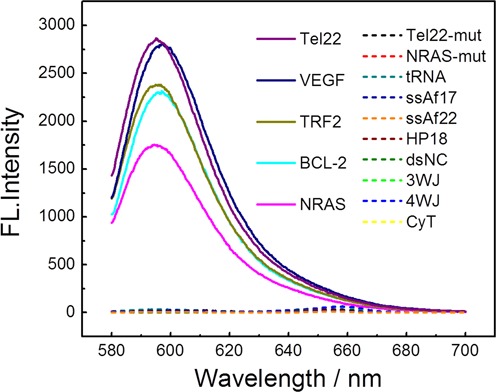
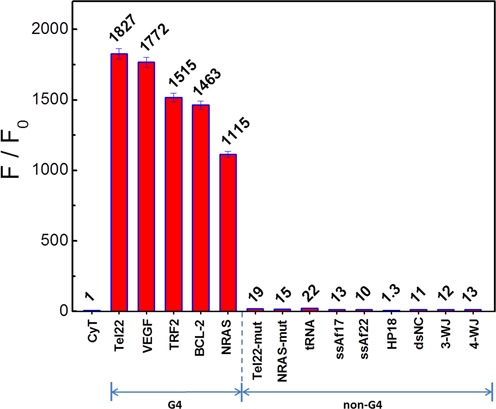
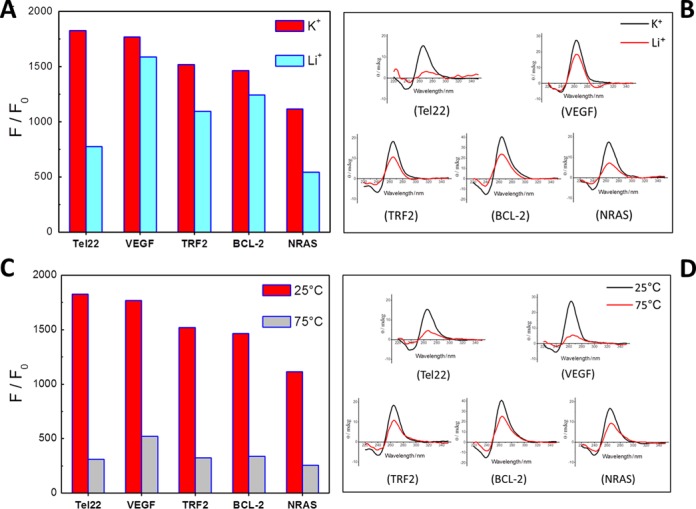
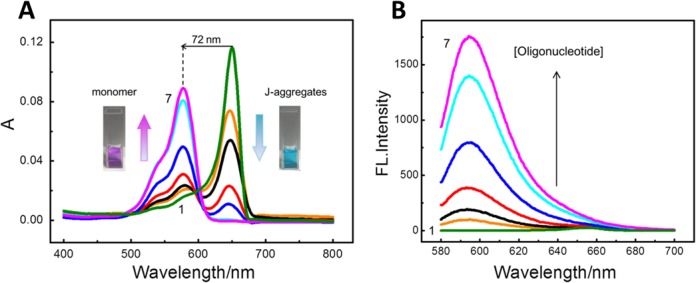
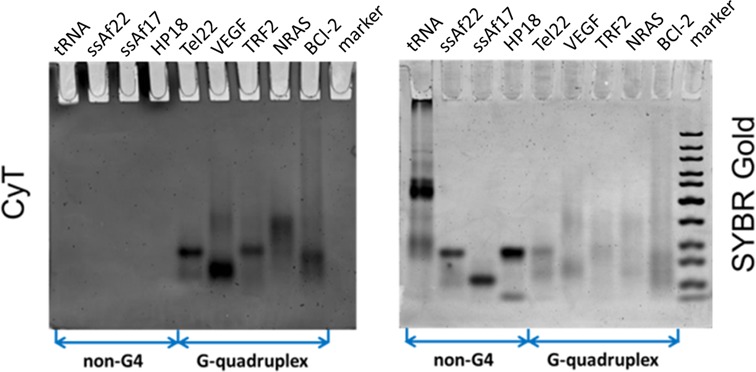
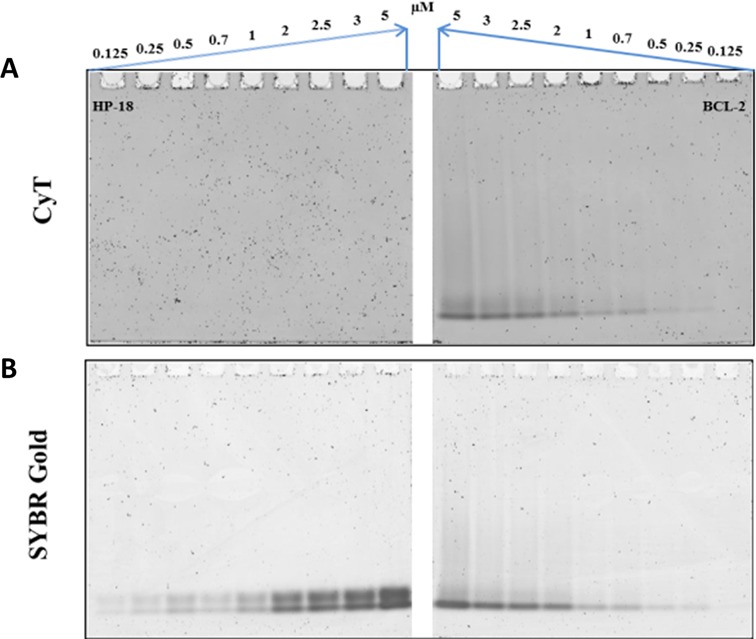
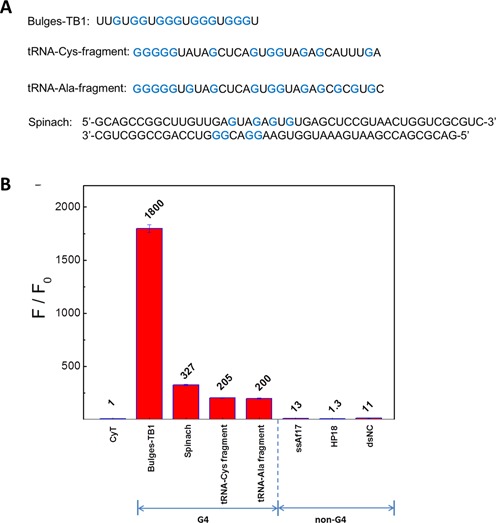
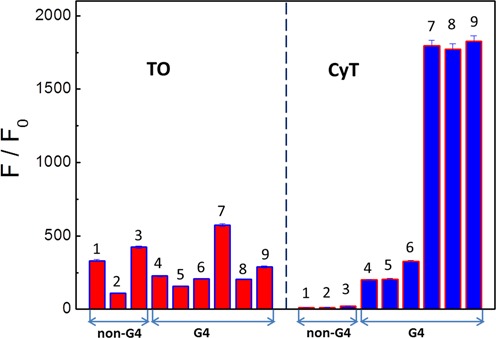
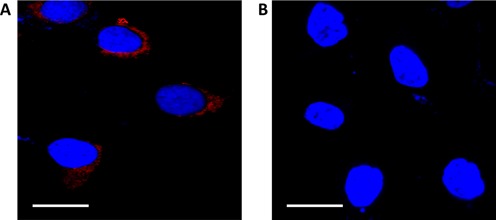
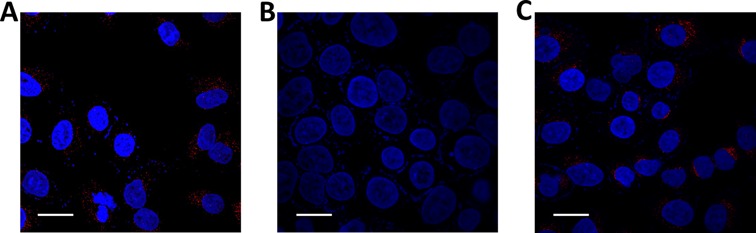
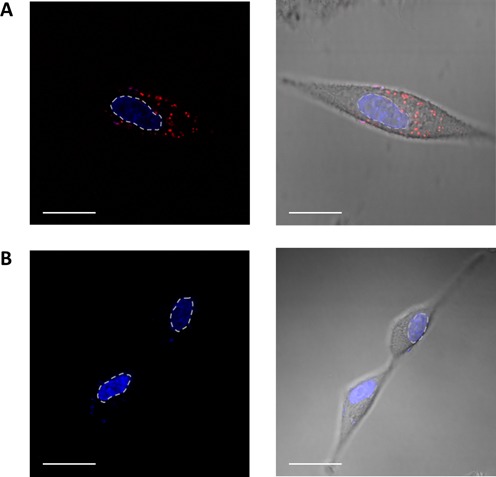
RNA G-quadruplexes (G4s) are one of the key components of the transcriptome that act as efficient post-transcriptional regulatory elements in living cells. To conduct further studies of the unique biological functions of RNA G4s, techniques need to be developed that can efficiently recognize RNA G4 structures under various conditions, in fixed cells and living cells, as well as in vitro. This paper presents the development of such a method, a new technique using a cyanine dye called CyT, which can detect both canonical and non-canonical RNA G4 structures from test tubes to living human cells. The ability of CyT to distinguish between G4 and nonG4 RNA offers a promising tool for future RNA G4-based biomarker discovery and potential diagnostic applications.
© The Author(s) 2015. Published by Oxford University Press on behalf of Nucleic Acids Research.
Figures
Similar articles
-
A benzindole substituted carbazole cyanine dye: a novel targeting fluorescent probe for parallel c-myc G-quadruplexes.Analyst. 2015 Aug 21;140(16):5772-80. doi: 10.1039/c5an00866b. Analyst. 2015. PMID: 26176020
-
A Cyanine Dye for Highly Specific Recognition of Parallel G-Quadruplex Topology and Its Application in Clinical RNA Detection for Cancer Diagnosis.J Am Chem Soc. 2024 Aug 14;146(32):22736-22746. doi: 10.1021/jacs.4c07698. Epub 2024 Jul 30. J Am Chem Soc. 2024. PMID: 39078265
-
Assessing G4-Binding Ligands In Vitro and in Cellulo Using Dimeric Carbocyanine Dye Displacement Assay.Molecules. 2021 Mar 5;26(5):1400. doi: 10.3390/molecules26051400. Molecules. 2021. PMID: 33807659 Free PMC article.
-
RNA G-quadruplexes (rG4s): genomics and biological functions.Nucleic Acids Res. 2021 Jun 4;49(10):5426-5450. doi: 10.1093/nar/gkab187. Nucleic Acids Res. 2021. PMID: 33772593 Free PMC article. Review.
-
G-quadruplexes in human promoters: A challenge for therapeutic applications.Biochim Biophys Acta Gen Subj. 2017 May;1861(5 Pt B):1399-1413. doi: 10.1016/j.bbagen.2016.12.024. Epub 2016 Dec 24. Biochim Biophys Acta Gen Subj. 2017. PMID: 28025083 Review.
Cited by
-
I-Motif/miniduplex hybrid structures bind benzothiazole dyes with unprecedented efficiencies: a generic light-up system for label-free DNA nanoassemblies and bioimaging.Nucleic Acids Res. 2020 Feb 28;48(4):1681-1690. doi: 10.1093/nar/gkaa020. Nucleic Acids Res. 2020. PMID: 31950160 Free PMC article.
-
Spontaneous formation and reversible transformation between achiral J- and chiral H-aggregates of cyanine dye MTC.RSC Adv. 2019 Apr 11;9(20):11365-11368. doi: 10.1039/c9ra00063a. eCollection 2019 Apr 9. RSC Adv. 2019. PMID: 35520237 Free PMC article.
-
Secondary structures in RNA synthesis, splicing and translation.Comput Struct Biotechnol J. 2022 May 27;20:2871-2884. doi: 10.1016/j.csbj.2022.05.041. eCollection 2022. Comput Struct Biotechnol J. 2022. PMID: 35765654 Free PMC article. Review.
-
Visualization of Parallel G-Quadruplexes in Cells with a Series of New Developed Bis(4-aminobenzylidene)acetone Derivatives.ACS Omega. 2018 Sep 30;3(9):10487-10492. doi: 10.1021/acsomega.8b01190. Epub 2018 Sep 4. ACS Omega. 2018. PMID: 30320244 Free PMC article.
-
Properties and biological impact of RNA G-quadruplexes: from order to turmoil and back.Nucleic Acids Res. 2020 Dec 16;48(22):12534-12555. doi: 10.1093/nar/gkaa1126. Nucleic Acids Res. 2020. PMID: 33264409 Free PMC article.
References
-
- Parkinson G.N., Lee M.P., Neidle S. Crystal structure of parallel quadruplexes from human telomeric DNA. Nature. 2002;417:876–880. - PubMed
Publication types
MeSH terms
Substances
LinkOut - more resources
Full Text Sources
Other Literature Sources
