. 2016 Sep;221(7):3755-86.
doi: 10.1007/s00429-015-1130-8. Epub 2015 Oct 17.

Developmental changes in the morphology of mouse hypoglossal motor neurons

Affiliations

Developmental changes in the morphology of mouse hypoglossal motor neurons

Refik Kanjhan et al. Brain Struct Funct. 2016 Sep.

Abstract

Hypoglossal motor neurons (XII MNs) innervate tongue muscles important in breathing, suckling and vocalization. Morphological properties of 103 XII MNs were studied using Neurobiotin™ filling in transverse brainstem slices from C57/Bl6 mice (n = 34) from embryonic day (E) 17 to postnatal day (P) 28. XII MNs from areas thought to innervate different tongue muscles showed similar morphology in most, but not all, features. Morphological properties of XII MNs were established prior to birth, not differing between E17-18 and P0. MN somatic volume gradually increased for the first 2 weeks post-birth. The complexity of dendritic branching and dendrite length of XII MNs increased throughout development (E17-P28). MNs in the ventromedial XII motor nucleus, likely to innervate the genioglossus, frequently (42 %) had dendrites crossing to the contralateral side at all ages, but their number declined with postnatal development. Unexpectedly, putative dendritic spines were found in all XII MNs at all ages, and were primarily localized to XII MN somata and primary dendrites at E18-P4, increased in distal dendrites by P5-P8, and were later predominantly found in distal dendrites. Dye-coupling between XII MNs was common from E18 to P7, but declined strongly with maturation after P7. Axon collaterals were found in 20 % (6 of 28) of XII MNs with filled axons; collaterals terminated widely outside and, in one case, within the XII motor nucleus. These results reveal new morphological features of mouse XII MNs, and suggest that dendritic projection patterns, spine density and distribution, and dye-coupling patterns show specific developmental changes in mice.

Keywords: Axon collateral; Dendritic morphology; Dye-coupling; Postnatal development; Respiration; Spine.


Conflict of interest statement

All authors declare that there are no known or potential conflict of interest including any financial, personal or other relationships with other people or organizations within three years of beginning the submitted work that could inappropriately influence, or be perceived to influence, their work. Support and grant information Funded by the Australian National Health and Medical Research Council project Grants 569827 and APP1065884 (MCB, PGN), and 569680 (PGN), the Motor Neurone Disease Research Institute of Australia (MCB, PGN), the Australian Brain Foundation (MCB) and the Clive and Vera Ramaciotti Foundation (MCB). MJF was supported by an Australian Postgraduate Award. Funding bodies had no involvement in study design; in the collection, analysis and interpretation of data; in the writing of the report; and in the decision to submit this article for publication.

Figures

Fig. 1
Fig. 1
Schematic illustration of an electrophysiological recording protocol for semi-loose seal Neurobiotin electroporation (a), with the labeled XII MN firing action currents (downward deflections of the current trace) during electroporation by square voltage steps (50 mV steps of 500 ms duration, voltage trace) which depolarize the MN and cause repetitive firing. After recording, electroporation and fixation, the subsequent immunofluorescence reaction produces recovery of a single labeled HM, whose soma is located within 50 μm of the surface of the transverse brainstem tissue slice used for recording. This is illustrated as a flat cylinder at low magnification in b and shows a transverse orientation of its full dendritic arborization that is complete within the slice. The cell is shown at higher magnification in the sagittal plane in c and in the traverse plane in d. The step-like changes in dendrite morphology in c are due to the finite step size of the confocal stack used for morphological reconstruction with Neurolucida software. The completely reconstructed dendritic arbor of the same XII MN in b and c, shown projected onto the transverse plane in d, is entirely contained within the boundaries of the ipsilateral hypoglossal motor nucleus (dashed outline)
Fig. 2
Fig. 2
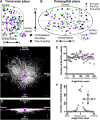
Location within the hypoglossal motor nucleus and characteristics of individually labeled XII motor neurons from mice aged E17–P28. a Schematic outline of the right hypoglossal motor nucleus in the transverse plane, divided into dorsal, ventromedial and ventrolateral sectors; the projected location of each recorded XII MN is shown by symbols according to age group (E17–P3 as diamond, P4–13 as square, P14–28 as circle), while symbols with a superimposed white ‘+’ denote XII MNs with dye-coupling and symbols with a superimposed white ‘×’ denote XII MNs with dendrites crossing the midline to the contralateral brainstem. b Schematic outline of the right hypoglossal motor nucleus in the parasagittal plane, divided into dorsal and ventral sectors and rostral/median/caudal sectors by dashed lines, with all labeled XII MNs from (a) projected onto their rostro-caudal position within the motor nucleus. c Transverse view of the superimposed wire filament reconstructions of the dendrites of all XII MNs in the study, radiating from a single point (the MN soma, purple/filled circle in center c and d). d The same superimposed wire filament reconstructions of all XII MNs in the study, in a view which is orthogonal to that of c; it can be noted that the rostro-caudal projections of dendrites (noted by the proximal and distal z positions) is very restricted in XII MNs. e Plot of the number of dendritic terminal points (end of each dendritic branch) which terminated within successive polar sectors of 5° around the soma of all XII MNs in the study in the transverse plane; the data have been fitted with a straight line by linear regression (dashed line), whose slope was not significantly different to 0. f Similar plot of the dendritic terminal points in the sagittal plane of all XII MNs in the study; by contrast to the uniformly random terminal positions in the transverse plane (e), the distribution of dendrite terminals in the rostro-caudal axis is spatially restricted in XII MNs. Scale bars c and d = 100 µm
Fig. 3
Fig. 3
No significant morphological differences were found between E17–E18 and P0 XII MNs. a, b The branching morphology of an E17 and a P0 XII MN at low magnification, respectively. c, d The morphology of typical distal dendrites, including spines (indicated by arrows), of an E17 and P0 XII MN at high magnification, respectively. ej Scatter plots of morphological measurements (somatic volume, total dendritic length, individual dendritic tree length, somatic spines, proximal spines and distal spines) from all E17–E18 and P0 XII MNs, with the mean measurement for each age group and standard deviation (SD) superimposed; no measurement showed a significant difference between E17 and E18 (n = 10) and P0 (n = 8) XII MNs; unpaired two-tailed Students’ t test, P > 0.05. Scale bars a and b 100 µm, c 5 µm
Fig. 4
Fig. 4
Developmental changes in XII MN somata between E17 and P28. ad High magnification images of the cell soma and proximal dendrites of typical XII MNs from mice aged P0, P7, P15 and P24, respectively. eh Scatterplots of morphological measurements (somatic volume, somatic surface area, major and minor somatic axis length) from all E17–P0, P1–P4, P5–P8, P9–P13 and P14–P28 XII MNs, with the mean measurement for each age group and 95 % confidence interval (CI) superimposed; a dashed line shows the mean parameter value at birth. Significant increases with increasing age were seen for somatic volume and surface area, and major somatic axis length, but not for minor somatic axis length; one-way ANOVA with age group variable, with Tukey’s multiple comparison between all age groups (*P < 0.05, **P < 0.01, ***P < 0.001). Scale bar 10 µm
Fig. 5
Fig. 5
Dendritic length increases during postnatal development. ad Low power images of the typical dendritic branching of XII MNs from mice aged E18, P6, P13 and P27, respectively; dorsal (D) and lateral (L) directions are indicated by arrows, the midline is indicated by a dashed straight line (in ad), the central canal (CC) by a dashed circle (in a, d) and the boundary of the XII motor nucleus by a dashed line (in a, d), when they fell within the image boundary. e, f Scatterplots of dendritic measurements (total dendrite length per cell, and length of individual dendrites) from all E17–P0, P1–P4, P5–8, P9–P13 and P14–P28 XII MNs, with the mean measurement for each age group and 95 % confidence interval (CI) superimposed; a dashed line shows the mean parameter value at birth. A significant increase in total dendritic length was present between E17–P0 and P5–P8, P9–P13 and P14–P28 age groups, and in individual dendrite length between E17–P0 and P14–P28 age groups. One-way ANOVA with age group variable, with Tukey’s multiple comparison post-test. Scale bars for ad 100 μm; *P < 0.05 and **P < 0.01
Fig. 6
Fig. 6
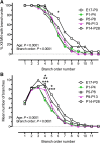
The % of XII MNs with higher dendritic branch orders and the number of dendrite branches per branch order increased with age. a The % of XII MNs with increasing levels of dendrite branch order; all MNs at all ages had 1st and 2nd order dendrites, while 3rd and 4th order dendrites were present in all P14–P28 MNs, which also showed a significantly higher percentage of MNs with 6th order dendrites, compared to E17–P0 MNs (two-way ANOVA with variables of age group and branch order number, Tukey’s multiple comparison test, P < 0.05 for E17–P0). b The mean number of dendrites for each branch order in each age group studied. The number of dendrites increased up to 3rd order branches and then declined with increasing branch order and MNs from the P14–P28 age group had more dendrites in the 4th and 5th branch orders, compared with both E17–P0 and P1–P4, and P5–P8 MNs had more 4th order branches compared to P1–P4 MNs (two-way ANOVA with variables of age group and branch order number, Tukey’s multiple comparison test. *P < 0.05, **P < 0.01, ***P < 0.001)
Fig. 7
Fig. 7
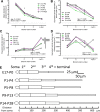
The total and individual branch order lengths of XII MNs increased with age. a Mean total branch length for each branch order in each age group, which significantly increased with age; the total length of 4th order branches was significantly greater at P9–P13 (**P < 0.01) and P14–P28 (***P < 0.001), compared to E17–P0. b The mean branch length of individual dendrites, which also increased with age; the length of 4th branch order dendrites increased (E17–E18 compared with P9–P13, ***P < 0.01, as did the length of 6th branch order dendrites (E17–E18 compared with P14–P28, *P < 0.05). Two-way ANOVA with variables of age group and branch order number, Tukey’s multiple comparison post-test for both data sets. c Dendrograms constructed from the mean branch lengths for XII MNs in each age group, for all branch orders that had at least 3 MNs with dendrites of that branch order
Fig. 8
Fig. 8
Equivalent cylinder parameter measurements for 1st to 3rd order branches and a terminal branch (sum of all 4th and higher order branches). a The mean diameter of all single branches for the 1st, 2nd, 3rd and terminal branches, for all age groups studied; branch diameter varied significantly with age and branch order, and the mean diameter of 2nd order branches was significantly increased for P5–P8, compared to P1–P4 XII MNs. b The equivalent cylinder diameter (being the single branch diameter × the number of branches for a given branch order) for the same branch orders as a, for all age groups; equivalent cylinder diameter varied significantly with both age group and branch order. c The equivalent cylinder length for the same branch orders as a, for all age groups; equivalent cylinder length varied significantly with both age group and branch order, with significant increases in the length of the equivalent cylinder for the terminal branch from E17–P0 to P9–P13 and P14–P28 (****P < 0.0001 for both), from P1–P4 to P14–P28 (**P < 0.01), and from P5–P8 to P14–P28 (*P < 0.05). d The equivalent cylinder surface area for the same branch orders as a; surface area varied significantly with branch order but not age group. Two-way ANOVA with age group and branch order as variables, Tukey’s multiple comparison post-test for all measurements. e The mean developmental changes in XII MN soma major and minor axes (represented as ellipses), and of 1st, 2nd, 3rd, and terminal branches, proportionally represented as single equivalent cylinders, for the 5 age groups analyzed in this study
Fig. 9
Fig. 9
The presence of XII MN dendrites crossing the midline to the contralateral brainstem and dye-coupling between XII MNs decreases with developmental age. a The number of XII MNs (left Y axis) and the % of XII MNs with contralateral dendrites or dye-coupling in each age group. b An example of an XII MN from a P21 mouse, with dendrites crossing the midline (shown by dashed line and arrow indicating the central canal). c An example of soma–soma dye-coupling; it is the maximum intensity projection of a confocal z-stack with the somata of the Neurobiotin-filled cell (Fc) and of a single dye-coupled neuron (1) from a P0 mouse, with the two somata in close proximity. d An example of dendro-dendritic dye-coupling; it is the maximum intensity projection of a confocal z-stack with the somata of the Neurobiotin-filled cell (Fc) and of 5 dye-coupled neurons (1, 2, 3, 4, 5) from a P8 mouse, with dendrites as the only points of contact between the labeled cell and all dye-coupled MNs. Scale bars c 50 µm, d 20 µm
Fig. 10
Fig. 10
Spine number and distribution change through the postnatal developmental period. a, c, e Examples of somatic and proximal dendrite spines, at P0, P6 and P19, respectively. b, d, f Examples of distal dendrite spines at P0, P6 and P19, respectively. g The total number of spines present on the soma, proximal dendrites and distal dendrites of all XII MNs in this study; the number of spines increases throughout development to P5–P8 and then remains stable. Total spine number at P5–P8, P9–P13 and P14–P28 age groups was significantly larger than at either E17–P0 or P1–4 age groups. By contrast, the total number of spines present on the soma (h) was relatively stable throughout development. The number of spines on proximal dendrites (i) was increased significantly at P5–P8 compared to all other age groups, as well as at P14–P28, compared to E17–P0. j The total number of spines on distal dendrites, which increased significantly from both E17–P0 and P1–P4 to all of P5–P8, P9–P13 and P14–P28 groups, and was also significantly increased from P5–P8 to P9–P13. One-way ANOVA with Tukey’s post-test; *P < 0.05, **P < 0.01, ***P < 0.001 or ****P < 0.0001 for comparisons. Scale bars a 10 µm (applies to c and e), b 1 µm (applies to d and f)
Fig. 11
Fig. 11
Axon and axon collaterals of a XII MN from a P10 mouse. a The flattened 2D computer reconstruction of the soma, dendrites, axon and axon collaterals of a single XII MN, projected onto a transverse brainstem section labeled with landmarks (4th V 4th ventricle, AmbC ambiguus compactus, dsc dorsal spinocerebellar tract, ECu external cuneate nucleus, Gi gigantocellular reticular nucleus, IO inferior olive, Lrt lateral reticular nucleus, Pa5 paratrigeminal nucleus, Sp5l spinal trigeminal nucleus, interpolar part, SpVe spinal vestibular nucleus, XII XII motor nucleus); the areas outlined by the dashed boxes labeled bf are shown as photomicrographs in panels bf. b A low power confocal image of the XII MN depicted in a, showing the soma with an axon (dark circle top right) arising directly from it, which later gives rise to axon collaterals projecting ipsilaterally (dark arrowhead) and contralaterally (white arrowhead and white circle) within the area outlined in the box labeled d; the ipsilateral collateral branch has a terminal field (white diamond) within the area outlined in the box labeled c. c A high power confocal image of a portion of the ipsilateral axon collateral (labeled with dark arrowhead) within box c, which shows terminal branches (labeled with white diamond) in the region of AmbC. d A high power confocal image of the area within box d, showing ipsilateral (dark arrowhead) and contralateral (white arrowhead and white circle) axon collaterals arising from the main axon (dark dot). e A high power confocal image of the collateral marked with a white circle in b and d as the collateral crosses the midline (indicated by a vertical black dashed line). f A high power confocal image of the collateral marked with a white circle in b and d, and a further branch (marked with white diamond) in the reticular formation of the contralateral brainstem. Scale bars = 100 μm in a, b; and 25 μm in cf

Similar articles

Cited by

References

    1. Aldes LD. Subcompartmental organization of the ventral (protrusor) compartment in the hypoglossal nucleus of the rat. J Comp Neurol. 1995;353(1):89–108. doi: 10.1002/cne.903530109. - DOI - PubMed
    1. Altschuler SM, Bao X, Miselis RR. Dendritic architecture of hypoglossal motoneurons projecting to extrinsic tongue musculature in the rat. J Comp Neurol. 1994;342:538–550. doi: 10.1002/cne.903420404. - DOI - PubMed
    1. Alvarez VA, Sabatini BL. Anatomical and physiological plasticity of dendritic spines. Annu Rev Neurosci. 2007;30:79–97. doi: 10.1146/annurev.neuro.30.051606.094222. - DOI - PubMed
    1. Arellano JI, Espinosa A, Fairen A, Yuste R, DeFelipe J. Non-synaptic dendritic spines in neocortex. Neuroscience. 2007;145(2):464–469. doi: 10.1016/j.neuroscience.2006.12.015. - DOI - PubMed
    1. Babic N, Mettenleiter TC, Flamand A, Ugolini G. Role of essential glycoproteins gII and gp50 in transneuronal transfer of pseudorabies virus from the hypoglossal nerves of mice. J Virol. 1993;67(7):4421–4426. - PMC - PubMed

Publication types

LinkOut - more resources