. 2016 Feb:54:244-58.
doi: 10.1016/j.jmbbm.2015.09.027. Epub 2015 Nov 11.

On intrinsic stress fiber contractile forces in semilunar heart valve interstitial cells using a continuum mixture model

Affiliations

On intrinsic stress fiber contractile forces in semilunar heart valve interstitial cells using a continuum mixture model

Yusuke Sakamoto et al. J Mech Behav Biomed Mater. 2016 Feb.

Abstract

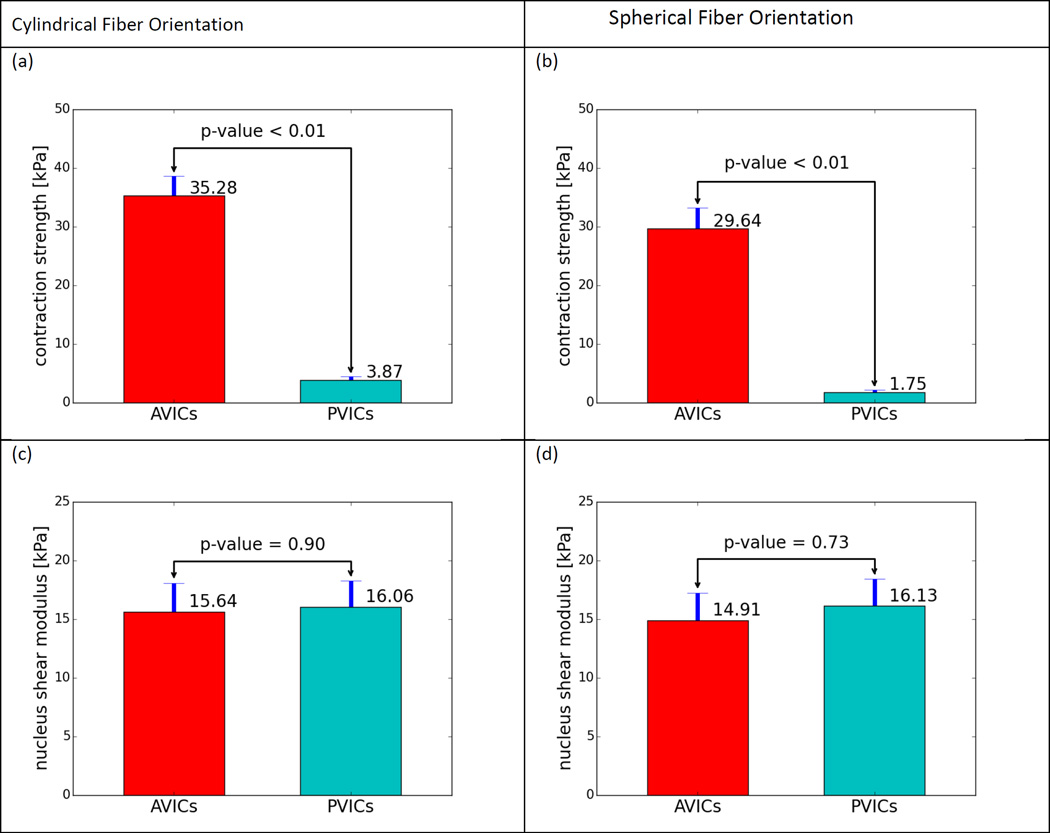
Heart valve interstitial cells (VICs) play a critical role in the maintenance and pathophysiology of heart valve tissues. Normally quiescent in the adult, VICs can become activated in periods of growth and disease. When activated, VICs exhibit increased levels of cytokines and extracellular matrix (ECM) synthesis, and upregulated expression and strong contraction of α-smooth muscle actin (α-SMA) fibers. However, it remains unknown how expression and contraction of the α-SMA fibers, which vary among different VIC types, contribute to the overall VIC mechanical responses, including the nucleus and cytoskeleton contributions. In the present study, we developed a novel solid-mixture model for VIC biomechanical behavior that incorporated 1) the underlying cytoskeletal network, 2) the oriented α-SMA stress fibers with passive elastic and active contractile responses, 3) a finite deformable elastic nucleus. We implemented the model in a full 3D finite element simulation of a VIC based on known geometry. Moreover, we examined the respective mechanical responses of aortic and pulmonary VICs (AVICs and PVICs, respectively), which are known to have different levels of α-SMA expression levels and contractile behaviors. To calibrate the model, we simulated the combined mechanical responses of VICs in both micropipette aspiration (MA) and atomic force microscopy (AFM) experiments. These two states were chosen as the VICs were under significantly different mechanical loading conditions and activation states, with the α-SMA fibers inactivated in the MA studies while fully activated in the AFM studies. We also used the AFM to study the mechanical property of the nucleus. Our model predicted that the substantial differences found in stiffening of the AVIC compared to the PVICs was due to a 9 to 16 times stronger intrinsic AVIC α-SMA stress fiber contractile force. Model validation was done by simulating a traction force microscopy experiment to estimate the forces the VICs exert on the underlying substrate, and found good agreement with reported traction force microscopy results. Further, estimated nuclear stiffness for both AVICs and PVICs were similar and comparable to the literature, and were both unaffected by VIC activation level. These results suggest substantial functional differences between AVICs and PVICs at the subcellular level. Moreover, this first VIC computational biomechanical model is but a first step in developing a comprehensive, integrated view of the VIC pathophysiology and interactions with the valve ECM micro-environment based on simulation technologies.

Keywords: Active contraction; Alpha-SMA stress fibers; Atomic force microscopy; Finite element method; Heart valves; Micropipette aspiration; Valve interstitial cell.


Figures

Figure 1
Figure 1
VIC mechanical model. The nucleus is considered as an incompressible neo-Hookean material while the cytoplasm is considered as a solid mixture of the isotropic basal cytoskeleton and the actively contracting, oriented stress fibers. The stress fibers resist elastically to the stretch and also generate active contractile stress in the direction of the fibers.
Figure 2
Figure 2
The step-by-step calibration process. 1. The cytoskeletal shear modulus (μcyto) and α-SMA fiber shear modulus (μsf) were calibrated using the micropipette aspiration data for different types of VICs with different expression levels of α-SMA fibers. 2. Using the AFM indentation data on the cell peripheral regions, the fiber active contraction strength (f) were calibrated for AVICs and PVICs. 3. Using the AFM indentation data on the cell central region, the shear modulus of nucleus (μnuc) were calibrated for AVICs and PVICs. The parameters in red represents the ones that are being calibrated in the step, the parameters in gray represents the ones that are assumed not contribute to the mechanical response of the VICs (hence ignored) in the step, and the parameters in black represents the ones that are already calibrated from the previous steps and integrated into the model.
Figure 3
Figure 3
Micropipette aspiration simulation geometries. The negative pressure ΔP was applied on the boundary of the VIC in the micropipette while zero-pressure was prescribed on the boundary outside. The slip with zero friction contact boundary condition was prescribed between the VIC surface and micropipette wall. The applied pressures were, 0 Pa (initial configuration), ~60 Pa (tared configuration), and ~260 Pa (aspirated configuration) for A, B, and C, respectively. The aspiration length was determined as the difference in the z-displacement of the cell front tip between the aspirated and tared configurations, represented by an arrow in the figure.
Figure 4
Figure 4
Atomic force microscopy simulation setup with finite element mesh. We used a simplified geometry of the VIC and its nucleus, whose dimensions were taken from the experimental data. (a) The volume ratio of the nucleus was taken from the microscopy image of a VIC within the ECM. A scale bar represents 1 µm. (b) The dimension of the VICs were taken from the height map generated during the AFM experiments. The color represents the height at the point in µm and the scale bar represents 10 µm. The mesh was refined around the indentation region, with typically 10,000~50,000 linear tetrahedron elements. Note that this is a cross-section of the geometry, but we simulated the whole cell.
Figure 5
Figure 5
Two types of initial fiber orientations considered. (a) Left: initially cylindrical symmetric fiber orientation. At each point, the fiber orient uniformly on the plane whose normal is parallel to the normal vector of the top surface (represented by a blue arrow). Thus, the fibers orient along the tangential directions of the top surfaces. Right: initially spherically symmetric fiber orientation. Note that the figure is not drawn in scale. The actual VICs exhibit a very flat morphology. (b) Typical VIC geometry and fiber orientation seeded on a flat collagen gel. A nucleus (blue) was stained by DAPI while F-actin (green) was stained by phalloidin-FITC. The actin fibers primarily orient parallel to the surface.
Figure 6
Figure 6
The error surface generated by plotting the L2 norm of the residuals between the simulated and experimental aspiration lengths for different μsf and μcyto values. A clear global minimum occurs at μsf = 390 Pa and μcyto = 5.0 Pa, represented by a star.
Figure 7
Figure 7
Comparison of the applied pressure to the aspiration length to the experimental data. Data points shows the experiments data from Table 1, where the error bar represents the standard error. The VICs become stiffer as the expression levels of α-SMA stress fibers increases, causing the aspiration length to decrease for the same applied pressure.
Figure 8
Figure 8
The deformation contour due to for the central (left) and peripheral (right) indentations. Note that the deformation of the VIC is localized around the indentation region, yet the indentation at the central region indeed deforms the nucleus while the indentation at the peripheral region does not. Thus, the AFM indentation with sufficient depth can be used to analyze the nucleus mechanical properties.
Figure 9
Figure 9
Typical indentation depth vs force curve from the AFM experiment (dots) and simulation (lines) for the indentation on a cell central region and peripheral region. It is clear that the reaction force from the AFM indentation is significantly larger in the central region than the peripheral region, and the FEM simulation accurately capture the indentation depth vs force relationship in both regions.
Figure 10
Figure 10
Top: Contraction strength of the α-SMA fibers in the AVICs and PVICs under spherically symmetric fiber orientation (a) and cylindrically symmetric fiber orientations (b). About 9:1 ratio in the contraction strength was observed from AVICs to PVICs with cylindrical symmetry while 16:1 ratio was observed in spherical symmetry. Although the calibrated values of the contraction strength are different for different fiber orientation assumptions, the general trend is the same: the AVICs exhibit significantly stronger contraction than PVICs. Bottom: Shear moduli of the AVICs and PVICs under spherically symmetric fiber orientation (c) and cylindrically symmetric fiber orientation (d). The shear moduli of the VICs irrelevant to the fiber orientation assumptions or the fiber contraction activities.
Figure 11
Figure 11
(a) Traction field of a circular human tendon fibroblast obtained by the traction force microscopy method [48]. (b) Traction field of a contractile AVIC obtained by the simulation for cylindrical fiber orientation (left) and spherical fiber orientation (right). The color represents the magnitude of the traction while the arrows represent the directions. The spherically contracting VIC does not exert any traction on the substrate due to symmetry while the cylindrically contracting VIC pulls the substrates inward with maximum traction around the cell edge. The simulation of a cylindrically contracting VICs predicted very similar traction force pattern to the traction force microscopy experiments. The maximum traction force by cylindrically contracting VICs calculated are: ~1 kPa for the PVICs and ~10 kPa for the AVICs, where the typical traction force microscopy studies reported the maximum traction forces of various cells as: 0.2 kPa to 2.0 kPa [, –51].
Figure 12
Figure 12
Simulation of an infinitesimal AFM indentation. (a) The geometry before (top) and after (bottom) the indentation. (b) The relationship between the contraction strength and Hertz stiffness calculated from the simulated indentation depth vs reaction force relationship. Our simulations suggest that the more contractile cells exhibit higher stiffness values. Similar observations have been reported by previous studies: where the contractile cells exhibit higher stiffness values than non-contractile cells [14, 52]. Also, at no contraction (f=0 kPa), the Hertz stiffness converges to 400 Pa, which is consistent to Theret stiffness value measured by the MA study [11].

References

    1. Sacks MS, Merryman WD, Schmidt DE. On the biomechanics of heart valve function. Journal of Biomechanics. 2009;42(12):1804–1824. - PMC - PubMed
    1. Sacks MS, Schoen FJ, Mayer JE. Bioengineering challenges for heart valve tissue engineering. Annual Review of Biomedical Engineering. 2009;11:289–313. - PubMed
    1. Schoen FJ. Evolving concepts of cardiac valve dynamics: the continuum of development, functional structure, pathobiology, and tissue engineering. Circulation. 2008;118(18):1864–1880. - PubMed
    1. Roger VL, et al. Heart disease and stroke statistics--2012 update: a report from the American Heart Association. Circulation. 2012;125(1):e2–e220. - PMC - PubMed
    1. Mendelson KaS, J F. Heart Valve Tissue Engineering: Concepts, Approaches, Progress, and Challenges. Annals of Biomedical Engineering. 2006;34(12):1799–1819. - PMC - PubMed

Publication types

LinkOut - more resources