

Differential association of STK11 and TP53 with KRAS mutation-associated gene expression, proliferation and immune surveillance in lung adenocarcinoma
- PMID: 26477306
- PMCID: PMC4837098
- DOI: 10.1038/onc.2015.375
Differential association of STK11 and TP53 with KRAS mutation-associated gene expression, proliferation and immune surveillance in lung adenocarcinoma
Abstract
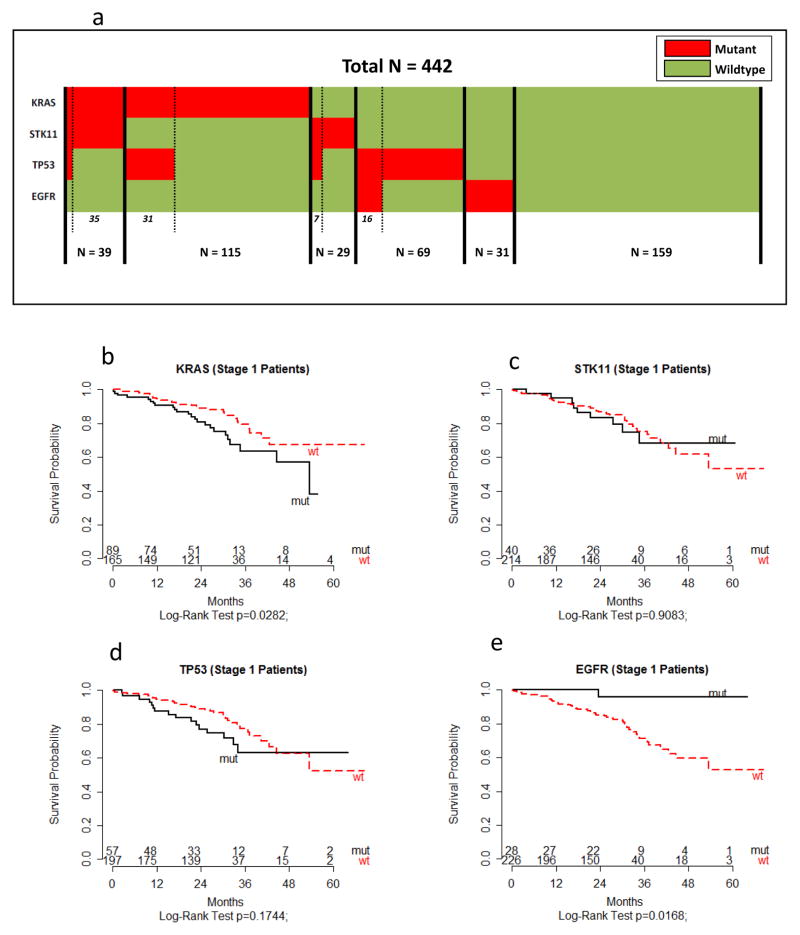
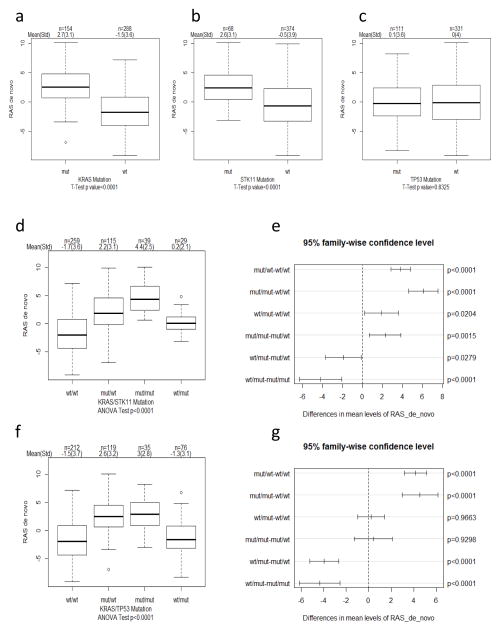
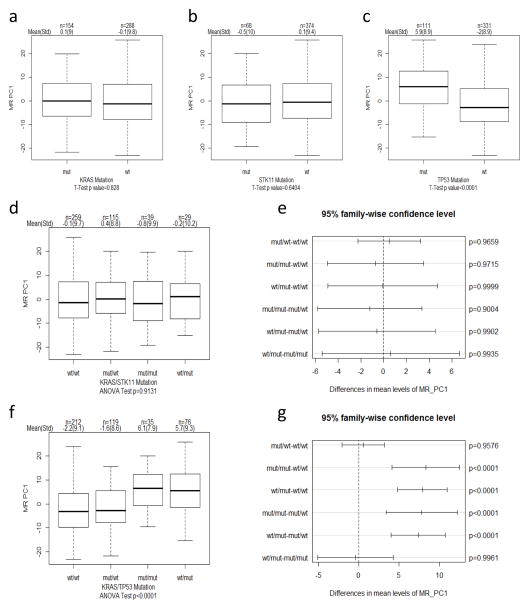
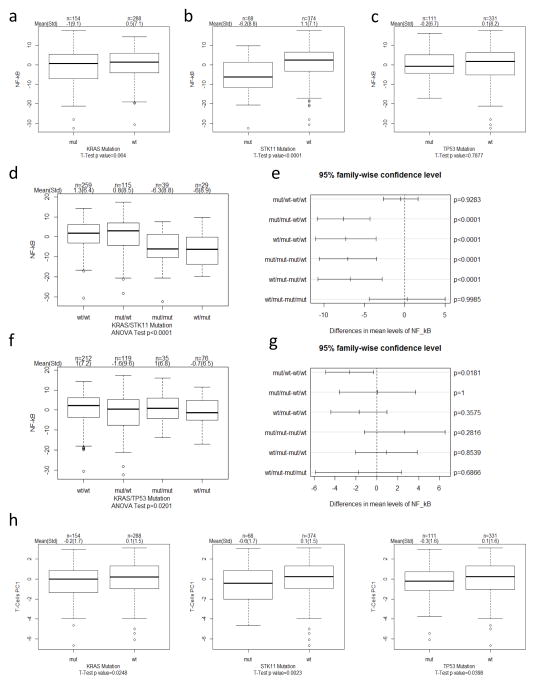
While mutations in the KRAS oncogene are among the most prevalent in human cancer, there are few successful treatments to target these tumors. It is also likely that heterogeneity in KRAS-mutant tumor biology significantly contributes to the response to therapy. We hypothesized that the presence of commonly co-occurring mutations in STK11 and TP53 tumor suppressors may represent a significant source of heterogeneity in KRAS-mutant tumors. To address this, we utilized a large cohort of resected tumors from 442 lung adenocarcinoma patients with data including annotation of prevalent driver mutations (KRAS and EGFR) and tumor suppressor mutations (STK11 and TP53), microarray-based gene expression and clinical covariates, including overall survival (OS). Specifically, we determined impact of STK11 and TP53 mutations on a new KRAS mutation-associated gene expression signature as well as previously defined signatures of tumor cell proliferation and immune surveillance responses. Interestingly, STK11, but not TP53 mutations, were associated with highly elevated expression of KRAS mutation-associated genes. Mutations in TP53 and STK11 also impacted tumor biology regardless of KRAS status, with TP53 strongly associated with enhanced proliferation and STK11 with suppression of immune surveillance. These findings illustrate the remarkably distinct ways through which tumor suppressor mutations may contribute to heterogeneity in KRAS-mutant tumor biology. In addition, these studies point to novel associations between gene mutations and immune surveillance that could impact the response to immunotherapy.
Figures
Similar articles
-
Effects of KRAS, STK11, KEAP1, and TP53 mutations on the clinical outcomes of immune checkpoint inhibitors among patients with lung adenocarcinoma.PLoS One. 2024 Jul 22;19(7):e0307580. doi: 10.1371/journal.pone.0307580. eCollection 2024. PLoS One. 2024. PMID: 39037971 Free PMC article.
-
Loss of STK11 Suppresses Lipid Metabolism and Attenuates KRAS-Induced Immunogenicity in Patients with Non-Small Cell Lung Cancer.Cancer Res Commun. 2024 Aug 1;4(8):2282-2294. doi: 10.1158/2767-9764.CRC-24-0153. Cancer Res Commun. 2024. PMID: 39113608 Free PMC article.
-
Mutation patterns in a population-based non-small cell lung cancer cohort and prognostic impact of concomitant mutations in KRAS and TP53 or STK11.Lung Cancer. 2019 Apr;130:50-58. doi: 10.1016/j.lungcan.2019.01.003. Epub 2019 Jan 9. Lung Cancer. 2019. PMID: 30885352
-
Targeting KRAS Mutant Non-Small-Cell Lung Cancer: Past, Present and Future.Int J Mol Sci. 2020 Jun 17;21(12):4325. doi: 10.3390/ijms21124325. Int J Mol Sci. 2020. PMID: 32560574 Free PMC article. Review.
-
Co-occurring genomic alterations in non-small-cell lung cancer biology and therapy.Nat Rev Cancer. 2019 Sep;19(9):495-509. doi: 10.1038/s41568-019-0179-8. Epub 2019 Aug 12. Nat Rev Cancer. 2019. PMID: 31406302 Free PMC article. Review.
Cited by
-
STK11 alterations in the pan-cancer setting: prognostic and therapeutic implications.Eur J Cancer. 2021 May;148:215-229. doi: 10.1016/j.ejca.2021.01.050. Epub 2021 Mar 19. Eur J Cancer. 2021. PMID: 33744718 Free PMC article.
-
Identification and validation of hypoxia-derived gene signatures to predict clinical outcomes and therapeutic responses in stage I lung adenocarcinoma patients.Theranostics. 2021 Mar 5;11(10):5061-5076. doi: 10.7150/thno.56202. eCollection 2021. Theranostics. 2021. PMID: 33754044 Free PMC article.
-
A Transcriptional Signature Identifies LKB1 Functional Status as a Novel Determinant of MEK Sensitivity in Lung Adenocarcinoma.Cancer Res. 2017 Jan 1;77(1):153-163. doi: 10.1158/0008-5472.CAN-16-1639. Epub 2016 Nov 7. Cancer Res. 2017. PMID: 27821489 Free PMC article.
-
Impact of KRAS and TP53 Co-Mutations on Outcomes After First-Line Systemic Therapy Among Patients With STK11-Mutated Advanced Non-Small-Cell Lung Cancer.JCO Precis Oncol. 2019;3:PO.18.00326. doi: 10.1200/PO.18.00326. Epub 2019 May 10. JCO Precis Oncol. 2019. PMID: 31428721 Free PMC article.
-
Lung-Enriched Mutations in the p53 Tumor Suppressor: A Paradigm for Tissue-Specific Gain of Oncogenic Function.Mol Cancer Res. 2019 Jan;17(1):3-9. doi: 10.1158/1541-7786.MCR-18-0357. Epub 2018 Sep 17. Mol Cancer Res. 2019. PMID: 30224539 Free PMC article. Review.
References
MeSH terms
Substances
Grants and funding
LinkOut - more resources
Full Text Sources
Other Literature Sources
Medical
Molecular Biology Databases
Research Materials
Miscellaneous
